 Open Access Article
Laboratory-scale near-edge X-ray absorption fine structure spectroscopy with a laser-induced plasma source
Matthias
Müller
 *,
Meike
Schellhorn
and
Klaus
Mann
Laser-Laboratorium Göttingen e.V., Hans-Adolf-Krebs-Weg 1, D-37077 Göttingen, Germany. E-mail: matthias.mueller@llg-ev.de
First published on 20th June 2019
Abstract
The authors present a compact soft X-ray spectrometer based on a long-term stable and nearly debris-free picosecond laser-induced plasma from a pulsed krypton gas jet target, suitable for near-edge X-ray absorption fine structure (NEXAFS) spectroscopy in the energy range between 250 to 1000 eV. Along with a detailed description of the table-top spectrometer reaching a spectral resolution of up to E/ΔE ≈ 500 at an energy of 430 eV, NEXAFS measurements were conducted at the carbon, nitrogen and oxygen K-edge. Additionally, oxidation state and coordination at the L-edge of various manganese and iron compounds were analyzed for the first time with a laboratory-scale NEXAFS system.
1. Introduction
Near-edge X-ray absorption fine structure (NEXAFS) spectroscopy is a well-established technique for elemental and compositional surface analysis of samples, probing electronic transitions from core levels to higher lying unoccupied states.1 Since initial and final state depend on the local electronic structure of the absorbing atom, spectral features of the near-edge fine structure yield unique information about the sample, including bond type and angle, oxidation state, coordination, and hybridization of molecular orbitals. As core level electrons are targeted, NEXAFS spectroscopy does not require long-range ordered structures (opposite to X-ray diffraction – XRD) and allows for the investigation of amorphous and poorly crystalline phases. In contrast to XRD and Fourier-transform infrared spectroscopy (FTIR), NEXAFS spectroscopy is element specific, but at the same time able to operate at different absorption edges simultaneously. Contrary to electron energy loss spectroscopy (EELS), sample analysis is not limited to ultra-high vacuum, but is possible also at ambient conditions (water, inert gases). Furthermore, radiation damage resulting from the high power density of the electron beam is problematic during EELS measurements, and charge effects impede EELS analysis of electrically non-conducting samples. In comparison to nuclear magnetic resonance (NMR) spectroscopy, magnetic and paramagnetic substances do not hamper NEXAFS measurements.Up to now, NEXAFS measurements are almost exclusively conducted at synchrotrons or free electron lasers, providing the necessary high photon flux in the X-ray spectral range. However, access to these large scale facilities is limited, and thus, there is a strong demand for compact NEXAFS tools. Although, there has been considerable progress in the development of laboratory-scale soft X-ray sources, such as laser- or discharge-produced plasmas2–8 and high-order harmonics (HHG),9–12 these sources have been employed for NEXAFS spectroscopy only a few times until now.13–19 In addition, except for previous own work including pump-probe experiments20 and investigations with samples at atmospheric pressure,21 all these measurements were restricted to photon energies below 500 eV. Recently, Popmintchev et al.22 demonstrated NEXAFS investigations at the K- and L-absorption edges of solids in the near-keV range using a HHG source, ideally suited for dynamic probing of materials on an attosecond time scale. However, to generate this radiation a large and complex laser system is needed requiring considerable experimental and technical effort. Thus, in order to pave the way for a wider dissemination of NEXAFS spectroscopy, there is definitely the need for further compaction and simplification of soft X-ray sources and spectrometers.
In this paper we demonstrate that soft X-ray absorption spectroscopy can be accomplished by an extremely compact setup, using a standard picosecond laser system along with a pulsed gas jet as inherently debris-free target for plasma generation, and a spectrometer based on a soft X-ray reflection grating. This spectrometer, operating with broad-band radiation in the energy range between 250 to 1000 eV, is characterized with respect to its spectral resolution. In addition, we present spectra from various organic and inorganic samples, showing an excellent agreement to synchrotron data and thus, proving the versatility of the table-top NEXAFS system for both quantitative and qualitative analysis.
2. Experimental details
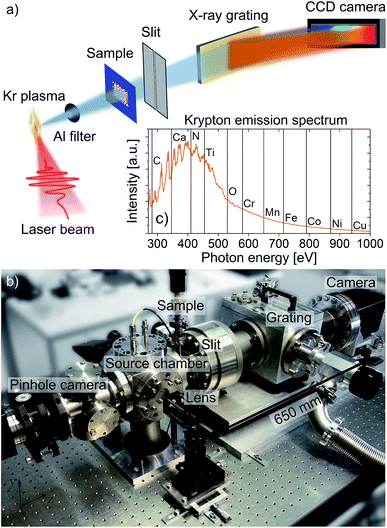
The setup for laboratory-scale NEXAFS measurements, basically consisting of laser-induced plasma source, sample holder and spectrometer, is depicted in Fig. 1. Due to the strong absorption of soft X-rays in matter, the system is evacuated to a base pressure of approximately 10−5 mbar. The plasma source is based on a Nd:YAG laser system (Ekspla SL312P, wavelength 1064 nm, pulse energy 500 mJ, pulse duration 170 ps) and a pulsed gas jet generated by a fast valve (Proch–Trickl setup23) and shaped by a conically diverging nozzle (diameter 300–550 μm). Due to the short valve opening time of 900 μs the working pressure does not exceed 10−2 mbar during operation (gas backing pressure 20 bar, repetition rate 5 Hz). The laser beam is focused by a f = 100 mm lens onto a krypton gas jet to generate a hot and dense plasma emitting unpolarized, incoherent and broad-band radiation in the soft X-ray spectral range between 250 and 1000 eV (see Fig. 1c). Out-of-band radiation, such as scattered laser radiation or visible light, is blocked by a 200 nm thick aluminum filter. The krypton plasma size is 0.37 × 0.24 mm2 (FWHM), as measured by a pinhole camera composed of a pinhole (diameter 50 μm) equipped with a titanium foil (thickness 200 nm) and a phosphor coated CCD chip (Sony ICX285, 6.45 × 6.45 μm2 pixel size, 1280 × 1024 pixels) being sensitive for soft X-ray radiation.The home-built NEXAFS spectrometer consists of an entrance slit (variable width 0–400 μm), an aberration-corrected concave flat-field grating (Hitachi,24 2400 grooves per mm, wavelength range 1–5 nm), and a back-thinned, back-illuminated CCD camera (Roper Scientific, 13 × 13 μm2 pixel size, 2048 × 512 pixels). To reduce its intrinsic thermal noise, the camera is cooled down to −30 °C during acquisition. Furthermore, all spectra are background corrected to account for systematic camera non-uniformities. For NEXAFS measurements, up to six samples are mounted on a linear motion stage for alignment in the soft X-ray beam. The distance between plasma source and sample plane as well as sample and entrance slit is about 100 mm and 80 mm, respectively. These short distances ensure that the spectral intensity is sufficient for NEXAFS experiments especially at photon energies above 500 eV.
To calibrate the spectrometer, emission spectra of light elements such as nitrogen and oxygen are used. Their characteristic lines are assigned to the corresponding transitions and compared with tabulated data from the NIST Atomic Spectra Database.25 Additionally, characteristic peaks of polyimide, goethite and elemental copper, whose absorption spectra were determined very precisely at synchrotron beam sources, are also measured and assigned to the corresponding photon energies. Finally, a 5th degree polynomial was adapted to the data points enabling a conversion of camera pixels into photon energies.
In contrast to synchrotron measurements, where the photon energy is varied sequentially to measure absorption spectra, the entire energy spectrum can be recorded in ‘single shot’ with the table-top NEXAFS spectrometer due to the broad-band emitting krypton plasma (see Fig. 1c).
3. Results and discussion
3.1 Spectral resolution
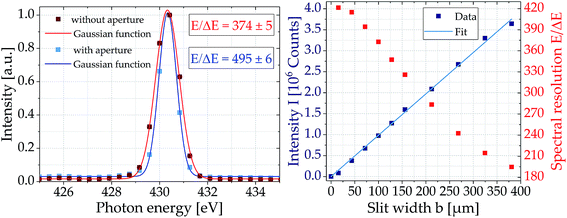
Resolution is a key parameter of spectrometers describing the ability to separate two spectral lines close to each other according to the Rayleigh criterion. Usually it is given as dimensionless parameter E/ΔE, with E being the mean energy and ΔE the energy difference between the two lines. In practice, however, resolution is mostly obtained using only a single spectral line whose natural line width is below the resolving power of the spectrometer. Here, the isolated emission line of N5+ ions at E = (430.33 ± 0.01) eV was chosen (see Fig. 2). Adapting a Gaussian function, a width of ΔE = (1.15 ± 0.01) eV (FWHM) was determined resulting in a spectral resolution of E/ΔE = 374 ± 5. The spectrometers entrance slit was set to 100 μm for this measurement.To evaluate the influence of the entrance slit width on the spectral resolution, the same nitrogen line was recorded for different slit widths between 10 and 380 μm (see Fig. 2). As expected, the narrower the slit, the better the resolution of the spectrometer, but the lower the intensity of the nitrogen line. In contrast to the intensity, the increase of resolution is not linear to the slit width, but flattens for slit widths smaller 100 μm. Thus, the entrance slit was set to 100 μm for the measurements to achieve a sufficiently high intensity with only 10% reduced resolution.
However, spectral resolution is not only limited by the entrance slit width, but also by the size of the krypton plasma source, as the entrance slit is illuminated by a divergent beam. Depending on its origin in the plasma, the soft X-rays illuminate the grating at slightly different angles, and thus, are imaged to different positions on the CCD chip decreasing spectral resolution. To reduce the source size, a second slit (width 100 μm) was introduced into the beam path at a distance of about 15 mm from the plasma in addition to the entrance slit (width 100 μm) of the spectrometer. This results in a resolution of E/ΔE = 495 ± 6, i.e. an increase by a factor of 1.32 (see Fig. 2). Of course, an additional slit further reduces intensity and thus, the measurements described below are done without the source slit.
3.2 NEXAFS measurements
To prove the applicability of the laboratory-scale NEXAFS system, spectra of different samples at various absorption edges of the entire accessible energy range are presented in the following. The measured data are evaluated according to Lambert–Beer's law [eqn (1)] by dividing the sample spectrum I by the krypton emission spectrum I0, yielding the optical density OD, | (1) |
One common method to prepare appropriate samples is to dispense an aqueous solution on a Si3N4 carrier substrate commonly used in absorption spectroscopy measurements due to high transmission in the soft X-ray energy range and high stability. The NEXAFS spectrum of such a Si3N4 membrane (thickness 100 nm) was recorded at the nitrogen K-edge (see Fig. 3). The comparison with tabulated data27 shows an excellent agreement, not only for the energy position of the absorption edge, but also for its absolute value. Therefore, their use as carrier substrate does not distort the actual spectra of the examined samples, since the absorption of these membranes can be precisely determined and is accounted for in the calculation of the optical density.
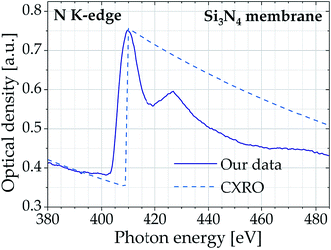 | ||
| Fig. 3 Nitrogen K-edge spectrum of a Si3N4 membrane (thickness 100 nm, accumulated over 1000 pulses) in comparison to tabulated data.27 | ||
Another possibility for the preparation of thin samples is to embed the material in epoxy resins, which can be precisely cut to thin sections down to 10 nm using a microtome. This technique is extensively applied for transmission electron microscopy, but also for X-ray absorption spectroscopy for many years. The absorption properties of the standard embedding epoxy resin Agar 100 were simultaneously measured at the carbon and oxygen K-edge. The samples were microtomed to sections of 100 and 200 nm thickness by D. Riedel (MPI for Biophysical Chemistry Göttingen) and mounted onto Si3N4 membranes (thickness 100 nm). The data displayed in Fig. 4 indicate the characteristic K-edge of carbon, featuring two distinct peaks at 284.6 eV and 288.6 eV which can be attributed to the C 1s–π* (C![[double bond, length as m-dash]](https://www.rsc.org/images/entities/char_e001.gif) C, aromatic ring) and C 1s–σ* (CH3) transition, respectively. Both samples also show a distinct feature at the oxygen K-edge. The peak positions at both absorption edges deviate by less than 0.2 eV (0.07%) to corresponding synchrotron data.28,29
C, aromatic ring) and C 1s–σ* (CH3) transition, respectively. Both samples also show a distinct feature at the oxygen K-edge. The peak positions at both absorption edges deviate by less than 0.2 eV (0.07%) to corresponding synchrotron data.28,29
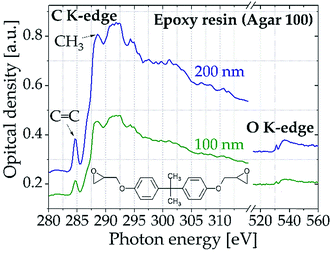 | ||
| Fig. 4 Carbon and oxygen K-edge spectra of epoxy resin (Agar 100) samples of different thickness (accumulated over 1000 pulses). The inset shows the structural formula of a common epoxy resin. | ||
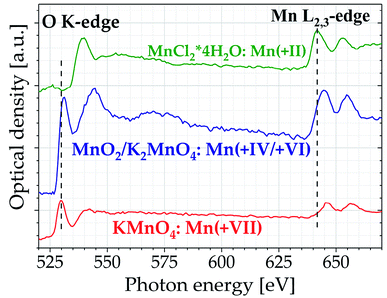
At photon energies above 500 eV different inorganic manganese- and iron-containing samples have been investigated. Oxygen K-edge and manganese L2,3-edge spectra of manganese dichloride, manganese oxide/potassium manganate, and potassium permanganate samples, all dispensed on Si3N4 membranes (thickness 100 nm), are displayed in Fig. 5.
The spectra of all three samples feature the characteristic splitting of the L-edge into L3 and L2 peak, representing electronic transitions to the 3d levels from the 2p3/2 and 2p1/2 levels, respectively.30 Furthermore, with increasing oxidation state there is a significant shift of the Mn L-edge positions to higher photon energies, since the remaining electrons are more strongly bound to the absorbing Mn core. The opposite effect can be seen at the oxygen K-edge, where the peaks are shifted to lower photon energies. These results agree very well with synchrotron studies by Cramer et al.31 and Zaharieva et al.32 reporting an average positional change of 1.1 eV per increment in oxidation state. The energy values of the Mn L-edge peaks differ less than 0.5% from these literature data. Apart from oxidation state, the spectra are also affected by the coordination of the manganese compounds, as can be seen from the energy difference ΔE3,2 between the L3 and L2 peak. Since manganese dichloride is in a high-spin 3d5 configuration with octahedral coordination, the 3d level splitting is greater compared to potassium permanganate which is tetrahedrally coordinated in a 3d0 configuration, resulting in a 0.8 eV larger energy difference between the L3 and L2 peak in manganese chloride.
Fig. 6 displays the oxygen K-edge and iron L2,3-edge spectra of hematite, a common Fe(III) iron oxide (Fe2O3). The samples with thicknesses of 25 to 85 nm were prepared on a Si3N4 membrane (thickness 100 nm) by A. Ismail and F. de Groot (University of Utrecht, Netherlands) using spray pyrolysis deposition. The results clearly show that NEXAFS spectra above 500 eV can be recorded with high quality at different absorption edges simultaneously.
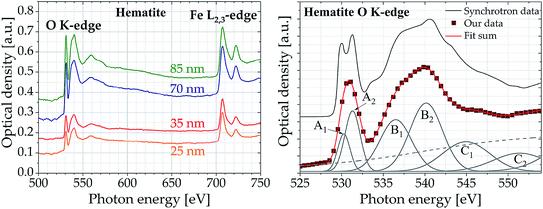 | ||
| Fig. 6 (Left) Oxygen K-edge and iron L2,3-edge spectra of hematite samples of different thickness (accumulated over 1000 pulses). (Right) NEXAFS spectrum of hematite sample (thickness 35 nm) at the oxygen K-edge fitted with 6 Gaussian peaks (thin solid lines) and one arctan function (thin dashed line) in comparison to synchrotron data.33 The samples have been provided by the group of F. de Groot (University of Utrecht, Netherlands). | ||
Even for the thinnest sample of only 25 nm thickness the spectra show distinct features, highlighting that the high sensitivity of NEXAFS spectroscopy is also achieved with the table-top system. The pre-edge feature A is attributed to transitions from O(1s) core states to antibonding O(2p) states hybridized with Fe(3d) states. Its splitting is interpreted as separation of the Fe(3d) t2g–eg symmetry bands by the oxygen octahedral crystal field. Therefore, the energy difference between the two peaks A1 and A2 is a direct measure for the strength of the ligand field. However, due to the lower spectral resolution compared to synchrotron measurements, the characteristic splitting of the pre-edge cannot be recorded directly in the data obtained with the table-top spectrometer (see Fig. 6b). Nevertheless, by adapting six Gaussian curves and one arc tangent function to the optical density the two peaks A1 and A2 can be extracted. The energy difference of 1.2 eV between peak A1 and A2 is consistent to literature values33–35 ranging from 1.2 to 1.4 eV, proving the spectrometers suitability for quantitative analysis of samples above 500 eV. Furthermore, the obtained energy values of the peaks at the oxygen K-edge deviate by less than 0.4% from synchrotron data taken by Brandt et al.33 (see Table 1).
| Peak | Transition | Energy [eV] | Literature value [eV] | Difference [%] |
|---|---|---|---|---|
| A1 | O(1s) → t2g-Fe(3d) | 531.0(3) | 529.0 | 0.23 |
| A2 | O(1s) → eg-Fe(3d) | 532.2(5) | 531.2 | 0.19 |
| B1 | O(1s) → Fe(4s, 4p) | 537.4(2) | 539.0 | 0.31 |
| B2 | O(1s) → Fe(4s, 4p) | 541.6(4) | 542.0 | 0.09 |
Although showing a strong signal at the iron L2,3-edge, the spectral resolution of the table-top spectrometer is not sufficient to resolve the splitting of the L3 and L2 peaks. Thus, the resolution shall be enhanced in future experiments, installing a grating with longer focal length. However, using the compact spectrometer it is possible to distinguish between iron containing samples of different oxidation states. Fig. 7 shows the optical density of hematite (iron oxide, Fe(III)), ferrihydrite (oxyhydroxide, Fe(III)) and CCa-2 chlorite (silicate, Fe(II)). All three samples were dispensed as aqueous solution on a Si3N4 membrane (thickness 100 nm). Again, the splitting of the peaks at the L2,3-edge is not visible. Nevertheless, the ratio of the optical density of L3- and L2-peak provides information about the proportion of different iron configurations in the sample: For Fe(II) it is lower than for Fe(III). As expected, the L3/L2 ratio for CCa-2 chlorite of 1.55 is significantly lower than for hematite and ferrihydrite of 2.23 and 2.46, respectively.
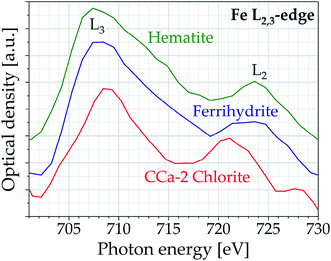 | ||
| Fig. 7 Iron L2,3-edge spectra of hematite, ferrihydrite and CCa-2 chlorite (accumulated over 1000 pulses). For better visibility the spectra are shifted along the y-axis. | ||
It should be noted that iron of the same oxidation state – as in hematite and ferrihydrite – is practically indistinguishable at the iron L2,3-edge even in synchrotron measurements.33 Differentiation is therefore usually done at the oxygen K-edge. This makes the table-top spectrometer a valuable instrument, as spectra can be measured simultaneously over the entire energy range, as shown before (see Fig. 5 and 6).
4. Conclusion
In this paper we have presented laboratory-scale NEXAFS spectroscopy in the soft X-ray energy range between 250 and 1000 eV. The table-top setup is based on a nearly debris-free, long-term stable laser-induced plasma source produced in a pulsed krypton gas jet and a home-built spectrometer. The NEXAFS spectra obtained are in excellent agreement to literature values or respective synchrotron data. The possibility of simultaneously recording for the first time high-quality spectra above 500 eV in less than 5 min at various absorption edges opens up new applications and allows, for instance, the analysis of the important 3d metals, e.g. manganese and iron. To gain even more information from the spectra, the resolution of the compact spectrometer shall be enhanced. Additionally, systematic investigations of the spectrometer sensitivity will be performed in the future. Apart from that, the brilliance of the plasma source needs to be improved, e.g. by increasing the repetition rate and by reducing the reabsorption in the target gas jet,36 to further reduce exposure times, thereby maintaining the compactness and inherent cleanliness of the source.Conflicts of interest
There are no conflicts of interest to declare.Acknowledgements
The authors would like to thank A. Ismail and F. de Groot (Univ. Utrecht) as well as D. Riedel (MPI for Biophysical Chemistry Göttingen) for preparing the hematite and Agar 100 samples, respectively. We also would like to thank Dr K. Eusterhues (Univ. Jena) for providing raw material of hematite, ferrihydrite and CCa-2 chlorite. Financial support by the “Deutsche Forschungsgemeinschaft” within “Sonderforschungsbereich 755” “Nanoscale Photonic Imaging” (Project C04) is gratefully acknowledged. M. Schellhorn thankfully acknowledges funding by “Deutsche Bundesstiftung Umwelt”.References
- J. Stöhr, NEXAFS Spectroscopy, Springer-Verlag, Berlin, Heidelberg, New York, 2003 Search PubMed.
- P. Jansson, U. Vogt and H. Hertz, Liquid-nitrogen-jet laser-plasma source for compact soft X-ray microscopy, Rev. Sci. Instrum., 2005, 76, 043503 CrossRef.
- P. Wachulak, A. Bartnik, H. Fiedorowicz, P. Rudawski, R. Jarocki, J. Kostecki and M. Szczurek, “Water window” compact, table-top laser plasma soft X-ray sources based on a gas puff target, Nucl. Instrum. Methods Phys. Res., Sect. B, 2010, 268, 1692–1700 CrossRef CAS.
- M. Müller, F.-C. Kühl, P. Großmann, P. Vrba and K. Mann, Emission properties of ns and ps laser-induced soft X-ray sources using pulsed gas jets, Opt. Express, 2013, 21, 12831 CrossRef PubMed.
- I. Mantouvalou, K. Witte, D. Grötzsch, M. Neitzel, S. Günther, J. Baumann, R. Jung, H. Stiel, B. Kanngießer and W. Sandner, High average power, highly brilliant laser-produced plasma source for soft X-ray spectroscopy, Rev. Sci. Instrum., 2015, 86, 035116 CrossRef PubMed.
- I. Fomenkov, N. Böwering, C. Rettig, S. Melnychuk, I. Oliver, J. Hoffman, O. Khodykin, R. Ness and W. Partlo, EUV discharge light source based on a dense plasma focus operated with positive and negative polarity, J. Phys. D: Appl. Phys., 2004, 37, 3266–3276 CrossRef CAS.
- K. Bergmann, F. Küpper and M. Benk, Soft X-ray emission from a pulsed gas discharge in a pseudospark like electrode geometry, J. Appl. Phys., 2008, 103, 123304 CrossRef.
- E. Wyndham, M. Favre, M. Valdivia, J. Valenzuela, H. Chuaqui and H. Bhuyan, Fast plasma discharge capillary design as a high power throughput soft X-ray emission source, Rev. Sci. Instrum., 2010, 81, 093502 CrossRef CAS PubMed.
- Z. Chang, A. Rundquist, H. Wang, M. Murnane and H. Kapteyn, Generation of coherent soft X rays at 2.7 nm using high harmonics, Phys. Rev. Lett., 1997, 79, 2967 CrossRef CAS.
- J. Seres, V. Yakovlev, E. Seres, C. Streli, P. Wobrauchschek, C. Spielmann and F. Krausz, Coherent superposition of laser-driven soft-X-ray harmonics from successive sources, Nat. Phys., 2007, 3, 878–883 Search PubMed.
- M. Zepf, B. Dromey, M. Landreman, P. Foster and S. Hooker, Bright quasi-phase-matched soft-X-ray harmonic radiation from argon ions, Phys. Rev. Lett., 2007, 99, 143901 CrossRef CAS PubMed.
- S. Cousin, F. Silva, S. Teichmann, M. Hemmer, B. Buades and J. Biegert, High-flux table-top soft X-ray source driven by sub-2-cycle, CEP stable, 1.85-μm 1-kHz pulses for carbon K-edge spectroscopy, Opt. Lett., 2014, 39, 5383–5386 CrossRef CAS PubMed.
- U. Vogt, T. Wilhein, H. Stiel and H. Legall, High resolution X-ray absorption spectroscopy using a laser plasma radiation source, Rev. Sci. Instrum., 2004, 75, 4606 CrossRef CAS.
- C. Peth, F. Barkusky and K. Mann, Near-edge X-ray absorption fine structure measurements using a laboratory-scale XUV source, J. Phys. D: Appl. Phys., 2008, 41, 105202 CrossRef.
- S. Teichmann, F. Silva. S. Cousin, M. Hemmer and J. Biegert, 0.5-keV Soft X-ray attosecond continua, Nat. Commun., 2016, 7, 11493 CrossRef CAS PubMed.
- I. Mantouvalou, K. Witte, W. Martyanov, A. Jonas, D. Grötzsch, C. Streeck, H. Löchel, I. Rudolph, A. Erko, H. Stiel and B. Kanngießer, Single shot near edge X-ray absorption fine structure spectroscopy in the laboratory, Appl. Phys. Lett., 2016, 108, 201106 CrossRef.
- B. Buades, D. Moonshiram, T. Sidiropoulos, I. Leon, P. Schmidt, I. Pi, N. Di Palo, S. Cousin, A. Picon, F. Koppens and J. Biegert, Dispersive soft X-ray absorption fine-structure spectroscopy in graphite with an attosecond pulse, Optica, 2018, 5, 502–506 CrossRef.
- P. Wachulak, M. Duda, A. Bartnik, A. Sarzynski, L. Wegrzynski, M. Nowak, A. Jancarek and H. Fiedorowicz, Compact system for near edge X-ray fine structure (NEXAFS) spectroscopy using a laser-plasma light source, Opt. Express, 2018, 26, 8260–8274 CrossRef CAS PubMed.
- P. Wachulak, M. Duda, A. Bartnik, L. Wegrzynski, T. Fok and H. Fiedorowicz, NEXAFS at nitrogen K-edge and titanium L-edge using a laser-plasma soft X-ray source based on a double-stream gas puff target, APL Photonics, 2019, 4, 030807 CrossRef.
- P. Großmann, I. Rajkovic, R. Moré, J. Norpoth, S. Techert, C. Jooß and K. Mann, Time-resolved near-edge x-ray absorption fine structure spectroscopy on photo-induced phase transitions using a tabletop soft-X-ray spectrometer, Rev. Sci. Instrum., 2012, 83, 053110 CrossRef PubMed.
- F.-C. Kühl, M. Müller, M. Schellhorn, K. Mann, S. Wieneke and K. Eusterhues, Near-edge X-ray absorption fine structure spectroscopy at atmospheric pressure with a table-top laser-induced soft X-ray source, J. Vac. Sci. Technol., A, 2016, 34, 041302 CrossRef.
- D. Popmintchev, B. Galloway, M.-C. Chen, F. Dollar, C. Mancuso, A. Hankla, L. Miaja-Avila, G. O'Neil, J. Shaw, G. Fan, S. Alisauskas, G. Adriukaitis, T. Balciunas, O. Mücke, A. Pugzlys, A. Baltuska, H. Kapteyn, T. Popmintchev and M. Murnane, Near-and extended-edge X-ray-absorption fine-structure spectroscopy using ultrafast coherent high-order harmonic supercontinua, Phys. Rev. Lett., 2018, 120, 093002 CrossRef CAS PubMed.
- D. Proch and T. Trickl, A high-intensity multi-purpose piezoelectric pulsed molecular beam source, Rev. Sci. Instrum., 1989, 60, 713 CrossRef CAS.
- https://www.hitachi-hightech.com/products/images/9797/ana-grating_05.pdf, accessed January 2019.
- https://physics.nist.gov/PhysRefData/ASD/lines_form.html, accessed January 2019.
- F. de Groot and A. Kotani, Core Level Spectroscopy of Solids, CRC Press Taylor & Francis Group, Boca Raton, London, New York, 2008 Search PubMed.
- B. Henke, E. Gullikson and J. Davis, X-ray interactions: photoabsorption, scattering, transmission, and reflection at E = 50-30,000 eV, Z = 1-92, At. Data Nucl. Data Tables, 1993, 54, 181–342 CrossRef CAS.
- T. Okajima, K. Teramoto, R. Mitsumoto, H. Oji, Y. Yamamoto, I. Mori, H. Ishii, Y. Ouchi and K. Seki, Polarized NEXAFS spectroscopic studies of poly(butylene terephthalate), poly(ethylene terephthalate), and their model compounds, J. Phys. Chem. A, 1998, 102, 7093–7099 CrossRef CAS.
- O. Dhez, H. Ade and S. Urquhart, Calibrated NEXAFS spectra of some common polymers, J. Electron Spectrosc. Relat. Phenom., 2003, 128, 85–96 CrossRef CAS.
- M. Grush, J. Chen, T. Stemmler, S. George, C. Ralston, R. Stibrany, A. Gelasco, G. Christou, S. Gorun, J. Penner-Hahn and S. Cramer, Manganese L-Edge X-ray Absorption Spectroscopy of Manganese Catalase from Lactobacillus plantarum and Mixed Valence Manganese Complexes, J. Am. Chem. Soc., 1996, 118, 65–69 CrossRef CAS.
- S. Cramer, F. de Groot, Y. Ma, C. Chen, F. Sette, C. Kipke, D. Eichhorn, M. Chan, W. Armstrong, E. Libby, G. Christou, S. Brooker, V. McKee, O. Mullins and J. Fuggle, Ligand field strengths and oxidation states from manganese L-edge spectroscopy, J. Am. Chem. Soc., 1991, 113, 7937–7940 CrossRef CAS.
- I. Zaharieva, P. Chernev, M. Risch, L. Gerencser, G. Bergren, D. Shevchenko, M. Anderlund, T. Wenig, M. Haumann and H. Dau, Towards a comprehensive X-ray approach for studying the photosynthetic manganese complex–XANES, Kα/Kβ/Kβ-satellite emission lines, RIXS, and comparative computational approaches for selected model complexes, J. Phys.: Conf. Ser., 2009, 190, 012142 CrossRef.
- F. Brandt, T. Schäfer, F. Claret and D. Bosbach, Heterogeneous formation of ferric oxide nanoparticles on chlorite surfaces studied by X-ray absorption spectromicroscopy (STXM), Chem. Geol., 2012, 329, 42–52 CrossRef CAS.
- E. Todd, D. Sherman and J. Purton, Surface oxidation of pyrite under ambient atmospheric and aqueous (pH = 2 to 10) conditions: electronic structure and mineralogy from X-ray absorption spectroscopy, Geochim. Cosmochim. Acta, 2003, 67, 881–893 CrossRef CAS.
- Z. Wu, S. Gota, F. Jollet, M. Pollak, M. Gautier-Soyer and C. Natoli, Characterization of iron oxides by X-ray absorption at the oxygen K edge using a full multiple-scattering approach, Phys. Rev. B, 1997, 55, 2570 CrossRef CAS.
- J. Holburg, M. Müller, K. Mann and S. Wieneke, Brilliance improvement of laser-produced extreme ultraviolet and soft X-ray plasmas based on pulsed gas jets, J. Vac. Sci. Technol., A, 2019, 37, 031303 CrossRef.
| This journal is © The Royal Society of Chemistry 2019 |

![[thin space (1/6-em)]](https://www.rsc.org/images/entities/char_2009.gif) 000 pulses). For better visibility the spectra are shifted along the
000 pulses). For better visibility the spectra are shifted along the