 Open Access Article
Detection of tritium using ultrafast laser-induced breakdown spectroscopy
Sivanandan S.
Harilal
 *a,
Abdul K.
Shaik
a,
Elizabeth J.
Kautz
 ab,
Arun
Devaraj
 a,
Andrew M.
Casella
a and
David J.
Senor
a
aPacific Northwest National Laboratory, Richland, Washington 99354, USA. E-mail: hari@pnnl.gov
bNuclear Engineering Department, North Carolina State University, Raleigh, North Carolina 27695, USA
First published on 5th February 2024
Abstract
Detection of nuclear materials and their radioisotopes with rapid, and standoff capability in addition to no sample preparation requirement is crucial to nuclear nonproliferation, safeguards, and security. In this work, we demonstrate the first application of ultrafast laser-induced breakdown spectroscopy to detect tritium (3H) during depth profiling of neutron-irradiated Zircaloy-4 samples.
Detection of radioactive nuclear materials and their isotopes is very important in numerous fields including nuclear nonproliferation, treaty verification, nuclear security, safeguards, fuel fabrication, and forensics.1,2 Some of the key required attributes for nuclear material detection for field analysis are rapid and non-contact detection with minimal to no sample preparation. Currently, mass spectrometry tools such as inductively coupled plasma mass spectrometry (ICP-MS), secondary ion mass spectrometry (SIMS), thermal ion mass spectrometry (TIMS), and atom probe tomography (APT) are regularly used for detecting U, Pu, H, Li and their isotopes.3–5 However, all of these techniques are laboratory-based and require extensive sample preparation. Mass spectrometry methods such as ICP-MS are capable of high precision measurements,6 whereas other instruments, e.g., nanoscale SIMS7 and APT,5 can map isotopes with nanometer-scale spatial resolution. Some of these techniques are not useful for obtaining spatial information (e.g., ICP-MS). On the other hand, although the high spatial resolution is possible with NanoSIMS or APT methods, they are not capable of surveying large sample areas that may be needed for post-irradiation examinations of fuel rods or tritium-producing burnable absorber rod (TPBAR) components.8
Optical spectroscopic tools (e.g., emission, absorption, and laser-induced fluorescence) can detect all nuclear materials and some of their isotopes, offering rapid, non-contact analytical capability of solid material when combined with laser ablation.2,9 Among these optical methods, laser-induced breakdown spectroscopy (LIBS) is most frequently used for isotopic analysis because of its non-intrusive nature and rapid in-field use.10–13 So far, LIBS has been successfully demonstrated for discriminating various nuclear-related materials isotopes such as U (235U/238U),2,10 Pu (239Pu/240Pu),14,15 Li (6Li/7Li),12,16 and H (1H/2H).17–20 LIBS has the ability to provide spatially resolved maps of H isotopes and perform depth profiling. In particular, when an ultrafast laser is used for ablation, improved spatial mapping and precision depth profiling capabilities can result, owing to its limited heat-affected zone in comparison to nanosecond pulsed lasers.2,21
One of the challenges associated with LIBS for isotopic analysis of light elements is the line broadening. LIBS requires thermal excitation which happens only at early times of laser-produced plasma evolution where various plasma broadening mechanisms dominate. In addition, the spectral resolution of an emission spectroscopy system is inherently limited by the instrumental broadening of the spectrograph. Although the isotopic shifts/splitting (IS) of the Hα (656.28 nm) is relatively large (1Hα − 2Hα ≈ 180 pm, 1Hα − 3Hα ≈ 240 pm) compared to transitions of other elements, the Hα emission from the plasma is inherently broadened because of its linear Stark effect. Being the lightest element in the periodic table, there should be significant Doppler broadening too in H transitions. Previous studies highlighted that a flowing inert-gas (e.g., Ar, He) and reduced pressure environment (≈10–50 Torr) provided good signal-to-noise ratios and narrower linewidths for H isotopic analysis.11,22
Tritium (3H) is a radioactive isotope of hydrogen that is used in a wide variety of applications, particularly as a fuel in fusion reactors, and in nuclear devices.23 Given the toxicity of 3H to humans and the environment, standoff sensing methods are needed, which becomes increasingly important in the context of post-irradiation examinations in which contact with radioactive materials should be minimized. 3H has a low natural abundance and therefore is produced via neutron irradiation of lithium-bearing pellets in nuclear reactors according to the following reaction: 6Li + n → 4He + 3H. The 3H then diffuses through the pellet to a surrounding Zircaloy-4 tube that acts as a 3H getter.8 Measurement of 3H stored in the getter using rapid, standoff methods would greatly enhance understanding of 3H produced during irradiation, and its distribution along the length and through the thickness of the getter material. In this work, we report the detection of 1H, 2H, and 3H from 2H-loaded (i.e., deuterated) and neutron-irradiated Zircaloy-4 using ultrafast LIBS. 2H-loaded Zircaloy-4 samples were used for the initial optimization experiments, while 3H in the Zircaloy was monitored/detected using ultrafast LIBS via depth profiling.
The LIBS experiments were carried out using pulses from a Ti:Sapphire laser (800 nm, ≈35 fs pulse duration, maximum energy ≈ 7 mJ). The laser was operated at 5 Hz. The spot size at the target was kept at ≈65 μm in diameter. The laser energy was attenuated using a combination of a half-wave plate and a thin-film polarizer. Two different cubic vacuum chambers (6 × 6 × 6 inches3) with identical features were used in the present experiment: (1) for experiments employing 2H-loaded Zircaloy-4, and (2) for irradiated samples because of the radiological safety constraints. Both chambers contained a pressure gauge, vacuum pump, and gas lines for controlling the gas environment and pressure in addition to optical windows for laser entrance and light collection. Initial experiments were carried out on a 2H-loaded Zircaloy-4 sample with ≈4300 ppm 2H to understand the impact of environmental parameters, such as ambient gas pressure and oxygen chemistry on optical signatures. The 2H-loaded sample was prepared using a custom-built high vacuum system, details of which are provided in our prior work.22 Spatially and depth-wise uniformity of 2H loading was noted in these samples. For 3H detection and analysis, a neutron-irradiated Ni-coated Zircaloy-4 sample was used. Neutron irradiation was carried out at the Watts Bar Nuclear Power Plant. The measured dose of the irradiated Zircaloy-4 sample prior to analysis was 11 mR at contact and 0.6 mR at 6 inches. Since neutron flux is expected to vary with space in a reactor,24 the 3H production and absorption in the Zircaloy-4 getter sample is also expected to vary spatially as well as with depth. Both 2H-loaded and irradiated samples are cylindrical rods.
The samples were positioned in the center of the vacuum chamber which was pumped using a rotary pump to a base pressure of 100 mTorr. The chamber was positioned on an x–y translator to provide a fresh target surface for ablation. Ar was used as the buffer gas. The pressure inside the chamber containing the 2H-loaded sample was varied to evaluate the optimal conditions of H isotope detection, and ablation depth/pulse. The chamber containing the irradiated sample was pumped down to 100 mTorr and then backfilled with argon to 45 Torr and the ambient environment was kept static during all data collection.
Spatially integrated, and time-resolved emission features were analyzed using a 0.75 m spectrograph consisting of 2400 grooves per mm grating (Spectrapro HRS-750, Princeton Instruments) and an intensified CCD (ICCD) as the detector (PIMAX4, Princeton Instruments). The measured spectral resolution at 632.8 nm using a He–Ne laser was ≈13 pm at full width half maximum (FWHM). The thermal emission from the plasma was collected near normal to the target using a planoconvex lens and focused onto a fiber bundle for light transport. For evaluating the plasma dynamics and drilling, an ICCD positioned orthogonal to the plasma expansion direction was used and time-resolved images of the plasma plumes were collected.
In the present work, due to radiological safety concerns associated with 3H, the LIBS measurements of irradiated samples were conducted in a static background pressure. Hence any presence of oxygen in the chamber (due to leakage or presence of H2O) may influence the analytical merits of 3H detection. So, the initial experiments were carried out using 2H-loaded Zircaloy-4 samples to understand the ambient pressure effects on signal intensity, linewidth, and the role of oxygen presence on H isotopic emission signatures.
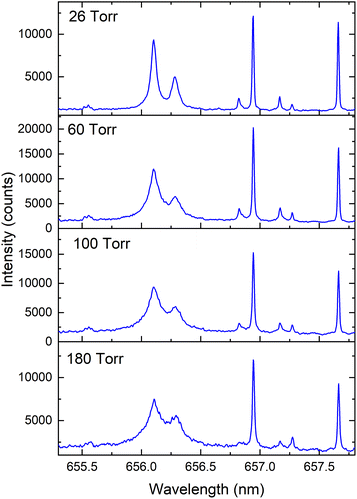
Typical spectral features from deuterated Zircaloy-4 plasma at various Ar pressures in the spectral range 655–658 nm are given in Fig. 1. The prominent emission lines in the spectra are 2Hα at 656.10 nm, 1Hα at 656.28 nm, Zr I at 656.95 nm and Zr I at 657.66 nm.25 The measurements were taken using a gate delay of 1 μs and with a gate width of 3 μs. The spectral features clearly show that at higher pressure, the 1Hα and 2Hα lines are partially resolved, and the isotopic resolution (peak separation) improves at reduced pressure. The presence of 1H in the spectral features is partly contributed by contamination on the sample surface and from the environment. The measured intensity of the 2Hα line along with its FWHM is provided in Fig. 2 which shows that 2Hα emission intensity peaks at ≈20–50 Torr Ar pressure levels. The linewidth, which is one of the most important considerations for isotopic analysis using optical spectroscopy, increases with pressure because of the plume confinement.26 The FWHMs of 2H and 1H are significantly broadened compared to Zr I transitions seen in Fig. 1. For example, at 26 Torr pressure, the measured FWHM of Zr I transition is near the instrumental limit while the linewidth of 2Hα ≈ 80 pm. Since the emission from H and its isotopes peaks at early times of plasma evolution due to its very high upper energy level (≈12.3 eV), it is difficult to avoid the linear Stark contribution caused by the higher LPP electron density. Being the lightest element, the Doppler effect is also significant for H and its isotopes. For example, for a plasma with a 1 × 1015 cm−3 density and a temperature of 4000 K, the estimated linewidths caused by Stark and Doppler effects are ≈15 pm. In addition, fine spectral components are present in the 1Hα and 2Hα lines which span ≈20 pm.25
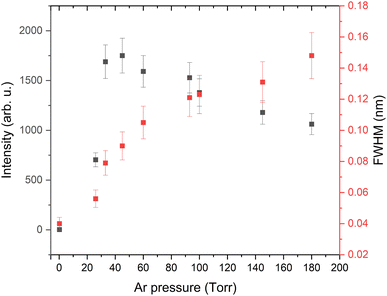 | ||
| Fig. 2 2Hα emission intensity (black squares) and FWHM (red squares) from deuterated Zircaloy plasma at various Ar pressure levels. | ||
Fig. 2 also shows that the pressure of the ambient medium has opposing effects on 2Hα signal levels and FWHM values when the background pressure is ≥30 Torr (i.e., intensity decreases, and FWHM increases). These trends highlight important trade-offs in the LIBS analysis of H and its isotopes, and that reduced pressures are optimal for achieving strong emission signals with reduced line broadening. The intensity and linewidth changes with pressure provided in Fig. 2 were also carried out when the inert gas flowed through the chamber rather than in static conditions. However, our studies also showed that a flowing inert gas environment provided a higher emission intensity of 2Hα instead of a static gas environment. Hence, a study has been carried out to evaluate the role of trace oxygen in the chamber on 1Hα and 2Hα emission intensities.
Fig. 3 reports changes in 2Hα and 1Hα emission intensities with the addition of air partial pressures to the chamber containing 35 Torr Ar, and it clearly shows that the increasing presence of oxygen partial pressure in the chamber deteriorates the 2Hα and 1Hα signal intensities. For example, with the addition of ≈300 mTorr of oxygen to the chamber, the 2Hα signal intensity reduced drastically. The presence of oxygen in the chamber may initiate plasma chemical reactions that lead to the formation of molecular species (OH and OD), affecting the analytical merits of the H isotopic emission signal. Previous studies employing U also showed similar trends (reduction of U I with the formation of UO and higher oxides).27
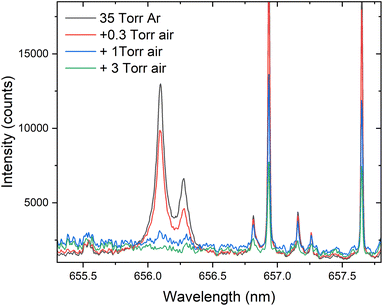 | ||
| Fig. 3 The changes in 1Hα and 2Hα intensity with the addition of partial pressures of air into 35 Torr Ar. | ||
Ultrafast laser depth profiling of the deuterated Zircaloy-4 sample was carried out to estimate ablation depth per pulse using gated plasma imaging.28 Images were collected by positioning an ICCD orthogonal to the plasma expansion direction and by monitoring the emission from the outer and inner surfaces of the cylindrical target. The laser energy and laser spot size used were ≈5.3 mJ and ≈65 μm. The emission from the inner surface of the cylinder appeared after 88 laser shots, indicating the presence of a drilled-thru hole. Assuming constant ablation depth per pulse, the estimated ablation efficiency of the Zircaloy target is ≈2 μm per pulse.
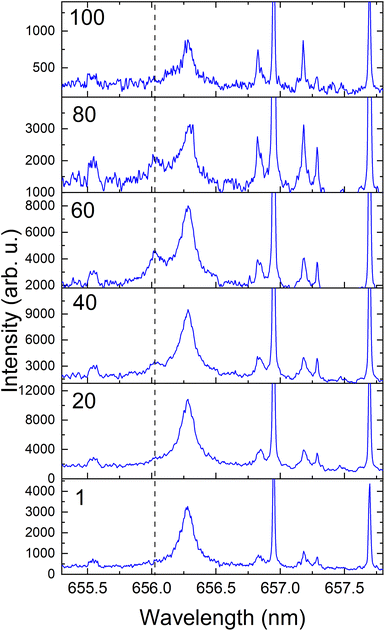
Considering 3H is toxic and volatile, the LIBS measurements of irradiated samples were all carried out in a static 45 Torr Ar environment. The 3H studied here was produced via neutron irradiation of a 6Li-enriched LiAlO2 ceramic pellet which was surrounded by a Zircaloy-4 tube that acts as a 3H getter. This Zircaloy-4 getter component is Ni-plated to prevent oxidation.8 Hence, a depth profiling study is required to detect 3H in the irradiated Zircaloy-4 getter target. An example of the measurement of 3Hα during depth profiling is given in Fig. 4. The 3H signal was not evident at shallow depths where 1Hα signal predominates. The 3Hα signal was more prominent when the number of laser shots at the target reached ≥40 during depth profiling. Then, the relative intensity of 3Hαvs.1Hα increased with the increasing number of laser shots. The signal levels dropped significantly after 80 laser shots. We also noticed the 3Hα signal intensity varies significantly at various locations in the irradiated target. The strong presence of 1Hα in the irradiated target is due to ingress through the TPBAR stainless steel cladding from the reactor coolant along with contamination.8
According to the present results, the 3H distribution in the Zircaloy getter sample was highly localized. The lack of 3H on the top of the surface can be attributed to the Ni-plating, which was used to prevent the oxidation of Zircaloy-4 surfaces during irradiation in a light-water reactor. Considering the nonuniform neutron flux in the reactor, it can be anticipated that the 3H deposition of the irradiated Zircaloy-4 getter sample could vary significantly along the surface and depth-wise due to the dynamic environment inside nuclear reactors. In addition, the permeation of 3H into the grain boundaries, the decay of the generated 3H, and the discrete nature of the hydrides in the Zircaloy may also contribute to nonuniform 3H concentration in the sample.29,30
Fig. 5 compares emission signatures from deuterated and irradiated Zircaloy-4 samples. The measured spectral positions of 1H, 2H, and 3H are 656.28 nm, 656.1 nm, and 658.03 nm, respectively. Since the spectral measurements given in Fig. 5 were carried out in 45 Torr Ar background pressure, significant spectral broadening can be seen and it may hinder measuring smaller isotopic splitting of 2Hα–3Hα compared to 1Hα–3Hα or 1Hα–2Hα isotopic splitting. It indicates that a reduced background pressure environment that provides narrower linewidths (see Fig. 2) is necessary for analyzing 2Hα–3Hα isotopic splitting.
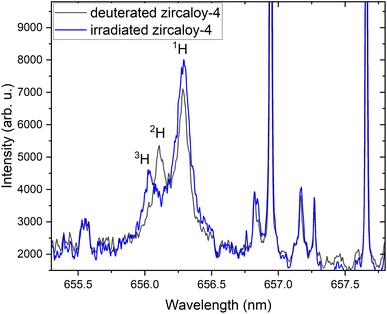 | ||
| Fig. 5 Comparison of emission signatures from deuterated and irradiated Zircaloy-4 samples showing all hydrogen isotopic peaks. | ||
In summary, we report the first demonstration of 3H detection using ultrafast LIBS. We monitored 1H, 2H, and 3H during depth profiling of deuterated and neutron-irradiated Zircaloy-4 samples. The 3H distribution in the Zircaloy sample was highly localized and well-resolved isotopic peaks were detected during depth profiling of irradiated targets. The present study highlights the successful use of ultrafast LIBS for the rapid detection of 3H with no sample preparation, with additional capabilities of spatial mapping and depth profiling.
Conflicts of interest
There are no conflicts to declare.Acknowledgements
This work was supported by the DOE/NNSA Tritium Modernization Program. The authors thank Ingrid Burgeson, Emily Campbell, and Ewa Ronnebro for arranging the samples, and PNNL's radiological protection technologists for their support. Pacific Northwest National Laboratory is a multi-program national laboratory operated by Battelle for the U.S. Department of Energy under Contract DE-AC05-76RL01830.Notes and references
- D. LaGraffe, Handbook of Security Science, Springer, 2022, pp. 795–827 Search PubMed.
- S. S. Harilal, B. E. Brumfield, N. L. LaHaye, K. C. Hartig and M. C. Phillips, Appl. Phys. Rev., 2018, 5, 021301 Search PubMed.
- S. Evers, C. Senöz and M. Rohwerder, Sci. Technol. Adv. Mater., 2013, 14, 014201 CrossRef PubMed.
- Y.-S. Chen, P.-Y. Liu, R. Niu, A. Devaraj, H.-W. Yen, R. K. Marceau and J. M. Cairney, Microsc. Microanal., 2023, 29, 1–15 CrossRef.
- A. Devaraj, B. Matthews, B. Arey, L. Bagaasen, E. Buck, G. Sevigny and D. Senor, Mater. Charact., 2021, 176, 111095 CrossRef CAS.
- G. Galbács, A. Kéri, I. Kálomista, É. Kovács-Széles and I. B. Gornushkin, Anal. Chim. Acta, 2020, 1104, 28–37 CrossRef.
- K. Li, J. Liu, C. R. Grovenor and K. L. Moore, Annu. Rev. Anal. Chem., 2020, 13, 273–292 CrossRef CAS.
- K. A. Burns, E. F. Love and C. K. Thornhill, Description of the Tritium-Producing Burnable Absorber Rod for the Commercial Light Water Reactor, Pacific Northwest National Laboratory report, PNNL-22086 technical report, 2012 Search PubMed.
- E. J. Kautz, M. C. Phillips and S. S. Harilal, J. Appl. Phys., 2021, 130, 203302 CrossRef CAS.
- D. A. Cremers, A. Beddingfield, R. Smithwick, R. C. Chinni, C. R. Jones, B. Beardsley and L. Karch, Appl. Spectrosc., 2012, 66, 250–261 CrossRef CAS PubMed.
- E. J. Kautz, A. Devaraj, D. J. Senor and S. S. Harilal, Opt. Express, 2021, 29, 4936–4946 CrossRef CAS PubMed.
- E. J. Kautz, A. Xu, A. V. Harilal, M. P. Polek, A. M. Casella, D. J. Senor and S. S. Harilal, Opt. Express, 2023, 31, 3549–3564 CrossRef CAS.
- J. Wu, Y. Qiu, X. Li, H. Yu, Z. Zhang and A. Qiu, J. Phys. D: Appl. Phys., 2019, 53, 023001 CrossRef.
- C. A. Smith, M. A. Martinez, D. K. Veirs and D. A. Cremers, Spectrochim. Acta, Part B, 2002, 57, 929–937 CrossRef.
- S. S. Harilal, C. M. Muryzn, E. J. Kautz, M. K. Edwards, S. I. Sinkov, S. S. Bisson and J. B. Martin, J. Anal. At. Spectrom., 2021, 36, 150–156 RSC.
- J. C. Wood and M. B. Shattan, Appl. Spectrosc., 2021, 75, 199–207 CrossRef CAS PubMed.
- M. Burger, P. Skrodzki, L. Finney, J. Hermann, J. Nees and I. Jovanovic, Phys. Plasmas, 2018, 25, 083115 CrossRef.
- R. Fantoni, S. Almaviva, L. Caneve, F. Colao, G. Maddaluno, P. Gasior and M. Kubkowska, Spectrochim. Acta, Part B, 2017, 129, 8–13 CrossRef CAS.
- E. J. Kautz, D. J. Senor and S. S. Harilal, J. Appl. Phys., 2021, 130, 204901 CrossRef CAS.
- K. H. Kurniawan, M. O. Tjia and K. Kagawa, Appl. Spectrosc. Rev., 2014, 49, 323–434 CrossRef CAS.
- V. Gardette, V. Motto-Ros, C. Alvarez-Llamas, L. Sancey, L. Duponchel and B. Busser, Anal. Chem., 2023, 95, 49–69 CrossRef CAS PubMed.
- E. J. Kautz, E. Ronnebro, A. Devaraj, D. Senor and S. S. Harilal, J. Anal. At. Spectrom., 2021, 36, 1217 RSC.
- H. Van Der Meiden, S. Almaviva, J. Butikova, V. Dwivedi, P. Gasior, W. Gromelski, A. Hakola, X. Jiang, I. Jõgi and J. Karhunen, et al. , Nucl. Fusion, 2021, 61, 125001 CrossRef CAS.
- B. Van der Ende, L. Li, D. Godin and B. Sur, Nat. Commun., 2019, 10, 1959 CrossRef CAS PubMed.
- A. Kramida, Yu. Ralchenko, J. Reader and and NIST ASD Team, NIST Atomic Spectra Database (Ver. 5.9), National Institute of Standards and Technology, Gaithersburg, MD, 2021, available: https://physics.nist.gov/asd Search PubMed.
- S. Harilal, C. Bindhu, M. Tillack, F. Najmabadi and A. Gaeris, J. Appl. Phys., 2003, 93, 2380–2388 CrossRef CAS.
- E. J. Kautz, E. N. Weerakkody, M. S. Finko, D. Curreli, B. Koroglu, T. P. Rose, D. G. Weisz, J. C. Crowhurst, H. B. Radousky and M. DeMagistris, et al. , Spectrochim. Acta, Part B, 2021, 185, 106283 CrossRef CAS.
- S. Harilal, M. Phillips, D. Froula, K. Anoop, R. Issac and F. Beg, Rev. Mod. Phys., 2022, 94, 035002 CrossRef CAS.
- A. T. Motta, L. Capolungo, L.-Q. Chen, M. N. Cinbiz, M. R. Daymond, D. A. Koss, E. Lacroix, G. Pastore, P.-C. A. Simon and M. R. Tonks, et al. , J. Nucl. Mater., 2019, 518, 440–460 CrossRef CAS.
- J. Bair, M. A. Zaeem and M. Tonks, J. Nucl. Mater., 2015, 466, 12–20 CrossRef CAS.
| This journal is © The Royal Society of Chemistry 2024 |

