
 Open Access Article
 This Open Access Article is licensed under a
 Creative Commons Attribution 3.0 Unported Licence
Introducing “time-of-flight single particle investigator” (TOF-SPI): a tool for quantitative spICP-TOFMS data analysis†
Alex
Gundlach-Graham
 *,
Stasia
Harycki
,
Sarah E.
Szakas
,
Tristen L.
Taylor
,
Hark
Karkee
,
Raven L.
Buckman
,
Shahnaz
Mukta
,
Rui
Hu
and
Woolin
Lee
*,
Stasia
Harycki
,
Sarah E.
Szakas
,
Tristen L.
Taylor
,
Hark
Karkee
,
Raven L.
Buckman
,
Shahnaz
Mukta
,
Rui
Hu
and
Woolin
Lee
Department of Chemistry, Iowa State University, Ames IA, 50011, USA. E-mail: alexgg@iastate.edu
First published on 15th January 2024
Abstract
Single-particle time-of-flight mass spectrometry (spICP-TOFMS) is quickly becoming an established method for the measurement, quantification, and classification of diverse populations of metal-containing nanoparticles (NPs) and submicron particles (μPs). As researchers begin to acquire larger multi-sample spICP-TOFMS datasets, robust batch-analysis programs are essential. To meet this need, our lab has developed and tested a set of spICP-TOFMS data analysis programs called “time-of-flight single particle investigator” or “TOF-SPI.” These programs are written in LabVIEW and are now available for use as a Windows executable program. TOF-SPI is developed for the analysis of data from icpTOF (TOFWERK AG) instruments and works directly with the instrument-generated HDF5 files. TOF-SPI is a data analysis program that assimilates years of spICP-TOFMS data analysis strategies to provide accurate single-particle finding, split-event correction, quantification of number concentrations, quantification of element mass amounts per particle, and generation of user-readable output reports. TOF-SPI is capable of performing batch analyses of spICP-TOFMS data calibrated with either the particle-size method or online microdroplet calibration. Here, we report the basic operating principles of TOF-SPI.
Background
Single-particle time-of-flight mass spectrometry (spICP-TOFMS) is becoming a widely used method for the measurement and classification of metal-containing nanoparticles (NPs) and submicron-to-micron-sized particles (μPs). In particular, ICP-TOFMS is currently the only ICP-MS instrument type that enables measurement of the full atomic mass range fast enough to record multi-elemental transient signals from the vaporization, atomization, and ionization of individual particles in the ICP.1–3 Single-particle ICP-TOFMS has been used broadly for the analysis of NPs or μPs from environmental samples,4–7 and for the classification naturally occurring and anthropogenic particles types based on recorded multi-element compositions.8–15 To date, many spICP-TOFMS studies rely on manufacturer-provided software to identify particle-derived signals, quantify element mass amounts per particle, and determine particle number concentrations (PNCs). While these software can be fit for purpose,16 we have found that current software options are often not flexible enough for users to adapt analysis procedures in accordance with the newest research findings or measurement approaches. For this reason, over the last several years, we have developed and extensively tested an in-house spICP-TOFMS data analysis software called the “time-of-flight single-particle investigator” or “TOF-SPI.” Our software is one of a growing number of free-use spICP-TOFMS data analysis software currently available.17 Here, we describe key aspects of TOF-SPI and the underpinning research upon which the programs are built.Description of TOF-SPI
The TOF-SPI programs are a set of data processing tools for the batch analysis of multi-elemental spICP-TOFMS data from icpTOF instruments (TOFWERK AG, Switzerland). With TOF-SPI, users can process spICP-TOFMS data collected with calibration (both for element mass amount per particle and number concentration) achieved either by the particle-size method18 or online microdroplet calibration.19,20 Online-microdroplet calibration is a matrix-matched calibration approach that improves measurement accuracy and throughput via the introduction of droplet calibration standards along with nebulized analyte-particle containing sample;21–23 with this approach sample-specific absolute sensitivities and transport efficiencies are recorded.19 TOF-SPI is written in LabVIEW (LabVIEW 2018, National Instruments Corp., TX, USA), and can be downloaded (https://github.com/TOFMS-GG-Group/TOF-SPI) and installed as an executable file that operates with the LabVIEW Runtime engine. A detailed user manual of TOF-SPI is provided on GitHub and as ESI.† TOF-SPI data processing steps are split between three programs—steps 1, 2 (a or b), and 3—that are performed sequentially. In Fig. 1, we provide a general workflow diagram of the TOF-SPI programs. In Table 1, we provide a summary of the user inputs and outputs of each step of TOF-SPI. In all steps TOF-SPI, processed data are saved back into the original icpTOF-generated HDF5 (Hierarchical Data Format 5) data files. The HDF5 file format is an open source file type well-suited for large files with heterogeneous data types, and writing TOF-SPI generated data back into the original HDF5 file offers enhanced traceability of data processing and good data management. All TOF-SPI programs can be used to process individual spICP-TOFMS data files or batches of spICP-TOFMS files. Batch file processing speeds up the work-flow for spICP-TOFMS analyses of many samples and so improves the overall through-put of the measurement technique. Below, we provide a brief description of the use of TOF-SPI for the analysis of spICP-TOFMS data collected with online-microdroplet calibration for the measurement of Ce-containing bastnaesite particles.13,14 This walk-through of the basic functions of TOF-SPI provides an overview of the technical merit and the approach of our software. A detailed explanation of all aspects and internal workings of TOF-SPI are beyond the scope of this technical note; interested readers may find more details in the TOF-SPI manual included as ESI.† | ||
| Fig. 1 General workflow of TOF-SPI programs for analysis of spICP-TOFMS data collected with calibration achieved with either online microdroplet calibration (top, green path) or external calibration via the particle-size method (bottom, blue path). Each spICP-TOFMS data file is processed in three steps—1, 2a, 3 or 1, 2b, 3—as indicated in the figure. | ||
| TOF-SPI program | User provided inputs | Output results |
|---|---|---|
| a sm – single-metal particle; mm—multi-metal particle. | ||
| 01_TOF-SPI_Bkgd LCs | • spICP-TOFMS HDF5 files | • Critical value expressions |
| • sp-region selection | • Time-dependent background count rates for all analytes | |
| • Analyte isotope list | ||
| • Single-ion-signal (SIS) detector calibration data | ||
| 02a_TOF-SPI_DropletCalib | • spICP-TOFMS HDF5 files | • qplasma (mL min−1) |
| • Droplet diameter (μm) | • Absolute sensitivities (TofCts g−1) of all analyte elements | |
| • Concentrations of elements in droplets | ||
| • Dissolved plasma uptake concentrations in samples | ||
| 02b_TOF-SPI_LiquidCalib | • spICP-TOFMS HDF5 files | • qplasma (mL min−1) |
| • Reference NP spICP-TOFMS file | • Absolute sensitivities (TofCts g−1) of all analyte elements | |
| • Reference NP size | ||
| • ICP-TOFMS liquid calibration files | ||
| • Concentrations of elements in liquid calibration | ||
| • Sample uptake rate | ||
| 03_TOF-SPI_ParticleQuant | • spICP-TOFMS HDF5 files | • Dynamic alpha rates |
| • Dynamic alpha NPs:Bkgd ratio | • Split-event corrected particle-derived signals | |
| • Analyte element selection | • Element mass amount per particle | |
| • Split-event correction method selection | • Number concentrations of all particle types (sm and mm)a | |
| • Output report selection | • Report(s) of results along with pertinent metadata | |
Step 1: “01_TOF-SPI_Bkgd LCs”. In the first step of TOF-SPI, a user defines the analyte elements and isotope(s) of interest, sets the single-particle region of interest on the TOF-MS time trace(s), and defines the critical value expression calculation parameters. The program calculates critical value expressions and determines the time-dependent background count rates for all analytes.
In Fig. 2a, we provide an example time trace of ICP-TOFMS data collected with online microdroplet calibration from the analysis of Ce-rich bastnaesite NPs.13 In TOF-SPI, analyte signals are extracted from integrated mass spectral peak data from icpTOF-generated HDF5 files and the user specifies these analytes, which can be the signals from one isotope or a combination of isotope signals that are summed together. The user also sets single particle region (sp-region) boundaries to separate droplet calibration regions for all spICP-TOFMS files (see Fig. 2a). The user also either uploads or selects the path of the measured single-ion-signal (SIS) histogram, which is used to determine mass-dependent critical value (LC) expressions for a range of type-I error rates, i.e. “alpha” values,24 from α = 1 × 10⁻⁷ to α = 0.01. LC expressions are estimated with Monte Carlo simulations of compound Poisson distributed ICP-TOFMS signals, as previously demonstrated.25–27 In spICP-MS, the critical value is the signal level above which all signals are deemed to be particle-derived.28,29 In Fig. 2b, we provide an example of the LC expressions determined with TOF-SPI for the analytes La and Ce (m/z 139 and 140, respectively). The slope and intercept of all mass-dependent LC expressions are saved to the HDF5 file for use in subsequent TOF-SPI steps. To use LC expressions for finding particle-derived signals, the steady-state background signal (λbkgd, TofCts) for each analyte element must be determined. These background signal levels arise from sample-specific dissolved element concentrations, plasma species, and instrument drift. With TOF-SPI, time-dependent λbkgd values for all analytes are determined automatically through iterative outlier analysis with LC at α = 1 × 10⁻³ as the outlier boundary used to distinguish between particle-derived and background signals. In Fig. 3, we provide time-dependent determined λbkgd values per 2000 data points for chosen analyte elements. In TOF-SPI, iterative outlier analysis is only used to determine the λbkgd values; these λbkgd values along with LC expressions are then used to find particle signals in step 3. Separating iterative outlier analysis from particle-finding thresholds has been shown to be a robust strategy for spICP-MS data analysis.30
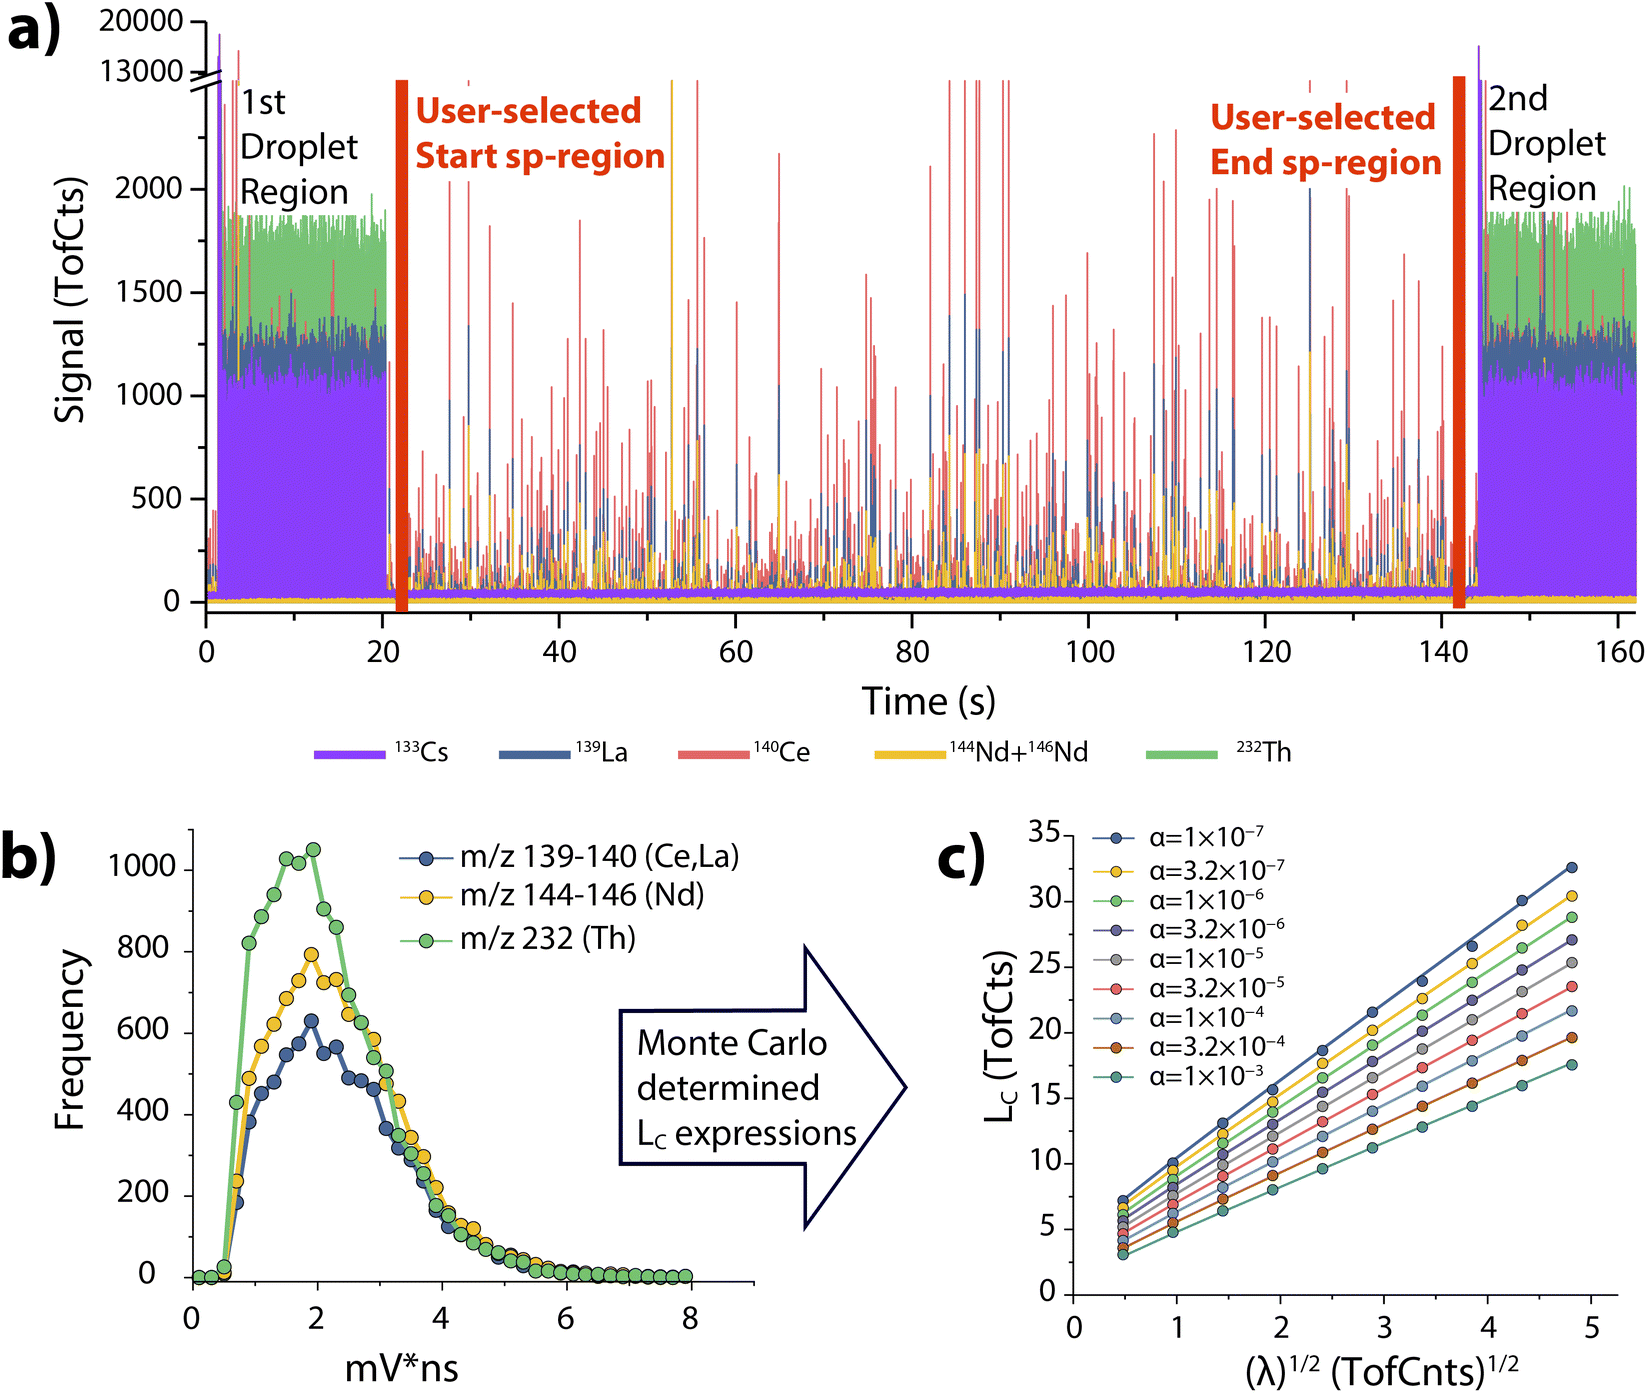 | ||
| Fig. 2 (a) In the first step of TOF-SPI, the user identifies the start and end points of the sp-region on the ICP-TOFMS time trace, which separate the droplet regions from the region with only particle-derived signals. (b) The user also loads and/or selects the TOF signal-ion-signal (SIS) histogram for the day's measurements and (c) TOF-SPI constructs mass-dependent critical value (LC) expressions based on Poisson-distributed ion signals compounded with the SIS noise. | ||
 | ||
| Fig. 3 Time-dependent average background signals (λbkgd) for analyte elements are determined in the first step of TOF-SPI. These λbkgd values are based on iterative outlier analysis with LC at α = 0.001 as the outlier boundary. Background value arrays are saved to the HDF5 file and used in step 3 of TOF-SPI for particle finding. | ||
Step 2: “02a_TOF-SPI_DropletCalib”. In step 2a of TOF-SPI, absolute sensitivities (TofCts g−1) and plasma uptake rates (qplasma, mL s−1) are determined using online microdroplet calibration.19 In Fig. 4, we provide example data from online microdroplet calibration. As part of this analysis, the user inputs droplet size and analyte concentrations (in units of μm and ng mL−1, respectively). Droplet-derived signals are then found with automated peak thresholding using signals from the plasma uptake standard (see Fig. 4a). In our studies, we often use Cs as the uptake standard because it is water soluble and not typically found as a particulate in routine sample types, such as freshwater.15 After finding droplet-derived signals, the average intensities and absolute sensitivities of all analyte elements in the calibrant microdroplets are determined; histograms of analyte signals from microdroplets are provided in Fig. 2b. Through dividing the absolute sensitivity of the plasma uptake standard by the relative sensitivity from dissolved uptake standard (e.g. Cs) spiked into each sample, the plasma uptake rate (qplasma, mL s−1) is also determined. If spICP-TOFMS data is collected with calibration via the particle-size method,18 then “02b_TOF-SPI_LiquidCalib” can be used to establish analyte absolute sensitivities and qplasma values.
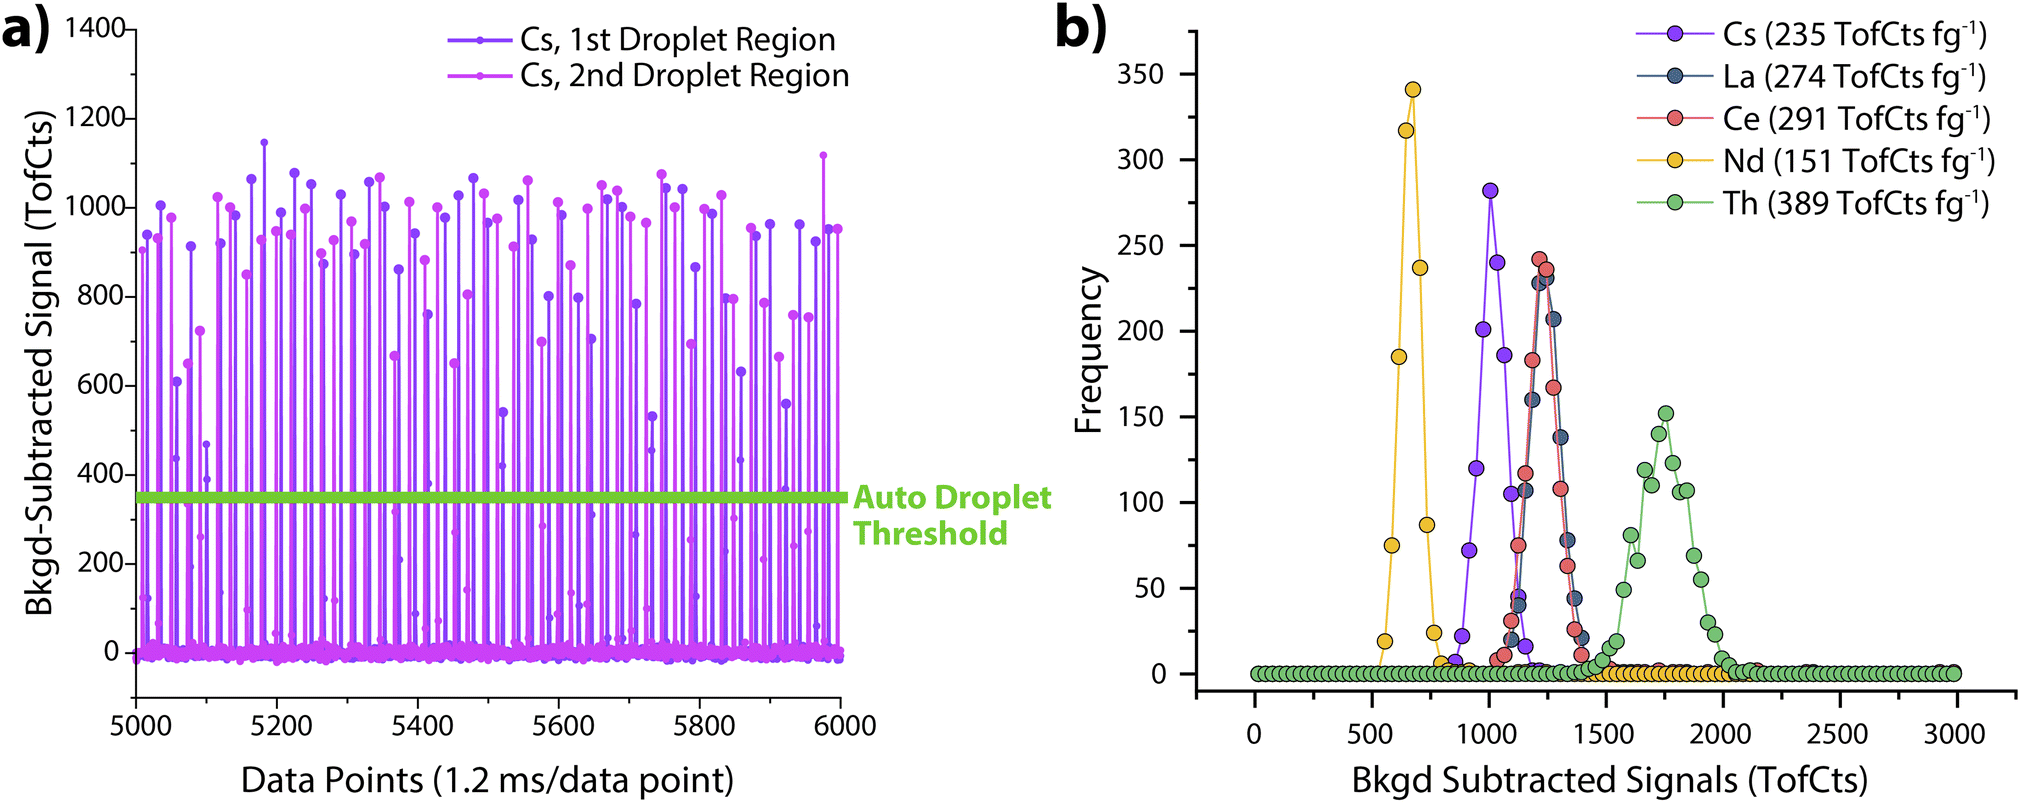 | ||
| Fig. 4 (a) A small region (1000 data points, 1.2 s) of droplet signals from the plasma uptake standard, i.e. Cs. Droplets are typically introduced into the ICP at 40–50 Hz. (b) Histograms of analyte signals from the droplets are used to determine average absolute sensitivities (shown in parentheses in the legend). The droplets for this measurement were ∼64 μm in diameter and the concentrations of all analyte elements were ∼30 ng mL−1. | ||
Step 3: “03_TOF-SPI_ParticleQuant”. In step 3, signals are background subtracted, particle-derived signals are found, split-events are corrected,31 mass amounts of elements per particle and particle-number concentrations are determined, and reports and data files are generated. This step can be used with spICP-TOFMS data that has already been processed by step 1 and 2 (a or b), or with data that is only processed in step 1 (i.e. without calibration via online microdroplet calibration or the particle-size method). Prior to detecting particle-events, data from the preceding TOF-SPI steps are used to determine element- and sample-specific critical values. The critical value for each analyte element, i, is determined with a dynamic alpha approach, as first reported by Mehrabi et al.10 In this approach, LC,sp,i is adjusted so that the number of measured particle-derived events of a given element (i.e. events above LC,sp,i) divided by the number of predicted false-positive events (as defined by the false-positive rate, α) is greater than a user-defined ratio we call the “NPs![[thin space (1/6-em)]](https://www.rsc.org/images/entities/char_2009.gif) :Bkgd ratio.” This approach allows us to control the fraction of particle events that come from background signals, while also setting the LC,sp value as low as possible to record small (and real) NP events. We typically set the NP:Bkgd ratio between 100 and 1000, because this keeps the fraction of false-positive particle events below 1% and allows for some uncertainty in the accuracy of the predicted false-positive rate.27 In Fig. 5a, a graphical representation of the dynamic alpha approach is presented for a NP:Bkgd ratio = 1000. Here, we can see that the dynamic alpha values for La, Ce, and Nd are higher than that for Th; this occurs because more particles containing La, Ce, and Nd are measured than those containing Th, and so we can tolerate a higher likelihood of false-positive particle events for these abundant elements. Manual thresholding of spICP-TOFMS data is not possible in TOF-SPI; instead, well-characterized LC,sp-based thresholding provides robust, reproducible, and user-independent particle finding.
:Bkgd ratio.” This approach allows us to control the fraction of particle events that come from background signals, while also setting the LC,sp value as low as possible to record small (and real) NP events. We typically set the NP:Bkgd ratio between 100 and 1000, because this keeps the fraction of false-positive particle events below 1% and allows for some uncertainty in the accuracy of the predicted false-positive rate.27 In Fig. 5a, a graphical representation of the dynamic alpha approach is presented for a NP:Bkgd ratio = 1000. Here, we can see that the dynamic alpha values for La, Ce, and Nd are higher than that for Th; this occurs because more particles containing La, Ce, and Nd are measured than those containing Th, and so we can tolerate a higher likelihood of false-positive particle events for these abundant elements. Manual thresholding of spICP-TOFMS data is not possible in TOF-SPI; instead, well-characterized LC,sp-based thresholding provides robust, reproducible, and user-independent particle finding.
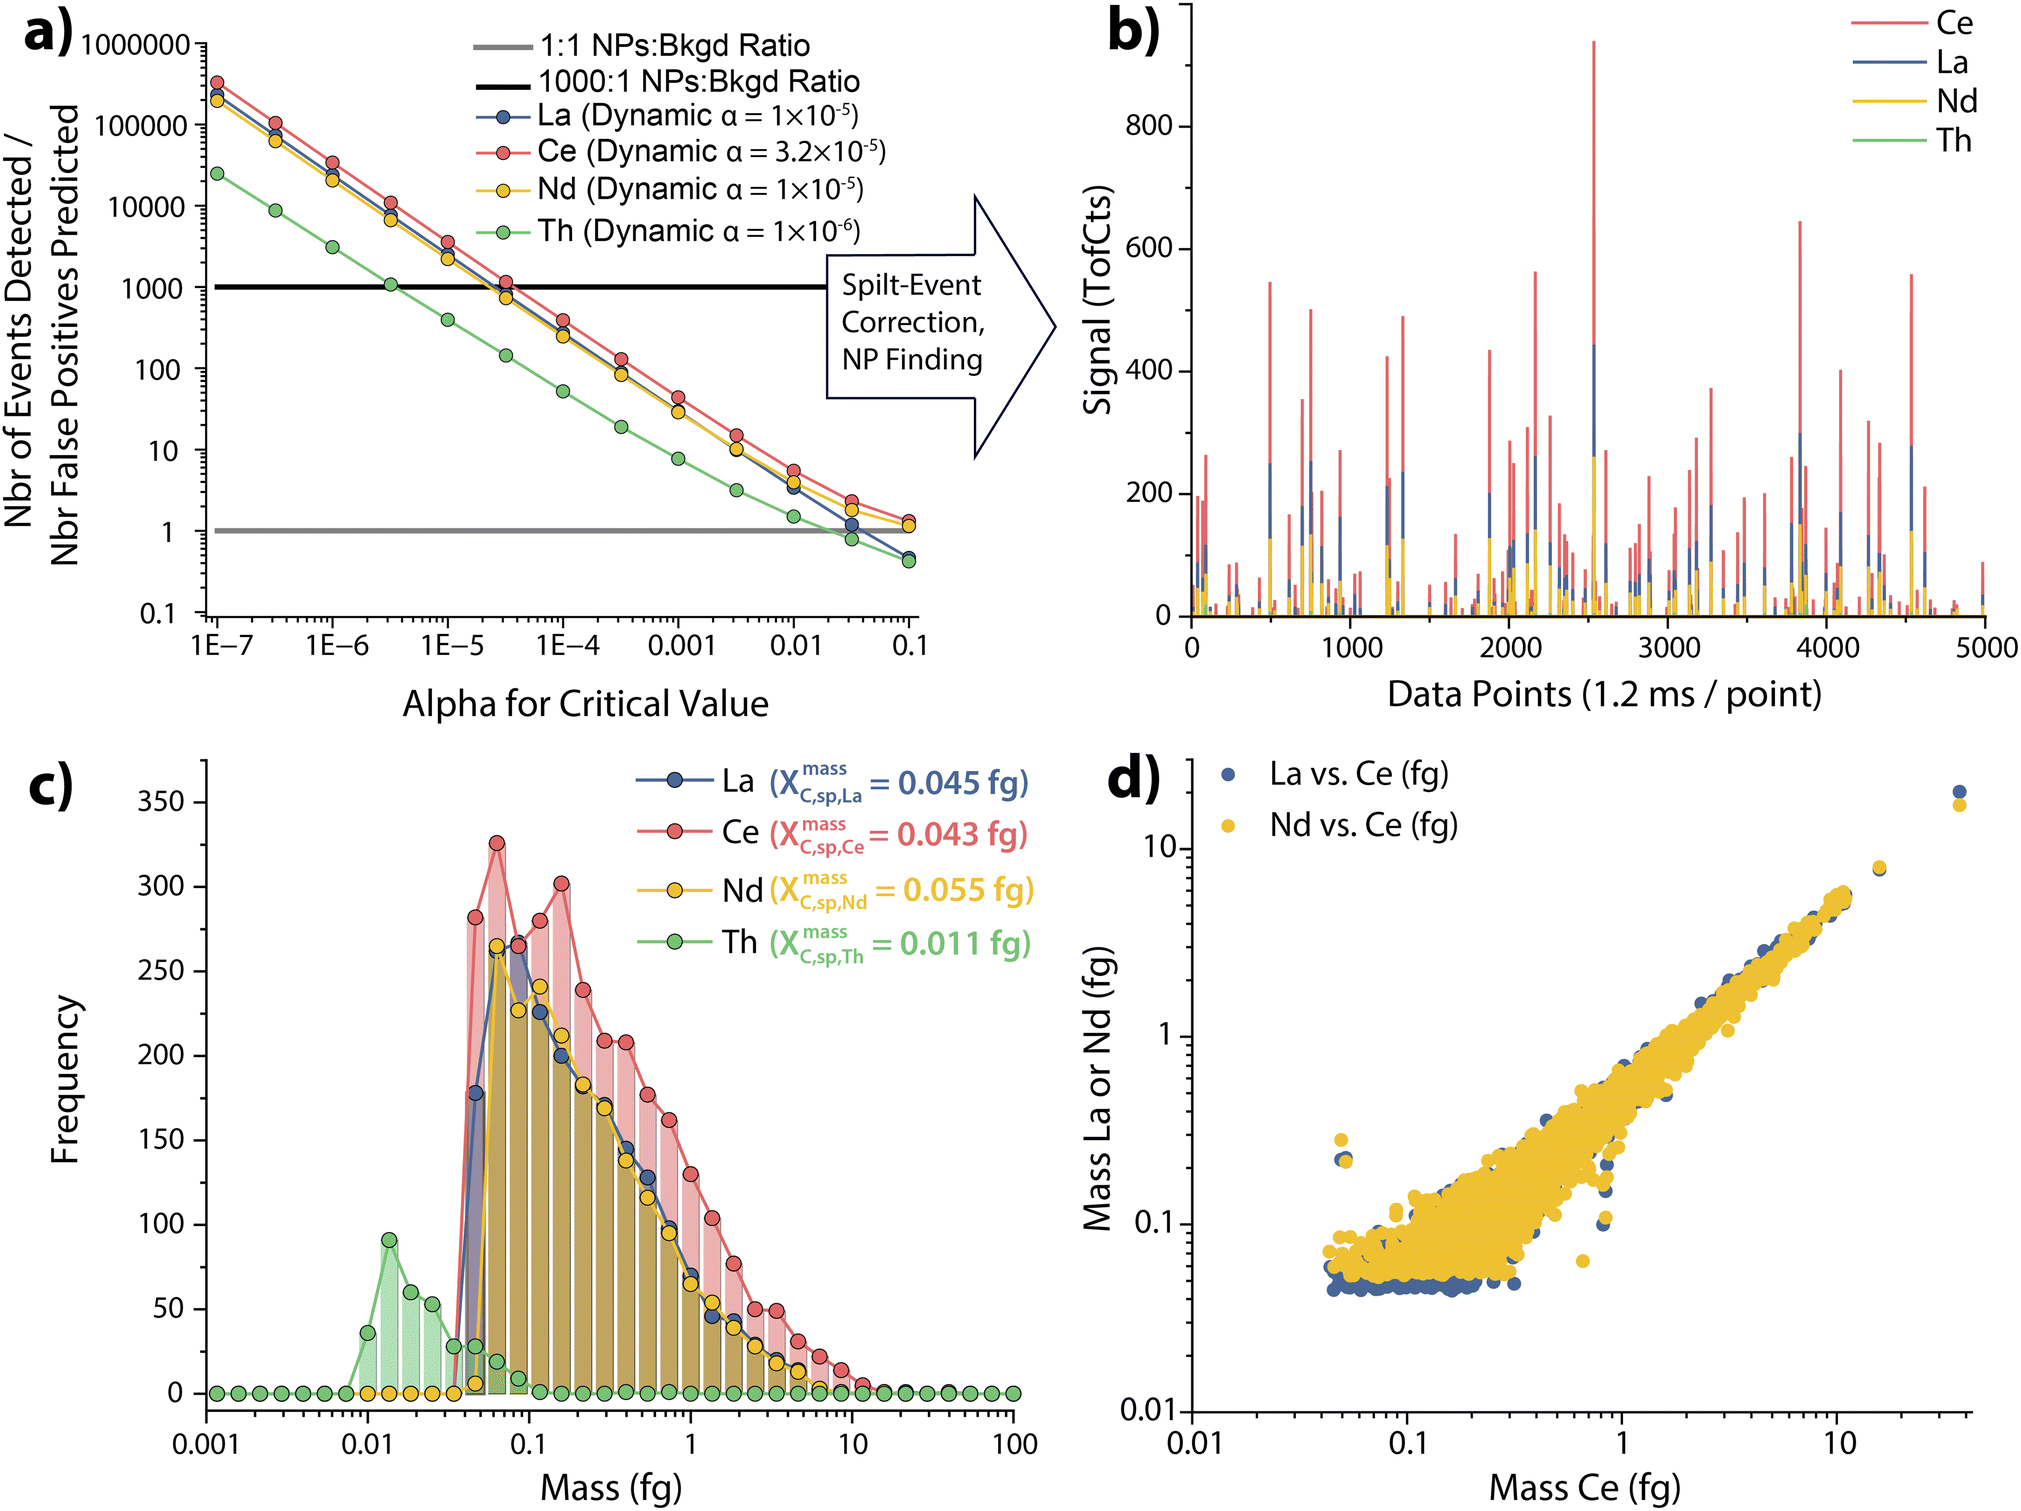 | ||
| Fig. 5 (a) In step 3 of TOF-SPI, analyte-specific alpha values are determined by comparing the number of measured signals above LC to that predicted by each alpha. The dynamic alpha for LC,sp is chosen when the NPs:Bkgd ratio (y-axis) is greater than a user defined value (e.g. 1000:1). (b) A small region (5000 data points, 6 seconds) of the found background-subtracted and split-event corrected particle signals. (c) Distributions of element mass amounts per found particle, as generated with TOF-SPI. (d) Example of mass correlation of La:Ce and Nd:Ce in the bastnaesite NPs. | ||
In Fig. 5b, detected particle events are shown for a narrow span of the spICP-TOFMS time trace; these found particle-derived events are split-event corrected as previously reported31 and described in the TOF-SPI user manual. In Fig. 5c, we report the detected mass distributions of analyte elements measured in the bastnaesite particles. TOF-SPI calculates the mass amount of each element per particle by dividing the measured background-subtracted signal by its corresponding absolute sensitivity. Similarly, a critical mass (XmassC,sp,i) for an element can be calculated by dividing the critical value by the absolute sensitivity. The critical mass is the minimum detectable mass of an element in a particle and will vary with sensitivity and background signal level. In batch analysis mode, step 3 automatically incorporates sample-specific background counts, absolute sensitivities, qplasma values, and adjusts LC,sp,i values to provide robust sample-specific particle detection and quantification. In Fig. 5d, we provide the mass correlations of La:Ce and Nd:Ce in the bastnaesite NPs; La and Nd are known to be highly correlated with Ce in bastnaesite particles. The preserved strong correlation found in the TOF-SPI-processed data highlights the accuracy of this spICP-TOFMS data analysis approach.
In step 3, the user is provided with several report/export options for the processed spICP-TOFMS data. These report types, along with a brief description, are provided in Table 2; more detailed descriptions of these outputs are provided in the user manual. The reports and data export options are generated with unique names for each spICP-TOFMS HDF5 file processed and are saved in the same file location as the original data. The exported data are formatted to be compatible with further spICP-TOFMS data processing steps and provide a consistent data structure for processed spICP-TOFMS data.
| Report name | File type | Description |
|---|---|---|
| spWorkup | .xlsx | • Comprehensive report |
| • TOF-SPI meta data (qplasma, isotopes used, LC,sp values, absolute sensitivities, critical masses, average λbkgd values, dynamic alphas, etc.) | ||
| • Signal intensities per particle | ||
| • Element mass(es) per particle | ||
| • Average element mass per particle | ||
| • Particle number concentrations (PNCs) | ||
| ElementMasses | .csv | • Index and timestamp of each found particle |
| • Mass (g) of each element in each particle (if element signal is below LC,sp, then a mass of 0 is reported) | ||
| • Only elements with measured absolute sensitivities are reported | ||
| • Matches output format from TofPilot | ||
| ParticleIntensities | .csv | • Index and timestamp of each found particle |
| • Background subtracted signal intensity of each analyte element in each particle (if element signal is below LC,sp, then a mass of 0 is reported) | ||
| • Matches output format from TofPilot | ||
| NPSignalsForML | .csv | • Header with TOF-SPI quant parameters for each analyte element (LC, sensitivity, λbkgd, dynamic alpha, etc.) |
| • Particle composition (elements detected) of each particle | ||
| • Background subtracted signal intensity of each analyte element per particle (intensity = 0 if signal below LC,sp) |
Conclusions
This technical note accompanies the release of TOF-SPI. TOF-SPI provides a high-throughput and well tested approach for the batch analysis of spICP-TOFMS data. Here, we used example data to illustrate the use of TOF-SPI to analyze spICP-TOFMS of mineral nanoparticles; however, the same software could also serve for the analysis of single cells32 or microparticles33,34 by ICP-TOFMS. Currently, TOF-SPI is coded for use with icpTOF instruments; however, future adaptations that incorporate spICP-TOFMS data from other instruments17 would expand its scope. As spICP-TOFMS analysis continues to expand, the field will benefit from standard data evaluation and reporting practices. This will allow peers to better collaborate and assess each other's work. With this in mind, we suggest that data reporting formats from TOF-SPI could serve as a basis on which a standard data format for spICP-TOFMS results is created.Conflicts of interest
There are no conflicts to declare.Acknowledgements
A. G.-G. would like to thank his research group for the team effort in developing, testing, and describing TOF-SPI. A. G.-G. also thanks Dr Kamyar Mehrabi who was key in developing several data analysis strategies incorporated into TOF-SPI. The authors thank Dr Lyndsey Hendriks and Dr Fred Oestland from TOFWERK for discussions and implementation of mass-dependent SIS acquisitions in the TofPilot instrument control software. We also acknowledge funding from Iowa State University (ISU) through a Faculty Start-up Grant and NSF CAREER grant CHE-2237291.References
- A. Gundlach-Graham, in Analysis and Characterisation of Metal-Based Nanomaterials, Elsevier, 2021, pp. 69–101, DOI:10.1016/bs.coac.2021.01.008.
- L. Hendriks, A. Gundlach-Graham, B. Hattendorf and D. Günther, Characterization of a new ICP-TOFMS instrument with continuous and discrete introduction of solutions, J. Anal. At. Spectrom., 2017, 32, 548–561 RSC.
- M. D. Montaño, F. von der Kammer, C. W. Cuss and J. F. Ranville, Opportunities for examining the natural nanogeochemical environment using recent advances in nanoparticle analysis, J. Anal. At. Spectrom., 2019, 34, 1768–1772 RSC.
- A. Gondikas, F. von der Kammer, R. Kaegi, O. Borovinskaya, E. Neubauer, J. Navratilova, A. Praetorius, G. Cornelis and T. Hofmann, Where is the nano? Analytical approaches for the detection and quantification of TiO2 engineered nanoparticles in surface waters, Environ. Sci.: Nano, 2018, 5, 313–326 RSC.
- T. Erhardt, C. M. Jensen, O. Borovinskaya and H. Fischer, Single Particle Characterization and Total Elemental Concentration Measurements in Polar Ice Using Continuous Flow Analysis-Inductively Coupled Plasma Time-of-Flight Mass Spectrometry, Environ. Sci. Technol., 2019, 53, 13275–13283 CrossRef PubMed.
- S. Bevers, M. D. Montaño, L. Rybicki, T. Hofmann, F. von der Kammer and J. F. Ranville, Quantification and Characterization of Nanoparticulate Zinc in an Urban Watershed, Front. Environ. Sci., 2020, 8, 84 CrossRef.
- A. Azimzada, J. M. Farner, I. Jreije, M. Hadioui, C. Liu-Kang, N. Tufenkji, P. Shaw and K. J. Wilkinson, Single- and Multi-Element Quantification and Characterization of TiO2 Nanoparticles Released From Outdoor Stains and Paints, Front. Environ. Sci., 2020, 8, 91 CrossRef.
- A. Praetorius, A. Gundlach-Graham, E. Goldberg, W. Fabienke, J. Navratilova, A. Gondikas, R. Kaegi, D. Günther, T. Hofmann and F. von der Kammer, Single-particle multi-element fingerprinting (spMEF) using inductively-coupled plasma time-of-flight mass spectrometry (ICP-TOFMS) to identify engineered nanoparticles against the elevated natural background in soils, Environ. Sci.: Nano, 2017, 4, 307–314 RSC.
- T. R. Holbrook, D. Gallot-Duval, T. Reemtsma and S. Wagner, Machine learning: our future spotlight into single-particle ICP-ToF-MS analysis, J. Anal. At. Spectrom., 2021, 36(12), 2684–2694 RSC.
- K. Mehrabi, R. Kaegi, D. Günther and A. Gundlach-Graham, Emerging investigator series: automated single-nanoparticle quantification and classification: a holistic study of particles into and out of wastewater treatment plants in Switzerland, Environ. Sci.: Nano, 2021, 8, 1211–1225 RSC.
- G. D. Bland, M. Battifarano, Q. Liu, X. Yang, D. Lu, G. Jiang and G. V. Lowry, Single-Particle Metal Fingerprint Analysis and Machine Learning Pipeline for Source Apportionment of Metal-Containing Fine Particles in Air, Environ. Sci. Technol. Lett., 2022, 10(11), 1023–1029 CrossRef.
- G. D. Bland, M. Battifarano, A. E. Pradas del Real, G. Sarret and G. V. Lowry, Distinguishing Engineered TiO2 Nanomaterials from Natural Ti Nanomaterials in Soil Using spICP-TOFMS and Machine Learning, Environ. Sci. Technol., 2022, 56, 2990–3001 CrossRef CAS PubMed.
- S. E. Szakas, R. Lancaster, R. Kaegi and A. Gundlach-Graham, Quantification and classification of engineered, incidental, and natural cerium-containing particles by spICP-TOFMS, Environ. Sci.: Nano, 2022, 9, 1627–1638 RSC.
- R. L. Buckman and A. Gundlach-Graham, Machine learning analysis to classify nanoparticles from noisy spICP-TOFMS data, J. Anal. At. Spectrom., 2023, 38, 1244–1252 RSC.
- H. Karkee and A. Gundlach-Graham, Characterization and Quantification of Natural and Anthropogenic Titanium-Containing Particles Using Single-Particle ICP-TOFMS, Environ. Sci. Technol., 2023, 57, 14058–14070 CrossRef CAS PubMed.
- L. Hendriks, R. Bruenjes, S. Taskula, J. Kocic, B. Hattendorf, G. Bland, G. Lowry, E. Bolea-Fernandez, F. Vanhaecke, J. Wang, M. Baalousha, M. von der Au, B. Meermann, T. R. Holbrook, S. Wagner, S. Harycki, A. Gundlach-Graham and F. von der Kammer, Results of an interlaboratory comparison for characterization of Platinum nanoparticles using single-particle ICP-TOFMS, Nanoscale, 2023, 15(26), 11268–11279 RSC.
- R. Gonzalez de Vega, T. E. Lockwood, L. Paton, L. Schlatt and D. Clases, Non-target analysis and characterisation of nanoparticles in spirits via single particle ICP-ToF-MS, J. Anal. At. Spectrom., 2023, 38(12), 2656–2663 RSC.
- H. E. Pace, N. J. Rogers, C. Jarolimek, V. A. Coleman, C. P. Higgins and J. F. Ranville, Determining Transport Efficiency for the Purpose of Counting and Sizing Nanoparticles via Single Particle Inductively Coupled Plasma Mass Spectrometry, Anal. Chem., 2011, 83, 9361–9369 CrossRef CAS PubMed.
- K. Mehrabi, D. Günther and A. Gundlach-Graham, Single-particle ICP-TOFMS with online microdroplet calibration for the simultaneous quantification of diverse nanoparticles in complex matrices, Environ. Sci.: Nano, 2019, 6, 3349–3358 RSC.
- S. Harycki and A. Gundlach-Graham, Online microdroplet calibration for accurate nanoparticle quantification in organic matrices, Anal. Bioanal. Chem., 2022, 414, 7543–7551 CrossRef CAS PubMed.
- D. Rosenkranz, F. L. Kriegel, E. Mavrakis, S. A. Pergantis, P. Reichardt, J. Tentschert, N. Jakubowski, P. Laux, U. Panne and A. Luch, Improved validation for single particle ICP-MS analysis using a pneumatic nebulizer/microdroplet generator sample introduction system for multi-mode nanoparticle determination, Anal. Chim. Acta, 2020, 1099, 16–25 CrossRef CAS PubMed.
- B. Ramkorun-Schmidt, S. A. Pergantis, D. Esteban-Fernández, N. Jakubowski and D. Günther, Investigation of a Combined Microdroplet Generator and Pneumatic Nebulization System for Quantitative Determination of Metal-Containing Nanoparticles Using ICPMS, Anal. Chem., 2015, 87, 8687–8694 CrossRef CAS PubMed.
- L. Hendriks, B. Ramkorun-Schmidt, A. Gundlach-Graham, J. Koch, R. N. Grass, N. Jakubowski and D. Günther, Single-particle ICP-MS with online microdroplet calibration: toward matrix independent nanoparticle sizing, J. Anal. At. Spectrom., 2019, 34, 716–728 RSC.
- L. A. Currie, Limits for qualitative detection and quantitative determination. Application to radiochemistry, Anal. Chem., 1968, 40, 586–593 CrossRef CAS.
- A. Gundlach-Graham, L. Hendriks, K. Mehrabi and D. Günther, Monte Carlo Simulation of Low-Count Signals in Time-of-Flight Mass Spectrometry and its Application to Single-Particle Detection, Anal. Chem., 2018, 90, 11847–11855 CrossRef CAS PubMed.
- L. Hendriks, A. Gundlach-Graham and D. Günther, Performance of sp-ICP-TOFMS with signal distributions fitted to a compound Poisson model, J. Anal. At. Spectrom., 2019, 34, 1900–1909 RSC.
- A. Gundlach-Graham and R. Lancaster, Mass-Dependent Critical Value Expressions for Particle Finding in Single-Particle ICP-TOFMS, Anal. Chem., 2023, 95, 5618–5626 CrossRef CAS PubMed.
- F. Laborda, A. C. Gimenez-Ingalaturre, E. Bolea and J. R. Castillo, About detectability and limits of detection in single particle inductively coupled plasma mass spectrometry, Spectrochim. Acta, Part B, 2020, 169, 105883 CrossRef CAS.
- F. Laborda, A. C. Gimenez-Ingalaturre, E. Bolea and J. R. Castillo, Single particle inductively coupled plasma mass spectrometry as screening tool for detection of particles, Spectrochim. Acta, Part B, 2019, 159, 105654 CrossRef CAS.
- M. Elinkmann, S. Reuter, M. Holtkamp, S. Heuckeroth, A. Köhrer, K. Kronenberg, M. Sperling, O. Rubner, C. D. Quarles, M. Hippler and U. Karst, Improving detection thresholds and robust event filtering in single-particle and single-cell ICP-MS analysis, J. Anal. At. Spectrom., 2023, 38(12), 2607–2618 RSC.
- A. Gundlach-Graham and K. Mehrabi, Monodisperse microdroplets: a tool that advances single-particle ICP-MS measurements, J. Anal. At. Spectrom., 2020, 35, 1727–1739 RSC.
- M. von der Au, O. Borovinskaya, L. Flamigni, K. Kuhlmeier, C. Büchel and B. Meermann, Single cell-inductively coupled plasma-time of flight-mass spectrometry approach for ecotoxicological testing, Algal Res., 2020, 49, 101964 CrossRef.
- S. Harycki and A. Gundlach-Graham, Single-Particle ICP-TOFMS with Online Microdroplet Calibration: A Versatile Approach for Accurate Quantification of Nanoparticles, Submicron Particles, and Microplastics in Seawater, Anal. Chem., 2023, 95, 15318–15324 CrossRef CAS PubMed.
- L. Hendriks and D. M. Mitrano, Direct Measurement of Microplastics by Carbon Detection via Single Particle ICP-TOFMS in Complex Aqueous Suspensions, Environ. Sci. Technol., 2023, 57(18), 7263–7272 CrossRef CAS PubMed.
Footnote |
| † Electronic supplementary information (ESI) available. See DOI: https://doi.org/10.1039/d3ja00421j |
| This journal is © The Royal Society of Chemistry 2024 |