 Open Access Article
Creative Commons Attribution 3.0 Unported Licence
From fossil to green chemicals: sustainable pathways and new carbon feedstocks for the global chemical industry†
Gabriel
Lopez
 *a,
Dominik
Keiner
a,
Mahdi
Fasihi
 a,
Tuomas
Koiranen
b and
Christian
Breyer
 a
a
aSchool of Energy Systems, LUT University, Yliopistonkatu 34, 53850 Lappeenranta, Finland. E-mail: Gabriel.Lopez@lut.fi
bSchool of Engineering Science, LUT University, Yliopistonkatu 34, 53850 Lappeenranta, Finland
First published on 18th May 2023
Abstract
Following current trends, the global chemical industry is set to become the largest consumer of fossil fuels. Among energy intensive industries, the chemical industry is one of the most challenging to defossilise due to the abundance of cheap fossil fuel-feedstocks and it is currently responsible for roughly 3% of global anthropogenic CO2 emissions. Unlike other energy-intensive industries, the chemical industry cannot be made fully sustainable directly with renewable electricity and green electricity-based hydrogen (e-hydrogen). Therefore, new green carbon feedstocks must be developed to defossilise the production of large volume organic chemicals. The most promising green carbon feedstocks are electricity-based methanol (e-methanol) and biomass-based methanol (bio-methanol), which can be used directly or as a feedstock for olefin and aromatic production. Increased recycling of plastics will reduce the amount of primary feedstock that will be required for chemical production. To investigate the energy and feedstock requirements for a global defossilisation of chemical production, scenarios are developed that reach net-zero emissions by 2040, 2050, and 2060 compared to business-as-usual conditions to 2100. High and low biomass feedstock variations are included to investigate the potential of biomass feedstocks in the future chemical industry, which are limited due to strict sustainability criteria. The results suggest that the chemical industry could become the largest e-hydrogen consumer, with a demand ranging from 16![[thin space (1/6-em)]](https://www.rsc.org/images/entities/char_2009.gif) 100 to 23
100 to 23![[thin space (1/6-em)]](https://www.rsc.org/images/entities/char_2009.gif) 100 TWhH2,LHV in 2050. High shares of electricity-based chemicals (e-chemicals) were found to provide the lowest annualised costs, suggesting that an e-chemical transition pathway may be the most economically competitive pathway to defossilise the global chemical industry.
100 TWhH2,LHV in 2050. High shares of electricity-based chemicals (e-chemicals) were found to provide the lowest annualised costs, suggesting that an e-chemical transition pathway may be the most economically competitive pathway to defossilise the global chemical industry.
Broader contextWhile the defossilisation of energy systems is well understood, the decoupling of fossil fuels from the chemical industry has often been overlooked, due to the abundance of cheap fossil feedstocks, which are used to produce plastics, fertilisers, pesticides, fibres, and personal care and consumer products, among other ubiquitous chemicals. The key challenge with the defossilisation of the chemical industry is the requirement of carbon-based feedstocks, which cannot be directly substituted with renewable electricity. Chemical demand is also expected to grow rapidly in the coming decades, and, without major disruption to feedstocks, could become the largest driver in oil consumption. Renewable electricity- and biomass-based feedstocks have been suggested to substitute fossil feedstocks; however, there is a knowledge gap in the energy system requirements to completely replace fossil feedstocks. This research presents scenarios for the complete defossilisation of global chemical feedstocks from 2020 to 2100 using a high geographical resolution of 145 regions. The results of this study found that the complete defossilisation of chemical production applying high levels of power-to-chemicals, in tandem with increased plastic recycling, will lead to the lowest annualised costs by 2050. |
1. Introduction
1.1. Current situation and technologies
Chemical products have become ubiquitous in modern society and are integral to the functioning of modern society. The demand for chemical products, especially plastics, has grown faster than that for any other bulk material.1 From 1950 to 2015, resins and fibres used in plastic production have grown at a compound annual growth rate (CAGR) of 8.4%, which has been estimated to be around 2.5 times higher than the CAGR of the global gross domestic product.2 Despite being the largest industrial energy consumer of both oil and gas, the chemical industry was only the third largest industrial emitter at 920 MtCO2 in 2019 resulting from primary chemical production alone, behind the cement, and iron and steel industries.3 This is largely due to the high shares of non-energy use of fossil fuels as feedstocks where high shares of the fossil carbon are embedded in the chemicals produced. Following current trends, demand for chemical products in the form of fertilisers, pesticides, plastics, and fibres, among others, is expected to increase significantly in the coming decades,1,2,4,5 and estimates suggest that, without intervention, non-combusted feedstocks will become the largest source of fossil fuel demand growth. The use of chemical products will additionally be essential to produce technologies that can eliminate emissions in the energy sector.6 Therefore, to meet the targets of the Paris Agreement7 and develop a carbon-neutral and sustainable chemical industry, a complete defossilisation of carbon feedstocks must occur.The foundations of the modern organic chemical industry are built on seven key building blocks or primary chemicals: ammonia (NH3), methanol (CH3OH or MeOH), ethylene (C2H4), propylene (C3H6), benzene (C6H6), toluene (C7H8), and mixed xylenes (C8H10). Ethylene and propylene are often discussed as light olefins, and benzene, toluene, and mixed xylenes are referred to as BTX aromatics, and together are referred to as high value chemicals (HVCs). Due to the abundance of low-cost fossil feedstocks, discussions of emission reductions in the chemical industry have largely focused on process emissions.1 However, many chemical processes have reached close to their highest feedstock efficiency; however, processes may be improved to reduce CO2 emissions.1,8 Today, primary chemical production has emission factors of 2.4 tCO2/tNH3, 2.3 tCO2/tMeOH, and 1.0 tCO2/tHVC,1 related to both the fossil feedstocks required and process heat and electricity.
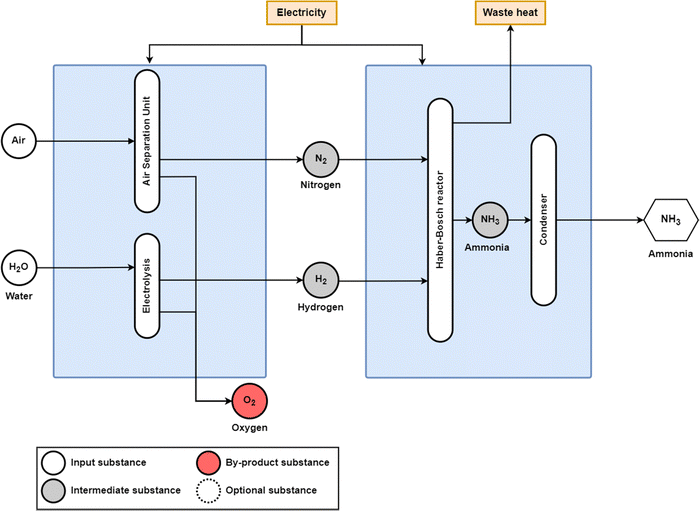
The conventional production of ammonia uses the Haber–Bosch process with fossil methane, coal, or oil as the feedstock, as shown in Fig. 1, and fossil methane has become the dominant feedstock globally, as it is responsible for 75% of global ammonia feedstocks, followed by coal at 22% and oil at 3%.8 With fossil feedstocks, this process is responsible for around 1.8% of global CO2 emissions.9 Ammonia production has grown exponentially since the development of the Haber–Bosch process in 1909, and its global production reached 195 MtNH3 in 2018.10 In addition to its use as a fertiliser, ammonia has been discussed as a form of seasonal storage to offset variable renewable energy (RE) and as a fuel for the transport sector, especially in marine applications.11–17 From both a feedstock perspective and an emission perspective, the fossil methane-to-ammonia route has the best performance, with a feedstock requirement of 28 GJCH4,LHV/tNH313,18 and an emission factor of 1.6 tCO2/tNH3.18 However, as highlighted by Smith et al.,11 only marginal efficiency improvements are available for conventional ammonia production.
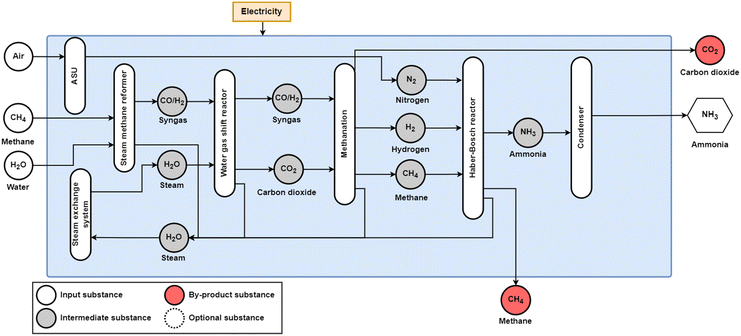 | ||
| Fig. 1 Conventional production route for ammonia production from natural gas and nitrogen from an air separation unit (ASU). Coal and oil can similarly be used as a fossil feedstock, using coal gasification and partial oxidation for syngas production, respectively. Before nitrogen and hydrogen are input to the Haber–Bosch reactor, an additional methanation step is required to convert carbon monoxide and carbon dioxide to methane that accumulates as inert in the NH3 synthesis stage, minimising the poisoning of the Haber–Bosch catalyst. The condenser after the Haber–Bosch reactor removes H2 and N2 impurities from the outlet stream. Adapted from Smith et al.11 | ||
Methanol production, as shown in Fig. 2, similarly converts syngas, a mixture of H2, CO, and CO2, from a fossil fuel feedstock to methanol19 using a Cu/ZnO/Al2O3 catalyst.20 Similar to the ammonia production process, steam methane reformation is used for fossil methane and naphtha feedstocks, whereas partial oxidation is used for heavy oils and solid fossil fuels. Fossil methane is the most used feedstock for methanol synthesis, corresponding to 57% of global methanol feedstocks,8 and has a feedstock demand of 33.9 GJCH4,LHV/tMeOH.21 Coal is the next most used feedstock at 40% of global methanol feedstocks consuming 46.9 GJCH4,LHV/tMeOH,21 largely due to the high shares of methanol production and consumption in China,19 and oil composes only 3% of global methanol feedstocks, for a total production of 95 MtMeOH in 2018.10 Additionally, CO2 emissions for the fossil-based methanol synthesis range from 0.5 tCO2eq/tMeOH for steam reforming to 1.5 tCO2eq/tMeOH for partial oxidation.22
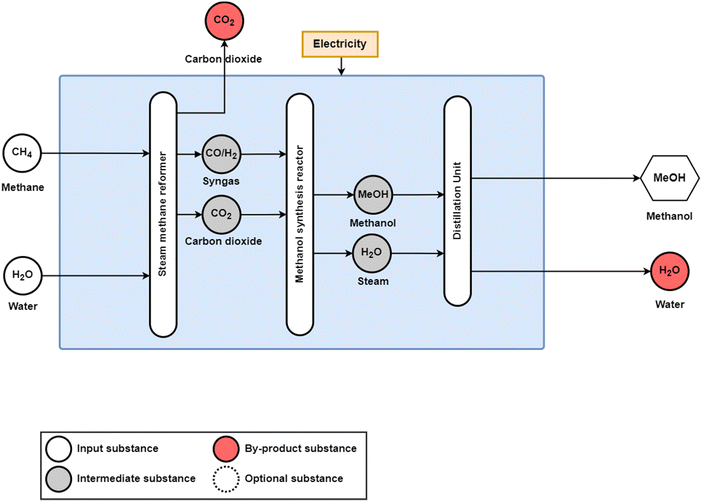 | ||
| Fig. 2 Conventional production process for methanol synthesis from natural gas over a CuO/ZnO/Al2O3 catalyst. Coal and oil can similarly be used as fossil feedstocks for coal gasification and partial oxidation for syngas production, respectively. Adapted from Adnan and Kibria.20 | ||
HVCs are very often co-produced in several chemical processes or produced as by-products from refineries. The most widely used process for the co-production of ethylene, propylene, and BTX aromatics is the steam cracker, and is shown in Fig. 3. While naphtha is used as the feedstock, there are a wide range of feedstocks that are used for steam crackers, which largely varies on what low-cost fossil feedstock is readily available regionally. In Europe and Eurasia, heavier oil feedstocks including naphtha and gas oil are used due to their availability compared to lighter natural gas liquid feedstocks such as ethane and propane being preferred in North America and the Middle East and North Africa (MENA) regions.10 The composition of the feedstock has a significant effect on the shares of products produced, and ethylene and propylene yields from various feedstocks and operating conditions can range from 24 to 55% and 1.5 to 18%, respectively.23 Along with propylene from steam cracking, propylene is also produced in large quantities via refinery operations through deep catalytic cracking (DCC) as well as via propane dehydrogenation, a form of on-purpose propylene (OPP).24 The global production of ethylene and propylene reached 160 and 107 Mt in 2018, respectively.10
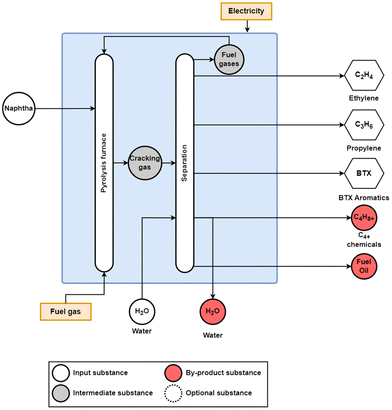 | ||
| Fig. 3 Conventional steam cracking process to produce ethylene, propylene, and BTX aromatics from naphtha. The pyrolysis furnace converts the feedstock, here, naphtha, into cracking gas, which is then sent to a series of separation units to separate the various hydrocarbon fractions and waste water. Additional feedstocks for the steam cracking process include ethane, propane, butane, and gas oil. Adapted from Xiang et al.25 | ||
For heavier steam cracker feedstocks and DCC, as shown in Fig. 4, BTX aromatics are produced in a pyrolysis gas (pygas) component.
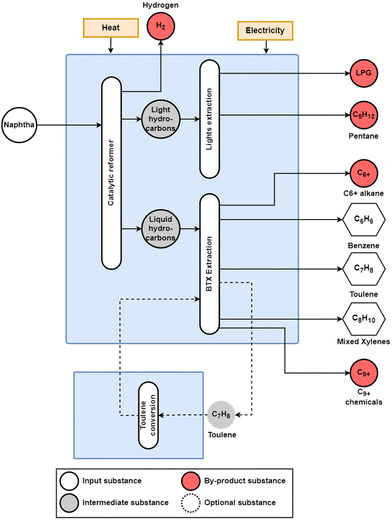 | ||
| Fig. 4 Conventional naphtha catalytic reforming (CRR) process. The main products from this process are the BTX aromatics, and the by-products include pentane, C6+ alkane, liquefied petroleum gas (LPG), and C9+ chemicals, with an optional toluene conversion route to increase benzene and xylene yields. Adapted from Jiang et al.26 | ||
However, the majority of the BTX aromatics are sourced via the catalytic reforming of naphtha (CRR) in refineries,1,8 shown in Fig. 5. Additionally, toluene can be converted to benzene or mixed xylenes through toluene hydrodealkylation (THD) and disproportionation (TDP), which has been used to reduce the overproduction of toluene relative to demand.10 In 2018, the global production of BTX aromatics reached 43, 22, and 54 Mt for benzene, toluene, and mixed xylenes (ortho/meta/para), respectively.10
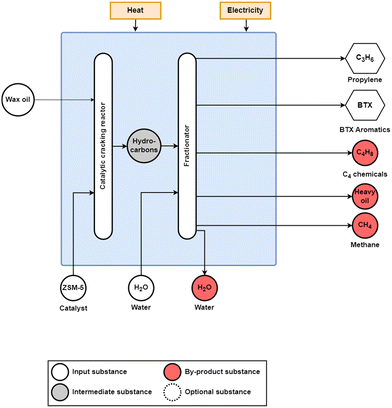 | ||
| Fig. 5 Deep catalytic cracking of refinery oil for propylene production from wax oil using a zeolite (ZSM-5) catalyst. In addition to the propylene and BTX products, C4 chemicals, heavy oil, and methane are also produced. Adapted from Zhao et al.24 and Gholami et al.27 | ||
Of the global chemical flows, roughly 61% of downstream chemicals considered in this study are used for plastic production, and comprise roughly 24% of all global chemical flows.8 Therefore, increasing plastic recycling has become a target of many industrialised economies that will reduce the primary chemical demand, particularly for HVCs.1 Global plastic collection rates for plastics have been increasing steadily since 1990, increasing from 2% to 15% in 2019.28 However, there is significant disparity between plastic recycling rates by regions, ranging from 8.2% in non-OECD other Africa to 25.2% in OECD Europe for 2019, as shown in Fig. 6.28
 | ||
| Fig. 6 Plastic collection and recycling rates by OECD regions in 2019.28 | ||
Additionally, the actual recycling rate of collected plastics is still rather low globally, ranging from 50% in the United States to 71% in non-OECD Latin America.28 Although plastic recycling rates have grown rather significantly, global secondary plastic production has not seen the same levels of growth, as secondary plastic production has only grown from 1.5% of total plastics in 1990 to 6.3% in 2019, as shown in Fig. 7.
 | ||
| Fig. 7 Global plastic production by type from 1990 to 2019 (left axis) and shares of secondary plastics of total plastic production (right axis).28 | ||
Unlike other energy-intensive materials, plastics tend to have short lifetimes, Table 1 shows the main uses of plastics, shares of plastics by use, and mean product lifetimes according to Geyer et al.,2 with many packaging plastics returning to waste streams in less than a year of manufacture.2 However, plastic waste mismanagement continues to be a global challenge, as most plastic waste is either discarded or incinerated. Without action, this issue may compound itself as Geyer et al.2 project that by 2050 humanity will have produced over 25![[thin space (1/6-em)]](https://www.rsc.org/images/entities/char_2009.gif) 000 million metric tons of plastic waste.
000 million metric tons of plastic waste.
| Plastic use type | Share of total | Mean use lifetime [years] |
|---|---|---|
| Packaging | 45% | 0.5 |
| Building and construction | 19% | 35 |
| Other | 13% | 5 |
| Consumer and institutional products | 12% | 3 |
| Transportation | 7% | 13 |
| Electrical/electronic | 4% | 8 |
| Industrial machinery | 1% | 20 |
1.2. Perspectives of the chemical industry transition
Research regarding a transition of the chemical industry to net-zero emissions has been increasingly gaining attention. Chung et al.29 reviewed decarbonisation options for the chemical industry, finding CCU and biomass as significant crosscutting options for the defossilisation of feedstocks as a means to couple the chemical industry with the larger energy-industry system. Material Economics30 develops net-zero emission pathways for Europe by 2050 for plastics and ammonia, finding for plastics that circular economy, recycling, and bioplastic production are key technologies to reach net-zero emissions without CCS, though they do not consider e-plastic routes with e-methanol as the platform chemical. For ammonia, new processes, i.e., electricity-based ammonia (e-ammonia), are essential for emissions reduction without CCS, as circular economy options are limited. Schneider and Saurat31 similarly developed a zero-emission pathway for the European plastic sector by 2050, finding significant roles of plastic recycling, MTO, MTA, and e-naphtha steam cracking to reach net-zero emissions. On a global scale, Kätelhön et al.32 investigated the potential for electricity-based methanol (e-methanol) and electricity-based hydrogen (e-hydrogen) to substitute fossil feedstocks by 2030, emphasising the role of defossilisation of global electricity supply to achieve net-zero emissions in the CCU-based chemical industry. The global net-zero emission chemical industry scenario developed by Saygin and Gielen4 still has fossil feedstocks around 25![[thin space (1/6-em)]](https://www.rsc.org/images/entities/char_2009.gif) 000 PJ (6940 TWh) in 2050, largely for the production of HVCs, and therefore requires 0.94 GtCO2/a of fossil CCS and 0.55 GtCO2/a of bioenergy with CCS (BECCS). Cost-optimal pathways for the global chemical industry without CCS were developed by Zibunas et al.,33 finding that the total energy consumption of the chemical industry ranges from 134 to 160 EJ (37
000 PJ (6940 TWh) in 2050, largely for the production of HVCs, and therefore requires 0.94 GtCO2/a of fossil CCS and 0.55 GtCO2/a of bioenergy with CCS (BECCS). Cost-optimal pathways for the global chemical industry without CCS were developed by Zibunas et al.,33 finding that the total energy consumption of the chemical industry ranges from 134 to 160 EJ (37![[thin space (1/6-em)]](https://www.rsc.org/images/entities/char_2009.gif) 200–44
200–44![[thin space (1/6-em)]](https://www.rsc.org/images/entities/char_2009.gif) 400 TWh), and that all primary energies for the global chemical industry can be provided from biomass, ranging from 0 to 65%, and electricity, ranging from 15 to 75% of all resource consumption. Huo et al.34 studied the net-zero transition of the global chemical industry, finding a global CO2 demand of 2.2–3.1 GtCO2, and a potential supply of 5.2–13.9 GtCO2 from the power, cement, steel, and pulp and paper sectors; however, this still assumes some fossil usage in power plants and steelmaking, which may not be available in a full defossilisation of the energy-industry system.
400 TWh), and that all primary energies for the global chemical industry can be provided from biomass, ranging from 0 to 65%, and electricity, ranging from 15 to 75% of all resource consumption. Huo et al.34 studied the net-zero transition of the global chemical industry, finding a global CO2 demand of 2.2–3.1 GtCO2, and a potential supply of 5.2–13.9 GtCO2 from the power, cement, steel, and pulp and paper sectors; however, this still assumes some fossil usage in power plants and steelmaking, which may not be available in a full defossilisation of the energy-industry system.
While there have been several studies demonstrating the feasibility of the chemical industry to achieve net-zero emissions at both regional and global scales, there are no studies, to the knowledge of the authors, providing long-term projections of chemical production to the end of the century considering high levels of sustainability. Net-zero transition scenarios for the global chemical industry by 2050 have been performed at a global level,33 and considering fossil CO2 supply from the power sector and the steel industry at a major region level;34 however, none have been performed at a high regional resolution providing techno-economic implications for the chemical industry transition in the context of a larger energy-industry defossilisation. Even the leading Integrated Assessment Model (IAM) scenarios, such as that developed by Luderer et al.,35 consider the continued usage of fossil fuels in the chemical industry despite reaching 97.8% RE share in electricity generation. The novelty of this research is therefore in developing the first global chemical and feedstock projections at a high geographical resolution to 2100 for business-as-usual and net-zero emission scenarios considering high and low biomass variations. Furthermore, this research is the first of its kind to evaluate the annualised and levelised costs of the global chemical industry based on green e-ammonia and green e-methanol by applying the levelised cost of electricity (LCOE) according to Bogdanov et al.36 and greenhouse gas (GHG) emission costs according to the 2021 IEA World Energy Outlook.37 This research on a high geographical resolution thus demonstrates specific regional pathways for sustainable feedstocks to enter the global chemical production landscape.
This study is organised as follows: Section 2 describes the methodology and data, Section 3 presents the results, Section 4 provides a discussion of the results, limitations of this study, and recommendations for future work, and Section 5 offers conclusions.
2. Methods and data
This section presents the data and methodology applied for developing scenarios for a defossilised chemical industry. Section 2.1 describes the data and methods applied for developing the chemical production model for the base year of 2020. Section 2.2 explains how future chemical demands were determined and distributed among 145 LUT regions. Section 2.3 then presents the scenarios that were considered in this research to achieve net-zero CO2 emissions in the chemical industry.2.1. Global chemical production landscape
Globally, around 20 chemicals are responsible for 75% of the chemical industry's GHG emissions.5 As a starting point, a bottom-up model was developed based on production data for the most downstream chemicals modelled according to Horton,10 which were then distributed regionally according to Keiner et al.38 The bottom-up chemical model developed considers the composition of each primary chemical based on its downstream derivatives according to eqn (2.1), using 2018 production quantities and shares from Horton.10 Shares of downstream chemical demands for each primary chemical are shown in Table S1 (ESI†). | (2.1) |
The final chemical demands were separated by their end use of plastics, non-plastics, and pesticides. Plastics as a share of each final chemical were determined according to shares reported by Levi and Cullen and are shown in Table S2 (ESI†). The shares of plastics for each final chemical were then used as a basis for determining available plastics for recycling and waste incineration. The amount of plastic chemicals was then determined according to eqn (2.2). Regional plastic collection and recycling rates were applied according to the OECD data and are shown by OECD regions for each NZE scenario in Tables S4–S7 (ESI†), with Table S3 (ESI†) showing the historical CAGR of recycling collection rates by major regions from 1990 to 2019. Similarly, regional plastic incineration growth rates are shown in Table S8 (ESI†), and regional growth rates by scenarios are shown in Tables S9–S12 (ESI†). Collection-to-recycling rates were varied linearly from their regional values in 2019 to reach 100% by the net-zero year for the NZE scenarios, and by the CAGR from 2000 to 2019 under business-as-usual conditions.
 | (2.2) |
These downstream chemicals, along with chlorine, were then allocated categories based on their chemical structure and end-use, primarily to identify which chemicals are used as plastics. The mass balances of the ecoinvent 3.0 database39 were used to determine the primary chemical demand of the downstream chemicals modelled, which then require primary energy feedstocks. Additionally, secondary plastic production was modelled as 6.3% of the total thermoplastics considered in this study. Considering that feedstocks for HVC production varies significantly by region, feedstocks for HVC production, primarily those for steam crackers, were distributed by major global region for Europe, Eurasia, Middle East and North Africa (MENA), sub-Saharan Africa (SSA), the Southeast Asian Association for Regional Cooperation (SAARC), Northeast Asia, Southeast Asia, North America, and South America on a 145 LUT region-basis as used in Bogdanov et al.36
The regional distribution of feedstocks for HVC production is shown in Table 2 for ethylene and Table 3 for propylene. Steam crackers additionally have a pygas component that contains BTX aromatics, among other aromatic chemicals, and BTX shares in pygas were applied according to Levi and Cullen,8 and are shown in Table S13 (ESI†). While significant quantities of propylene and BTX aromatics are supplied by steam crackers, especially those with heavier feedstocks, this supply is not enough to meet global demand. Therefore, refinery oil and propane are used as feedstocks for propylene production through deep catalytic cracking and propane dehydrogenation, respectively. Additionally, catalytic reforming of naphtha is used to satisfy the remaining BTX aromatic demand, with p-xylene being the chemical most supplied from refinery naphtha.8 The result is that there is often a mismatch between supply and demand of BTX aromatics, especially toluene, though this can be somewhat mitigated by converting toluene to benzene and xylenes through toluene disproportionation and toluene hydrodealkylation.8,10 For ammonia and methanol production, regional feedstock data were not available; therefore, global feedstock shares for these chemicals were applied according to Levi and Cullen,8 as shown in Fig. 8.
| Ethane | Propane | Butane | Naphtha | Gas oil | Othera | |
|---|---|---|---|---|---|---|
| a The other feedstock assumed to be naphtha. | ||||||
| Europe | 11% | 8% | 8% | 66% | 7% | 0% |
| Eurasia | 8% | 5% | 5% | 67% | 15% | 0% |
| MENA | 63% | 24% | 5% | 8% | 0% | 0% |
| Sub-Saharan Africa | 25% | 25% | 0% | 0% | 0% | 50% |
| SAARC | 6% | 3% | 2% | 77% | 10% | 3% |
| Northeast Asia | 6% | 3% | 2% | 77% | 10% | 3% |
| Southeast Asia | 6% | 3% | 2% | 77% | 10% | 3% |
| North America | 44% | 19% | 13% | 19% | 3% | 1% |
| South America | 26% | 10% | 0% | 58% | 6% | 0% |
| Steam crackers | Deep catalytic cracking | Propane dehydrogenation | |
|---|---|---|---|
| Europe | 26% | 25% | 7% |
| Eurasia | 26% | 25% | 7% |
| MENA | 30% | 26% | 44% |
| Sub-Saharan Africa | 30% | 26% | 44% |
| SAARC | 44% | 25% | 31% |
| Northeast Asia | 44% | 25% | 31% |
| Southeast Asia | 44% | 25% | 31% |
| North America | 33% | 54% | 13% |
| South America | 42% | 58% | 0% |
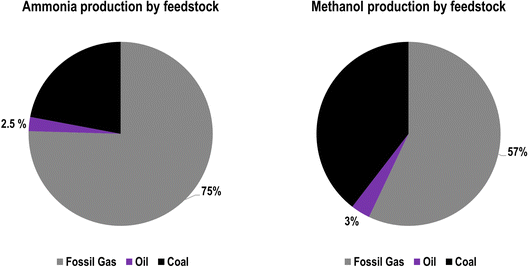 | ||
| Fig. 8 Ammonia (left) and methanol (right) production by feedstock in 2013 according to Levi and Cullen.8 | ||
The global flow of these chemicals along with chlorine, as shown in Fig. 9, traces the fossil feedstocks to primary and then downstream chemicals that are then used for fertilisers, pesticides, plastics, resins, and fibres. The results of the bottom-up model for 2020 find that the production of primary chemicals required a total energy and feedstock input of 11![[thin space (1/6-em)]](https://www.rsc.org/images/entities/char_2009.gif) 029 TWhth. The total fossil feedstock was then compared to the 2020 results provided by the IEA40 and DNV41 to verify the accuracy of the model with the collected data. According to the 2019 IEA energy statistics,40 the most recent year of data available, the total non-energy use was reported at 38.7 PJ, or 10
029 TWhth. The total fossil feedstock was then compared to the 2020 results provided by the IEA40 and DNV41 to verify the accuracy of the model with the collected data. According to the 2019 IEA energy statistics,40 the most recent year of data available, the total non-energy use was reported at 38.7 PJ, or 10![[thin space (1/6-em)]](https://www.rsc.org/images/entities/char_2009.gif) 750 TWhth, a 2.6% difference with the calculated number. When compared to 2020 number published in DNV's 2022 energy transition outlook41 of 40 EJ, or 11
750 TWhth, a 2.6% difference with the calculated number. When compared to 2020 number published in DNV's 2022 energy transition outlook41 of 40 EJ, or 11![[thin space (1/6-em)]](https://www.rsc.org/images/entities/char_2009.gif) 111 TWhth, this study's model results find a -0.7% difference, thus verifying the model functionality for the starting year of 2020. Regionally, China has the largest share of the fossil feedstock demand, as well as Saudi Arabia, Korea, and Belgium and the Netherlands (BNL), and several regions in the United States. The regional fossil feedstock demand is shown in Fig. 10.
111 TWhth, this study's model results find a -0.7% difference, thus verifying the model functionality for the starting year of 2020. Regionally, China has the largest share of the fossil feedstock demand, as well as Saudi Arabia, Korea, and Belgium and the Netherlands (BNL), and several regions in the United States. The regional fossil feedstock demand is shown in Fig. 10.
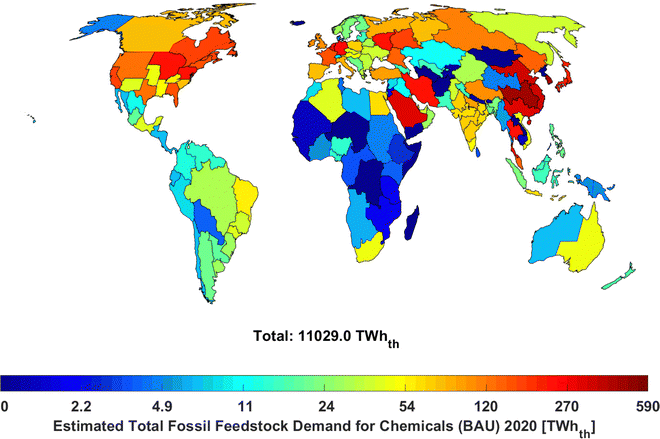 | ||
| Fig. 10 Total fossil feedstocks for chemicals by region in 2020. Chemical demands that were met with the fossil feedstock supply based on numbers from Horton.10 The regional structure adopted as used by Bogdanov et al.36 | ||
2.2. Future alternatives
For many energy sectors, such as power, heat, and transport, the discussion on reaching carbon neutrality is often centred around the concept of ‘decarbonisation’; however, for the chemical industry, ‘decarbonisation’ is impossible due to the requirement of carbon feedstocks to produce all large volume organic chemicals.42 Therefore, the development of a net-zero emissions or even negative emissions chemical industry must centre around the concept of ‘defossilisation’, which requires the introduction of new sustainable carbon feedstocks through sustainable biomass and carbon capture and utilisation (CCU).4,32,43–45 The most discussed sustainable feedstock for the global chemical industry has been e-methanol and biomass-based methanol (bio-methanol),46 which can either be used directly or as a feedstock for olefins and aromatics through the methanol-to-olefins (MTO) and methanol-to-aromatics (MTA) processes. Indeed, methanol has been discussed as a substitute for oil-based feedstocks and fuels as early as the 1980s, though fossil methane was suggested as the major feedstock.47 Both methanol and ammonia can be synthesised through green e-hydrogen and biomass, and e-methanol and bio-methanol as the central feedstocks would lead to a methanol economy48 basis for the current petrochemical industry. In this study, electrolysis based organic syntheses49–53 are not included in this study due to the early stage technology development and low technology readiness levels (TRL 3–5).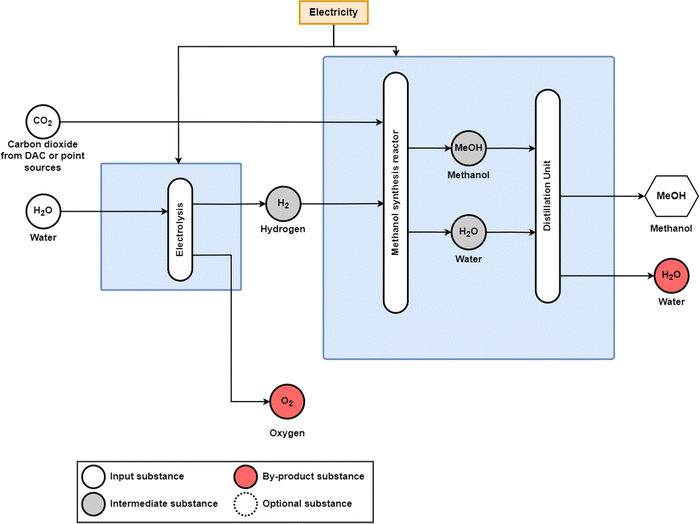 | ||
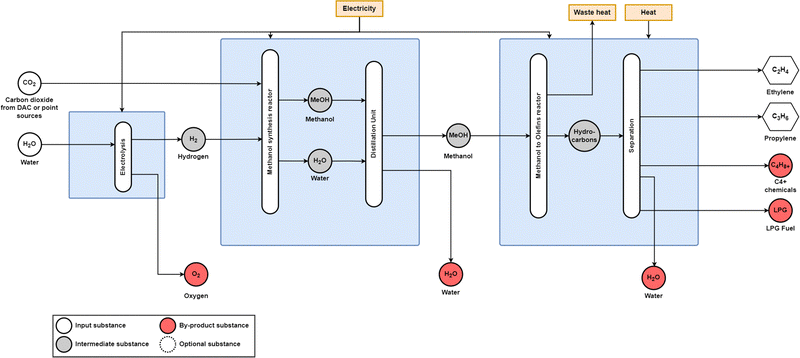
| Fig. 12 Power-to-methanol process diagram with e-hydrogen supplied by water electrolysis and CO2 being supplied by direct air capture (DAC) or industrial point sources. In this study, CO2 from DAC is assumed. The catalyst for the methanol synthesis reactor is CuO/ZnO/Al2O3. Adapted from Adnan and Kibria20 and Bos et al.64 | ||
In this research, a carbon dioxide demand of 1.46 tCO2/tMeOH is considered to be supplied by a direct air capture (DAC) unit;19,60,61 however, carbon dioxide can also be supplied from process emissions from the cement mills, pulp and paper mills, or waste incinerators burning biomass or municipal solid waste.62 Techno-economic assessments of the power-to-methanol route have been investigated for a range of carbon inputs including CO2 from a biogas treatment plant and a fossil ammonia plant,63 DAC,60,64 carbon recycling,65,66 and other point sources.67–69 Research has also investigated sourcing carbon dioxide from lignite power plants;70 however, this would not be a fully sustainable solution given the use of coal as an input for electricity generation and leakage emissions, as point source carbon capture from coal power plants is typically designed around a 90% CO2 efficiency.71 Additionally, the fossil carbon embedded in the methanol could return to air or water as CO2 or other GHG emissions at the end of its life cycle.
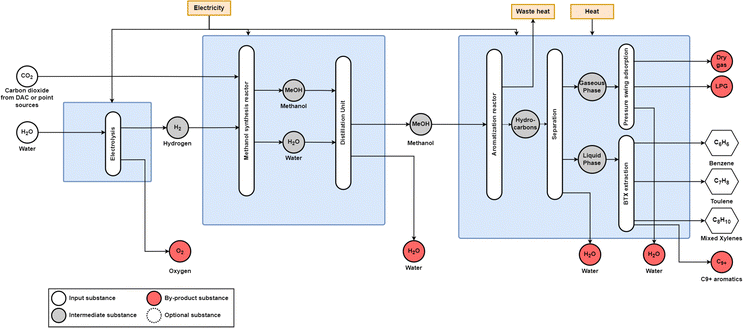 | ||
| Fig. 14 Power-to-methanol-to-aromatic process diagram. Methanol synthesis occurs over a CuOZnO/Al2O3 catalyst, and methanol aromatisation occurs over a HZSM-5 catalyst. Adapted from Jiang et al.26 | ||
Biochemical routes have also been widely suggested to substitute fossil feedstocks for ammonia,80–82 methanol,65,83–85 olefins,24,86–88 and aromatics,89–91 as part of a larger bioeconomy.92 While biochemical routes are available, increased scrutiny must be placed on the sourcing of the biomass feedstocks. Today, bioethylene is produced in Brazil via bioethanol dehydration using sugarcane as the biomass feedstock for ethanol production.93 However, as biomass resources become increasingly limited, strict sustainability requirements must be placed on biomass resource use, as biomass competes both with food and feed supply and bioenergy in other energy sectors such as biofuels for transport. Globally, the sustainable bioenergy limit has been estimated to be 100 EJ/a94 (27![[thin space (1/6-em)]](https://www.rsc.org/images/entities/char_2009.gif) 800 TWh). Sustainable biomass use effectively eliminates first-generation biomass from being used for chemical production, and, therefore, only biomass residues and wastes, e.g., lignocellulosic biomass, should be considered for biochemical production.
800 TWh). Sustainable biomass use effectively eliminates first-generation biomass from being used for chemical production, and, therefore, only biomass residues and wastes, e.g., lignocellulosic biomass, should be considered for biochemical production.
2.3. Future primary chemical production and plastic waste management
To determine future chemical demands, individual CAGRs were attributed to each downstream chemical, derived from the IEA5 and Kätelhön et al.32 These CAGRs were then scaled according to the gross domestic product (GDP) per capita chemical demand model, based on the LUT-EEES macro-economic scenario of Keiner et al.38 from 2020 to 2100 in 10 years intervals and distributed among the 145 LUT regions. Using the shares of chemicals-to-plastics as established in Section 2.1, historical plastic production data from the OECD,28 and plastic lifetime distributions from Geyer et al.2 (Table 1), the available plastic waste in a given year was determined. Plastics were then separated by collection for recycling and waste incineration. The collection-to-recycling rate was linearly varied from today's levels by major region to 100% by the net-zero emission year. Mechanical recycling was assumed to substitute primary plastic chemicals with secondary plastics at a carbon efficiency of 98% and electricity consumption of 0.234 MWhel/tplastic,out.95 Fossil chemicals-to-plastics that are incinerated result in positive GHG emissions, corresponding to the carbon content of chemicals used for plastic production.39The total plastic production and plastics by application are shown in Fig. 15. For all non-plastic chemicals, only primary production methods were applied, due to the lack of relevant recycling options. Additionally, the carbon content of non-plastic fossil chemicals is included in the GHG emissions reporting in their respective production years as CO2eq emissions. In the net-zero emissions chemical industry scenarios defined in Section 2.5, the maximum plastic recycling rates were set to 60% in the net-zero emission year, evolving from today's regional recycling rates, as shown in Fig. 6. While plastic recycling rates could in theory be higher, especially with chemical, or back-to-monomer, recycling, this recycling target is in line with similar research, e.g., Saygin and Gielen,4 who establish a 66% plastic recycling target by 2050. Chemical recycling, which can reduce plastics either to monomers, feedstock oils, or even CO/H2 syngas, may provide alternative recycling routes for plastics that might be challenging to recycle mechanically,96 though it is not applied in this analysis. The physical parameters for each chemical production route are presented in Table S19 (ESI†), due to the high number of processes considered in this study.
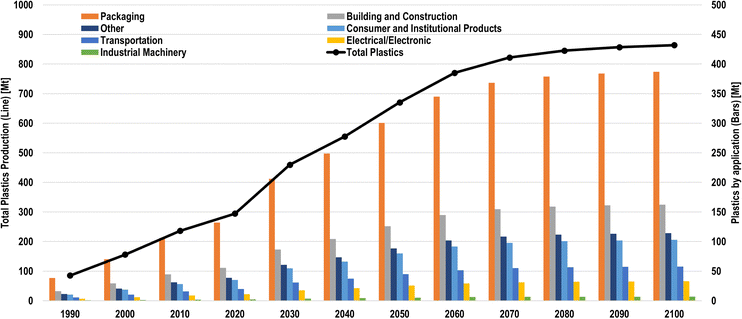 | ||
| Fig. 15 Total plastic production (line) and plastics by applications (bars) from 1990 to 2100 in 10-year intervals. | ||
2.4. Economics of chemical production
Annualised costs and levelised costs of primary chemicals (LCOC) for the scenarios defined in Section 2.3 were then determined to analyse the economic viability of green chemical pathways compared to business-as-usual conditions. A weighted average cost of capital (WACC) of 7% was applied for all technologies, and the capital recovery factor (crf) was determined using eqn (2.3). These costs were determined according to eqn (2.4) for annualised costs and eqn (2.5) for LCOC. | (2.3) |
 | (2.4) |
 | (2.5) |
Furthermore, costs were determined according to major regions to identify which regions may have the best conditions for low-cost green chemicals. Fossil fuel feedstock prices were set according to Bogdanov et al.36 Two levelised costs of electricity (LCOE) were applied, one for ‘direct’ electricity demands required to operate DAC and chemical production plants that were assumed to operate at 8000 h/a, and another for ‘indirect’ electricity used by water electrolysers to produce e-hydrogen, which can operate flexibly according to solar PV and wind generation profiles. In major regions, direct LCOE was taken from Bogdanov et al.,36 as embedded in the energy-industry system, and indirect LCOE was determined by considering a hybrid solar PV-wind power plant using utility-scale shares of solar PV and wind power from Bogdanov et al.36 from 2020 to 2050 in 10-year intervals. Additional hydrogen storage was then required assuming a storage requirement of 500 GWhH2,LHV per baseload GWhH2,LHV with an energy-to-power ratio of 200.97 GHG emissions costs were varied from 50, 114, 180, and 220 €/tCO2, as set in the 2021 IEA World Energy Outlook.37 Biomass costs were set to 34.7 € per MWhth assuming a wood pellet price of 200 USD/t98 and an exchange rate of 1.2 USD per €. A full list of financial assumptions is listed in Tables S11–S13 (ESI†).
2.5. Scenarios for defossilised chemicals
Seven scenarios were then established to study rapid and delayed defossilisation pathways compared to business-as-usual (BAU) conditions considering high and low biomass variations, as well as a transition to direct electric process heat, which are defined in Table 4. In the BAU scenario, plastic recycling rates increased according the CAGR of plastic recycling from 2010 to 2019,28 whereas in the net-zero emission (NZE) pathways these were varied to reach a maximum recycling rate of 60% in their net-zero emission year. Similarly, plastic incineration rates were varied according to historical CAGR rates28 in the BAU scenario, and linearly in the NZE scenarios to reach 40% by the net-zero emission year. Therefore, the NZE scenarios establish plastic waste management leading to no landfilling nor mismanagement of plastic waste. The transition is modelled to transition from conventional fossil routes (Fig. 10) to one based on renewable methanol and ammonia.| 2020 | 2030 | 2040 | 2050 | 2060 | 2070 | 2080 | 2090 | 2100 | ||
|---|---|---|---|---|---|---|---|---|---|---|
| BAU | Conventional | 100% | 100% | 100% | 100% | 100% | 100% | 100% | 100% | 100% |
| Improved | 0 | 0 | 0 | 0 | 0 | 0 | 0 | 0 | 0 | |
| Biochemical share | 0 | 0 | 0 | 0 | 0 | 0 | 0 | 0 | 0 | |
| NZE2050 | Conventional | 100% | 85% | 40% | 0 | 0 | 0 | 0 | 0 | 0 |
| Improved | 0 | 15% | 60% | 100% | 100% | 100% | 100% | 100% | 100% | |
| Bioplastic share high | 0 | 10% | 25% | 40% | 50% | 55% | 60% | 60% | 60% | |
| Bio-ammonia/bio-methanol share high | 0 | 5% | 10% | 15% | 20% | 20% | 20% | 20% | 20% | |
| Bioplastic share low | 0 | 2% | 5% | 10% | 10% | 10% | 10% | 10% | 10% | |
| Bio-ammonia/bio-methanol share low | 0 | 1% | 3% | 5% | 5% | 5% | 5% | 5% | 5% | |
| Direct electricity heating substitution | 0 | 11.9% | 88.1% | 99.8% | 100% | 100% | 100% | 100% | 100% | |
| NZE2040 | Conventional | 100% | 50% | 0 | 0 | 0 | 0 | 0 | 0 | 0 |
| Improved | 0 | 50% | 100% | 100% | 100% | 100% | 100% | 100% | 100% | |
| Bioplastic share high | 0 | 15% | 30% | 50% | 55% | 60% | 60% | 60% | 60% | |
| Bio-ammonia/bio-methanol share high | 0 | 10% | 15% | 20% | 20% | 20% | 20% | 20% | 20% | |
| Bioplastic share low | 0 | 5% | 10% | 10% | 10% | 10% | 10% | 10% | 10% | |
| Bio-ammonia/bio-methanol share low | 0 | 3% | 5% | 5% | 5% | 5% | 5% | 5% | 5% | |
| Direct electricity heating substitution | 0 | 50.0% | 98.2% | 100% | 100% | 100% | 100% | 100% | 100% | |
| NZE2060 | Conventional | 100% | 90% | 66% | 25% | 0 | 0 | 0 | 0 | 0 |
| Improved | 0 | 10% | 34% | 75% | 100% | 100% | 100% | 100% | 100% | |
| Bioplastic share high | 0 | 5% | 15% | 25% | 35% | 45% | 55% | 60% | 60% | |
| Bio-ammonia/bio-methanol share high | 0 | 5% | 8% | 10% | 15% | 20% | 20% | 20% | 20% | |
| Bioplastic share low | 0 | 1% | 2% | 4% | 8% | 10% | 10% | 10% | 10% | |
| Bio-ammonia/bio-methanol share low | 0 | 1% | 2% | 3% | 4% | 5% | 5% | 5% | 5% | |
| Direct electricity heating substitution | 0 | 0.2% | 11.9% | 88.1% | 100% | 100% | 100% | 100% | 100% |
The main variation among NZE scenarios, thus, is the primary energy input to these primary platform chemicals, which can be either renewable electricity (e-chemicals) or biomass (bio-chemicals). Therefore, each scenario was varied among high (H) and low (L) biomass scenarios, e.g., NZE2050H. For bio-chemical routes, no first-generation energy crops were considered as feedstocks, due to potential land-use constraints and conflicts with food production. Consequently, only lignocellulosic second-generation biomass was considered for bio-chemical production, with a maximum sustainable biomass of 100 EJ94 (27![[thin space (1/6-em)]](https://www.rsc.org/images/entities/char_2009.gif) 800 TWh). In the high biomass scenarios, the bioenergy limit was set to 70 EJ (19
800 TWh). In the high biomass scenarios, the bioenergy limit was set to 70 EJ (19![[thin space (1/6-em)]](https://www.rsc.org/images/entities/char_2009.gif) 400 TWh), and in the low biomass scenarios, the bioenergy limit was set to 25 EJ (6440 TWh). Bio-chemicals were prioritised for plastics, with smaller shares for bio-methanol and biomass-based ammonia (bio-ammonia). For non-plastic HVCs, no biomass feedstocks were applied due to the high amounts of biomass needed for bioplastics. The scenarios are defined as follows:
400 TWh), and in the low biomass scenarios, the bioenergy limit was set to 25 EJ (6440 TWh). Bio-chemicals were prioritised for plastics, with smaller shares for bio-methanol and biomass-based ammonia (bio-ammonia). For non-plastic HVCs, no biomass feedstocks were applied due to the high amounts of biomass needed for bioplastics. The scenarios are defined as follows:
3. Results
The results of this research are organised as follows: Section 3.1 presents the future global chemical production landscape from 2020 to 2100 in 10 year intervals, Section 3.2 examines the energy system and feedstock requirements for each scenario, Section 3.3 shows the evolution of regional chemical production due to increased GDP/capita in the emerging economies of the world, and Section 3.4 considers the annualised costs and LCOC of a global chemical transition to e-chemicals and bio-chemicals.3.1. Future chemical demand
Under BAU conditions, the total primary volume of the 21 chemicals modelled increases significantly from 1220 Mt (10![[thin space (1/6-em)]](https://www.rsc.org/images/entities/char_2009.gif) 069 TWhLHV) to 2763 Mt (22
069 TWhLHV) to 2763 Mt (22![[thin space (1/6-em)]](https://www.rsc.org/images/entities/char_2009.gif) 092 TWhLHV) in 2050 and 3481 Mt (27
092 TWhLHV) in 2050 and 3481 Mt (27![[thin space (1/6-em)]](https://www.rsc.org/images/entities/char_2009.gif) 795 TWhLHV) in 2100, as shown in Fig. 16.
795 TWhLHV) in 2100, as shown in Fig. 16.
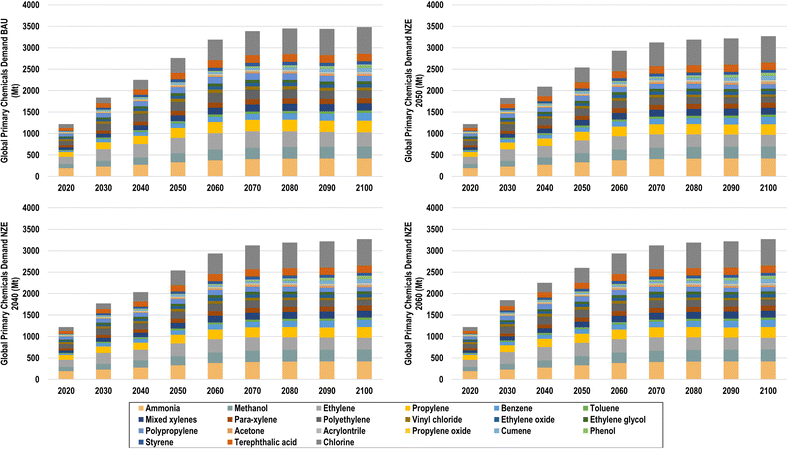 | ||
| Fig. 16 Global chemical demand for BAU (top left), NZE 2050 (top right), NZE 2040 (bottom left), and NZE 2060 (bottom right). | ||
With increased plastic recycling, however, primary chemical production can be reduced by 8.1%, 8.1%, and 5.9% in 2050 for NZE 2050, NZE 2040, and NZE 2060, respectively. By 2100, primary chemical production will be reduced by 6% compared to BAU across all NZE scenarios. The effect of recycling can be most observed in the demands of ethylene and propylene, due to the high shares of olefins in global plastics, whereas the demands of BTX aromatics are only slightly reduced due to their high use in non-plastic applications. The primary ethylene demand in the BAU scenario, for example, reaches 358 Mt in 2050, which is 12% higher than the ethylene demand in the NZE 2050 scenarios, at 296 Mt in 2050. Increased levels of both plastic recycling and stabilisation of GDP/capita levels across global regions will lead to a levelling off of global chemical demands in the latter half of the century, especially from 2070 to 2100.
This effect can be better observed in Fig. 17, where chemical demands by end use are shown.
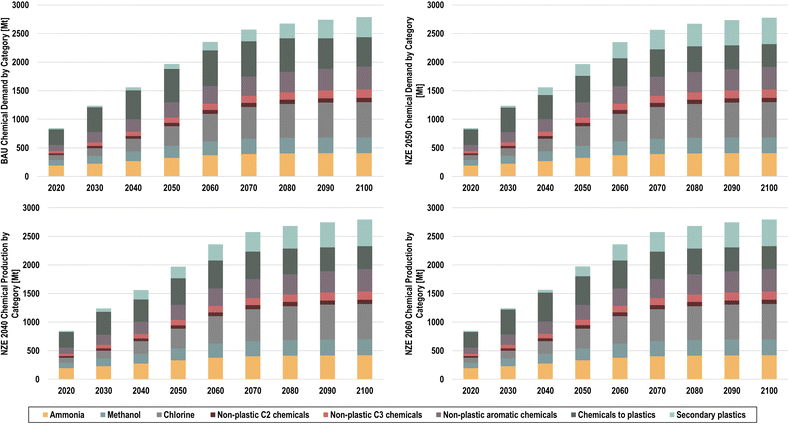 | ||
| Fig. 17 Final chemical demands by end use for BAU (top left), NZE 2050 (top right), NZE 2040 (bottom left), and NZE 2060 (bottom right). | ||
In 2050, secondary plastics will be composed of 30.7%, 30.7%, and 25.9% of the total plastic demand in the NZE 2050, NZE 2040, and NZE 2060 scenarios, respectively, and reach 53.7% of the global plastic demand by 2100 across scenarios, compared to 40.8%% in the BAU scenario. The total savings of primary final chemical production in the NZE 2050 scenario amounts to 223 Mt in 2050 and 210 Mt in 2100 compared to the BAU scenario. The rapid increase of secondary plastic shares is largely due to the high shares of packaging plastics, which typically have a lifetime of less than a year and are thus available for recycling within the same annual time step.
3.2. Flows and feedstocks for the future chemical industry
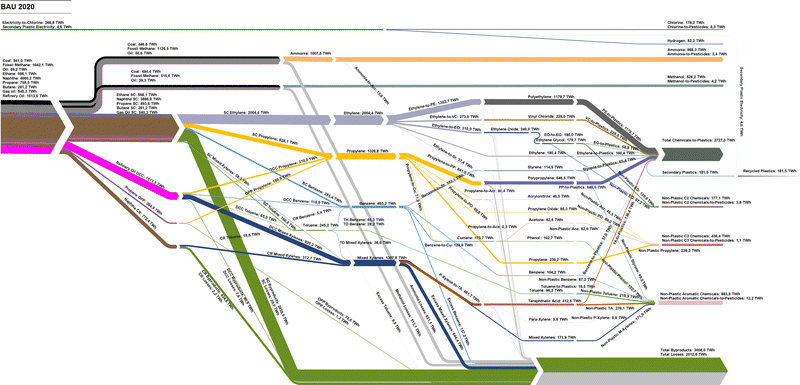
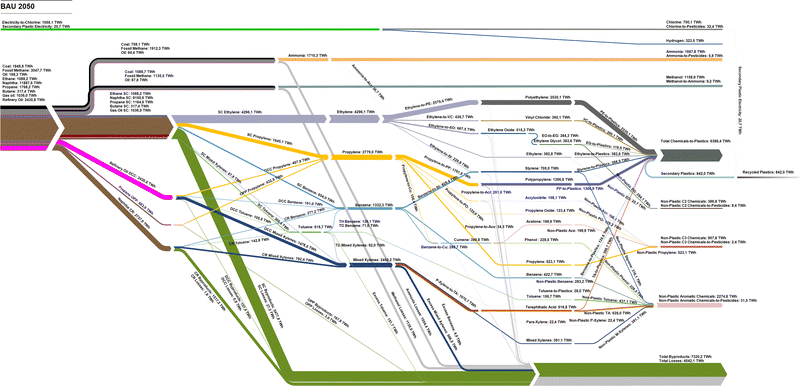
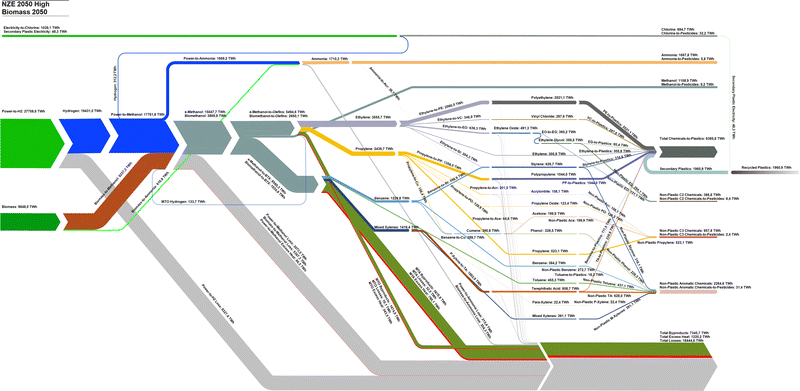
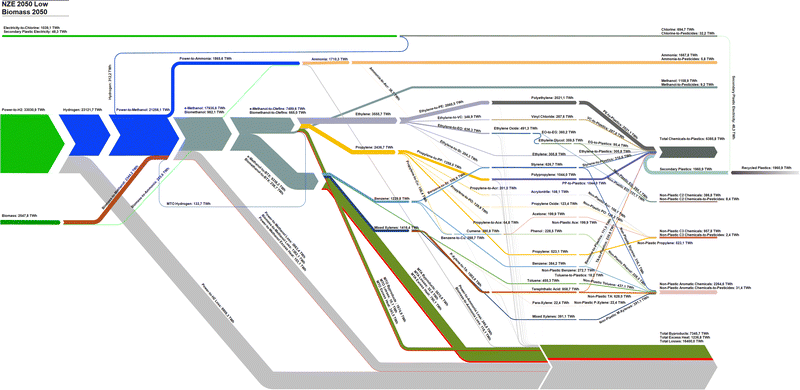
By 2050, the significant increase in global chemical demands implies similar increases in hydrocarbon feedstocks, which can either result in significant increases in fossil feedstocks, as shown in Fig. 18, or a transition to renewable hydrocarbon feedstocks, as shown in Fig. 19 and Fig. 20. In the BAU scenario, the total fossil feedstock demands increase from 11![[thin space (1/6-em)]](https://www.rsc.org/images/entities/char_2009.gif) 029 TWhth,LHV to 23
029 TWhth,LHV to 23![[thin space (1/6-em)]](https://www.rsc.org/images/entities/char_2009.gif) 591 TWhth,LHV in 2050, corresponding to a CAGR of 2.6%. The steam cracker remains the key technology to produce HVCs, consuming 54.1% of the total fossil feedstocks. Under BAU conditions, the highest shares of losses come from conventional ammonia and methanol production, whereas HVC production mostly results in by-products, whose energy content reaches 7320 TWhth,LHV, with only 0.5% feedstock losses.22
591 TWhth,LHV in 2050, corresponding to a CAGR of 2.6%. The steam cracker remains the key technology to produce HVCs, consuming 54.1% of the total fossil feedstocks. Under BAU conditions, the highest shares of losses come from conventional ammonia and methanol production, whereas HVC production mostly results in by-products, whose energy content reaches 7320 TWhth,LHV, with only 0.5% feedstock losses.22
Comparatively, the NZE 2050H and NZE 2050L scenarios present a full transition of primary energy inputs from today's fossil fuel structure to ones dominated by renewable electricity and biomass, as in the case of the NZE 2050H scenario. By 2050, 27![[thin space (1/6-em)]](https://www.rsc.org/images/entities/char_2009.gif) 759–33
759–33![[thin space (1/6-em)]](https://www.rsc.org/images/entities/char_2009.gif) 031 TWhel and 2548–9848 TWhth of biomass feedstocks are required to satisfy the global chemical feedstock demands. In NZE 2050H, the biomass demand corresponds to 35.4% of the global sustainable biomass demand, and, in NZE 2050L, only 9.2% is used. Methanol becomes the most important chemical feedstock as all olefins and BTX aromatics are derived from e-methanol and bio-methanol. While the MTO process shows a high energy conversion from the methanol feedstock to olefin, the MTA process has significant shares of input energy content converted to by-products, most notably LPG. Total losses in NZE 2050L are lower than those of NZE 2050H despite significantly increased electrolyser losses, largely due to the higher energy efficiency of the power-to-methanol process compared to biomass-to-methanol route. The new dominant power-to-chemical structure additionally introduces a new excess heat by-product, which can either be used in district heating systems, CO2 DAC, or used for other industrial process heating demands as the excess heat of the MTO process is at 500 °C. Additionally, hydrogen by-products from chlorine production and the MTO process in this study are assumed to partially substitute hydrogen from electrolysis, although the total impact of these hydrogen by-products is rather small. The energy content of recycled plastics reaches 1961 TWhth in 2050, and 30.7% of total chemicals-to-plastics. Detailed Sankey diagrams from 2020 to 2050 in 10 year intervals, 2070, and 2100 for BAU, NZE 2050H, and NZE 2050L are shown in Fig. S5–S16 (ESI†).
031 TWhel and 2548–9848 TWhth of biomass feedstocks are required to satisfy the global chemical feedstock demands. In NZE 2050H, the biomass demand corresponds to 35.4% of the global sustainable biomass demand, and, in NZE 2050L, only 9.2% is used. Methanol becomes the most important chemical feedstock as all olefins and BTX aromatics are derived from e-methanol and bio-methanol. While the MTO process shows a high energy conversion from the methanol feedstock to olefin, the MTA process has significant shares of input energy content converted to by-products, most notably LPG. Total losses in NZE 2050L are lower than those of NZE 2050H despite significantly increased electrolyser losses, largely due to the higher energy efficiency of the power-to-methanol process compared to biomass-to-methanol route. The new dominant power-to-chemical structure additionally introduces a new excess heat by-product, which can either be used in district heating systems, CO2 DAC, or used for other industrial process heating demands as the excess heat of the MTO process is at 500 °C. Additionally, hydrogen by-products from chlorine production and the MTO process in this study are assumed to partially substitute hydrogen from electrolysis, although the total impact of these hydrogen by-products is rather small. The energy content of recycled plastics reaches 1961 TWhth in 2050, and 30.7% of total chemicals-to-plastics. Detailed Sankey diagrams from 2020 to 2050 in 10 year intervals, 2070, and 2100 for BAU, NZE 2050H, and NZE 2050L are shown in Fig. S5–S16 (ESI†).
Examining the feedstock transition pathway in more detail as shown in Fig. 21, the total feedstock demand for chemicals can be expected to increase similarly with the growth in chemical demands; however, increased plastic recycling has significant effects on reducing feedstock demands. In the BAU scenario, fossil feedstock demands increase from 11![[thin space (1/6-em)]](https://www.rsc.org/images/entities/char_2009.gif) 029 TWhth in 2020 to 23
029 TWhth in 2020 to 23![[thin space (1/6-em)]](https://www.rsc.org/images/entities/char_2009.gif) 591 TWhth in 2050, and finally 27
591 TWhth in 2050, and finally 27![[thin space (1/6-em)]](https://www.rsc.org/images/entities/char_2009.gif) 705 TWhth in 2100. Comparatively, total feedstock demands in the NZE 2050 scenarios reach 20
705 TWhth in 2100. Comparatively, total feedstock demands in the NZE 2050 scenarios reach 20![[thin space (1/6-em)]](https://www.rsc.org/images/entities/char_2009.gif) 628 TWhth and 25
628 TWhth and 25![[thin space (1/6-em)]](https://www.rsc.org/images/entities/char_2009.gif) 515 TWhth in 2100, with varying levels of e-methanol and bio-methanol and ammonia. According to the scenario definition, the largest increases of renewable feedstocks occur from 2030 to 2040 and 2040 to 2050, which will be required if the global chemical industry is to reach net-zero emissions by 2050.
515 TWhth in 2100, with varying levels of e-methanol and bio-methanol and ammonia. According to the scenario definition, the largest increases of renewable feedstocks occur from 2030 to 2040 and 2040 to 2050, which will be required if the global chemical industry is to reach net-zero emissions by 2050.
Furthermore, significant e-chemical feedstocks imply significant increases in renewable electricity capacity, as the total electricity demands for the NZE 2050 scenarios reach 35![[thin space (1/6-em)]](https://www.rsc.org/images/entities/char_2009.gif) 075–40
075–40![[thin space (1/6-em)]](https://www.rsc.org/images/entities/char_2009.gif) 169 TWhel in 2050 and 40
169 TWhel in 2050 and 40![[thin space (1/6-em)]](https://www.rsc.org/images/entities/char_2009.gif) 593–50
593–50![[thin space (1/6-em)]](https://www.rsc.org/images/entities/char_2009.gif) 257 TWhel in 2100 for the NZE 2050H and NZE 2050L scenarios, respectively, from just 1645 TWhel in 2020. For reference, the IEA reported that the total electricity generation in 2020 was 26
257 TWhel in 2100 for the NZE 2050H and NZE 2050L scenarios, respectively, from just 1645 TWhel in 2020. For reference, the IEA reported that the total electricity generation in 2020 was 26![[thin space (1/6-em)]](https://www.rsc.org/images/entities/char_2009.gif) 708 TWhel.99 Therefore, by 2050, the chemical industry could be expected to have electricity demands that are 131–150% of today's global electricity generation. This result suggests that the massive ramping of renewables, especially solar PV and wind power, will be required for the defossilisation of chemicals, as supplying this electricity demand with today's electricity mix would undoubtedly cause a massive increase in chemical industry emissions.32 The highest quantities of electricity will be needed for e-hydrogen production, reaching 31
708 TWhel.99 Therefore, by 2050, the chemical industry could be expected to have electricity demands that are 131–150% of today's global electricity generation. This result suggests that the massive ramping of renewables, especially solar PV and wind power, will be required for the defossilisation of chemicals, as supplying this electricity demand with today's electricity mix would undoubtedly cause a massive increase in chemical industry emissions.32 The highest quantities of electricity will be needed for e-hydrogen production, reaching 31![[thin space (1/6-em)]](https://www.rsc.org/images/entities/char_2009.gif) 025 and 41
025 and 41![[thin space (1/6-em)]](https://www.rsc.org/images/entities/char_2009.gif) 029 TWhel in the NZE 2050H and NZE 2050L scenarios, respectively, as shown in Fig. 22. Comparatively, direct electricity demands remain low across scenarios, only reaching 2564 (96% of total electricity demand), 6449 (13%), and 5523 (11%) TWhel in 2100 in the BAU, NZE 2050H, and NZE 2050L scenarios, respectively.
029 TWhel in the NZE 2050H and NZE 2050L scenarios, respectively, as shown in Fig. 22. Comparatively, direct electricity demands remain low across scenarios, only reaching 2564 (96% of total electricity demand), 6449 (13%), and 5523 (11%) TWhel in 2100 in the BAU, NZE 2050H, and NZE 2050L scenarios, respectively.
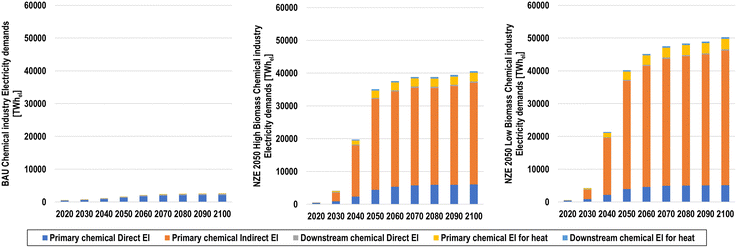 | ||
| Fig. 22 Direct (for chemical production plants), indirect (for water electrolysis), and heating electricity demands for the BAU (top left), NZE 2050H (top right), and NZE 2050L (bottom) scenarios. | ||
A small but important shift occurs with process heating demands, as they transition from fossil boilers to electric boilers and heat pumps, as shown in Fig. 23. In the BAU scenario, continued usage of fossil chemical processes leads to the highest energy requirements for heat of the scenarios studied, increasing from 1417 TWhth in 2020 to 3265 TWhth in 2050, and 3521 TWhth in 2100. Comparatively, the highest share of future heat demands for the chemical industry in the NZE scenarios is the heat required CO2via DAC using heat pumps for the power-to-methanol process. The total energy for heating in the NZE 2050 scenarios ranges from 2610 to 2919 TWh in 2050 and 7250 to 9420 TWh in 2100 for NZE 2050H and NZE 2050L, respectively. Other process heating demands for primary and downstream chemical production then transition to direct electric heating, assuming that temperature requirements are higher than what can be supplied by heat pumps for the downstream production processes. By 2100, 1549–1581 TWhth of recoverable heat will be available.
The impact of the transition from fossil to sustainable feedstocks on emissions is shown in Fig. 24 by type for the BAU, NZE 2050H, and NZE 2050L scenarios.
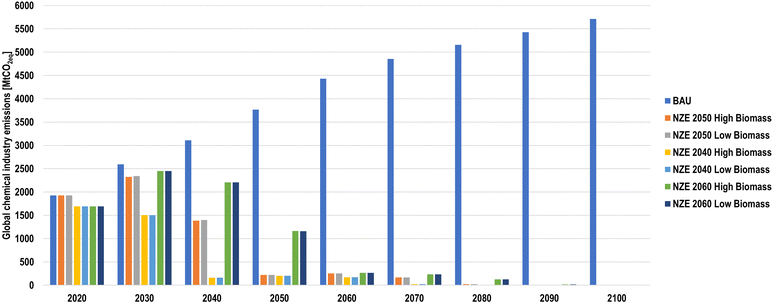
Fig. 25 then shows emissions levels for all scenarios studied. Emissions from the production of the chemicals considered in this study were found to be 1240 MtCO2eq in 2020, corresponding to 3.6% of global CO2 emissions.99 The fossil content of non-plastic chemicals and incineration of fossil plastic waste contribute an additional 685 MtCO2eq, leading to total emissions of 1926 MtCO2eq. In the BAU scenario, emissions steadily increase in the coming decades, reaching 3769 MtCO2eq in 2050, before levelling off at an emissions level of 5713 MtCO2eq in 2100. Interestingly, the large increase of production-related emissions in the BAU scenario seems to largely be a result of emissions from process heat, rather than from feedstocks. If all process emissions were reduced to zero in the BAU case, production-related emissions would only reach 1626 MtCO2eq by 2100. Furthermore, the growing levels of fossil plastic waste and fossil chemical production lead to significant growth in the GHG impact of fossil chemicals.
While the NZE 2050 scenarios achieve emissions targets by the target year, it is not due to a steady decline in emissions. Rather, an emissions peak in 2030 due to increased fossil feedstock usage and rising electricity demands in an electricity system environment with an emissions factor of 0.086 tCO2/MWhel, with the NZE 2040 scenarios being the exception. After the first time-step, emissions decline from 2030 to 2040 before reaching net-zero CO2 emissions in 2050. Comparing the emissions trajectories of all scenarios shows that the high biomass scenarios tend to have lower emissions in the transition years relative to their low biomass counterparts. This is again likely due to the increased electricity usage of the low biomass scenarios.
3.3. Geographical distribution
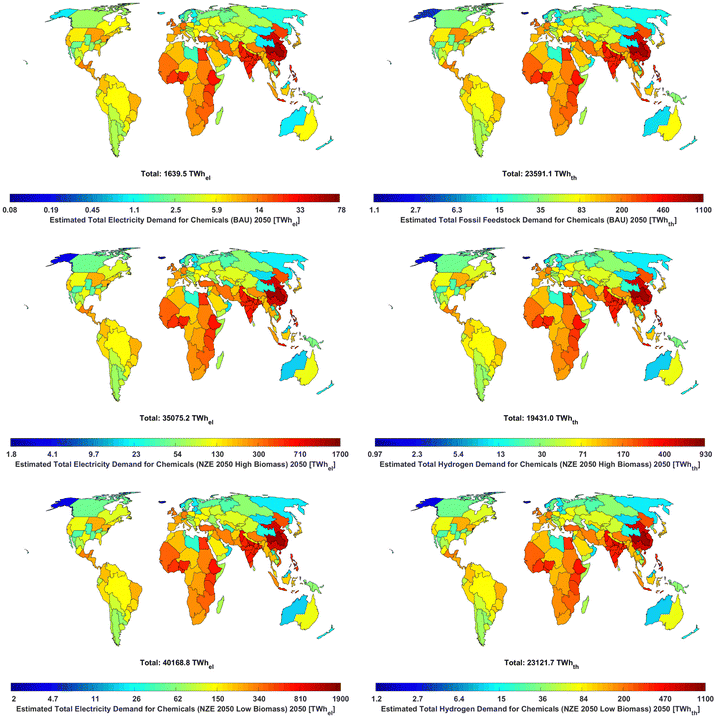
While global feedstock and process energy demands are projected to increase, regional pathways were found to vary substantially. However, all global regions experience massive growth in electricity and hydrogen demands, with the regions of the Global South having a much larger role in global chemical production compared to today's regional structure (Fig. 10). The regional structures of key inputs to the global chemical industry for the BAU and NZE 2050 scenarios are shown in Fig. 26. The regional results show that the increases in total demand for electricity, fossil feedstocks in the BAU scenario, and e-hydrogen in the NZE 2050 scenarios is primarily driven by significant growth in the chemical demand in Africa, South America, and Southeast Asia. The NZE 2050H scenario, despite high biomass usage for plastics, finds regional electricity demands above 200 TWhel in 2050, and, correspondingly, the highest chemical demand regions experience e-hydrogen demands up to 930 TWhH2,LHV. In the NZE 2050L scenario, these demands are even higher on a regional basis, as the average regional electricity and hydrogen demands are 277 TWhel and 159 TWhH2,LHV, with Central China having the highest of both demands at 1919 TWhel and 1104 TWhH2,LHV, respectively.While industrialised regions of the world including Europe and North America experience only limited growth in the total feedstock required, as shown in Table 5, e-hydrogen and biomass demands substantially grow across all major regions. Table 6 and Table 7 indicate that for many major regions, peak e-hydrogen demands for chemicals will occur around 2050 and 2060, though the regions of Eurasia, MENA, sub-Saharan Africa, and North America experience peak e-hydrogen demands in 2100. Due to increasing shares of biomass feedstocks in the NZE 2050 scenarios, many regions do not have their peak biomass demands until 2100. Peak process electricity demands largely follow the trends of e-hydrogen demands, largely due to the regional co-location of MTO and MTA plants and electrolyser capacities. Geographical results thus further highlight a shift of chemical production from the Global North to the Global South as the sub-Saharan Africa and SAARC regions experience the most rapid growth in renewable feedstocks and will have the highest e-hydrogen and biomass feedstock demands by 2100. Additional regional results by scenario for 2030, 2040, 2070, and 2100 are available in Fig. S17–S49 (ESI†).
| Fossil feedstock demand BAU [TWhth] | 2020 | 2030 | 2040 | 2050 | 2060 | 2070 | 2080 | 2090 | 2100 |
|---|---|---|---|---|---|---|---|---|---|
| Europe | 1577 | 2046 | 1971 | 1861 | 1713 | 1621 | 1578 | 1568 | 1582 |
| Eurasia | 1081 | 1123 | 916 | 770 | 773 | 761 | 746 | 720 | 730 |
| MENA | 1056 | 1400 | 1441 | 1554 | 1793 | 1905 | 1924 | 1874 | 1899 |
| Sub-Saharan Africa | 116 | 672 | 1906 | 4180 | 6577 | 8230 | 9086 | 9441 |
10![[thin space (1/6-em)]](https://www.rsc.org/images/entities/b_char_2009.gif) 063 063
|
| SAARC | 760 | 2072 | 3703 | 5407 | 6137 | 6110 | 5788 | 5470 | 5274 |
| Northeast Asia | 3205 | 4717 | 4818 | 4379 | 3828 | 3488 | 3286 | 3149 | 3082 |
| Southeast Asia | 749 | 1360 | 1853 | 2261 | 2352 | 2243 | 2167 | 2114 | 2092 |
| North America | 2125 | 2415 | 2035 | 1713 | 1672 | 1659 | 1679 | 1679 | 1734 |
| South America | 362 | 785 | 1148 | 1466 | 1518 | 1428 | 1348 | 1284 | 1248 |
| Total global | 11![[thin space (1/6-em)]](https://www.rsc.org/images/entities/char_2009.gif) 029 029 |
16![[thin space (1/6-em)]](https://www.rsc.org/images/entities/char_2009.gif) 590 590 |
19![[thin space (1/6-em)]](https://www.rsc.org/images/entities/char_2009.gif) 790 790 |
23![[thin space (1/6-em)]](https://www.rsc.org/images/entities/char_2009.gif) 591 591 |
26![[thin space (1/6-em)]](https://www.rsc.org/images/entities/char_2009.gif) 364 364 |
27![[thin space (1/6-em)]](https://www.rsc.org/images/entities/char_2009.gif) 446 446 |
27![[thin space (1/6-em)]](https://www.rsc.org/images/entities/char_2009.gif) 601 601 |
27![[thin space (1/6-em)]](https://www.rsc.org/images/entities/char_2009.gif) 300 300 |
27![[thin space (1/6-em)]](https://www.rsc.org/images/entities/b_char_2009.gif) 705 705
|
| Direct electricity demand BAU [TWhel] | 2020 | 2030 | 2040 | 2050 | 2060 | 2070 | 2080 | 2090 | 2100 |
|---|---|---|---|---|---|---|---|---|---|
| Europe | 73 | 96 | 112 | 128 | 137 | 140 | 139 | 138 | 136 |
| Eurasia | 50 | 51 | 50 | 49 | 56 | 59 | 61 | 61.1 | 61.5 |
| MENA | 56 | 71 | 86 | 109 | 144 | 164 | 174 | 179 | 182 |
| Sub-Saharan Africa | 6 | 32 | 107 | 274 | 489 | 658 | 768 | 849 | 919 |
| SAARC | 35 | 96 | 204 | 351 | 466 | 513 | 518 | 507 | 491 |
| Northeast Asia | 150 | 221 | 274 | 302 | 320 | 316 | 304 | 291 | 279 |
| Southeast Asia | 35 | 63 | 101 | 146 | 178 | 191 | 193 | 192 | 189 |
| North America | 104 | 116 | 115 | 114 | 129 | 138 | 144 | 147 | 149 |
| South America | 17 | 36 | 63 | 94 | 115 | 123 | 123 | 120 | 116 |
| Total global | 525 | 782 | 1112 | 1567 | 2034 | 2302 | 2424 | 2483 | 2523 |
| Total e-Hydrogen demand NZE 2050H [TWhH2,LHV] | 2020 | 2030 | 2040 | 2050 | 2060 | 2070 | 2080 | 2090 | 2100 |
|---|---|---|---|---|---|---|---|---|---|
| Europe | 0 | 220 | 1066 | 1556 | 1339 | 1256 | 1217 | 1229 | 1256 |
| Eurasia | 0 | 119 | 451 | 560 | 541 | 545 | 560 | 574 | 591 |
| MENA | 0 | 121 | 767 | 1308 | 1410 | 1468 | 1489 | 1528 | 1576 |
| Sub-Saharan Africa | 0 | 65 | 1026 | 3480 | 5038 | 6079 | 6556 | 7102 | 7713 |
| SAARC | 0 | 214 | 1976 | 4471 | 4754 | 4623 | 4281 | 4106 | 4025 |
| Northeast Asia | 0 | 495 | 2607 | 3748 | 3137 | 2810 | 2625 | 2568 | 2561 |
| Southeast Asia | 0 | 141 | 974 | 1828 | 1780 | 1706 | 1619 | 1601 | 1609 |
| North America | 0 | 261 | 1051 | 1288 | 1212 | 1262 | 1312 | 1361 | 1416 |
| South America | 0 | 87 | 610 | 1191 | 1152 | 1095 | 1017 | 984 | 970 |
| Total global | 0 | 1724 | 10![[thin space (1/6-em)]](https://www.rsc.org/images/entities/char_2009.gif) 528 528 |
19![[thin space (1/6-em)]](https://www.rsc.org/images/entities/char_2009.gif) 431 431 |
20![[thin space (1/6-em)]](https://www.rsc.org/images/entities/char_2009.gif) 362 362 |
20![[thin space (1/6-em)]](https://www.rsc.org/images/entities/char_2009.gif) 844 844 |
20![[thin space (1/6-em)]](https://www.rsc.org/images/entities/char_2009.gif) 675 675 |
21![[thin space (1/6-em)]](https://www.rsc.org/images/entities/char_2009.gif) 054 054 |
21![[thin space (1/6-em)]](https://www.rsc.org/images/entities/b_char_2009.gif) 718 718
|
| Total Biomass demand NZE 2050H [TWhth] | 2020 | 2030 | 2040 | 2050 | 2060 | 2070 | 2080 | 2090 | 2100 |
|---|---|---|---|---|---|---|---|---|---|
| Europe | 0 | 31 | 284 | 729 | 788 | 796 | 845 | 852 | 873 |
| Eurasia | 0 | 17 | 113 | 230 | 291 | 329 | 385 | 395 | 406 |
| MENA | 0 | 22 | 209 | 638 | 920 | 1060 | 1184 | 1191 | 1211 |
| Sub-Saharan Africa | 0 | 11 | 309 | 1935 | 3757 | 5026 | 5901 | 6197 | 6577 |
| SAARC | 0 | 31 | 576 | 2413 | 3389 | 3579 | 3531 | 3255 | 3118 |
| Northeast Asia | 0 | 71 | 708 | 1796 | 1874 | 1768 | 1781 | 1724 | 1716 |
| Southeast Asia | 0 | 20 | 276 | 947 | 1205 | 1251 | 1274 | 1229 | 1219 |
| North America | 0 | 37 | 268 | 534 | 646 | 772 | 917 | 955 | 995 |
| South America | 0 | 12 | 173 | 627 | 791 | 812 | 805 | 755 | 731 |
| Total global | 0 | 251 | 2916 | 9848 | 13![[thin space (1/6-em)]](https://www.rsc.org/images/entities/char_2009.gif) 661 661 |
15![[thin space (1/6-em)]](https://www.rsc.org/images/entities/char_2009.gif) 392 392 |
16![[thin space (1/6-em)]](https://www.rsc.org/images/entities/char_2009.gif) 622 622 |
16![[thin space (1/6-em)]](https://www.rsc.org/images/entities/char_2009.gif) 554 554 |
16![[thin space (1/6-em)]](https://www.rsc.org/images/entities/b_char_2009.gif) 846 846
|
| Direct Electricity demand NZE 2050H [TWhel] | 2020 | 2030 | 2040 | 2050 | 2060 | 2070 | 2080 | 2090 | 2100 |
|---|---|---|---|---|---|---|---|---|---|
| Europe | 73 | 135 | 259 | 367 | 355 | 347 | 347 | 346 | 349 |
| Eurasia | 50 | 72 | 109 | 128 | 139 | 147 | 156 | 159 | 162 |
| MENA | 56 | 99 | 192 | 313 | 387 | 426 | 450 | 456 | 464 |
| Sub-Saharan Africa | 6 | 45 | 258 | 872 | 1457 | 1863 | 2101 | 2248 | 2403 |
| SAARC | 35 | 135 | 491 | 1108 | 1354 | 1390 | 1336 | 1261 | 1214 |
| Northeast Asia | 148 | 308 | 636 | 889 | 837 | 778 | 745 | 717 | 703 |
| Southeast Asia | 35 | 88 | 241 | 446 | 497 | 502 | 493 | 481 | 475 |
| North America | 104 | 161 | 254 | 294 | 312 | 341 | 369 | 380 | 392 |
| South America | 17 | 51 | 150 | 292 | 323 | 323 | 312 | 297 | 287 |
| Total global | 524 | 1095 | 2591 | 4709 | 5663 | 6118 | 6309 | 6347 | 6449 |
| Total e-Hydrogen demand NZE 2050L [TWhH2,LHV] | 2020 | 2030 | 2040 | 2050 | 2060 | 2070 | 2080 | 2090 | 2100 |
|---|---|---|---|---|---|---|---|---|---|
| Europe | 0 | 233 | 1179 | 1826 | 1653 | 1580 | 1567 | 1582 | 1618 |
| Eurasia | 0 | 126 | 496 | 646 | 656 | 680 | 719 | 738 | 760 |
| MENA | 0 | 130 | 850 | 1547 | 1779 | 1902 | 1982 | 2023 | 2079 |
| Sub-Saharan Africa | 0 | 70 | 1150 | 4211 | 6554 | 8142 | 9015 | 9682 |
10![[thin space (1/6-em)]](https://www.rsc.org/images/entities/b_char_2009.gif) 450 450
|
| SAARC | 0 | 227 | 2206 | 5380 | 6117 | 6089 | 5750 | 5458 | 5320 |
| Northeast Asia | 0 | 523 | 2888 | 4417 | 3883 | 3529 | 3362 | 3283 | 3273 |
| Southeast Asia | 0 | 149 | 1085 | 2183 | 2263 | 2218 | 2149 | 2112 | 2116 |
| North America | 0 | 276 | 1157 | 1486 | 1469 | 1577 | 1693 | 1758 | 1829 |
| South America | 0 | 92 | 679 | 1426 | 1470 | 1427 | 1351 | 1298 | 1274 |
| Total global | 0 | 1825 | 11![[thin space (1/6-em)]](https://www.rsc.org/images/entities/char_2009.gif) 690 690 |
23![[thin space (1/6-em)]](https://www.rsc.org/images/entities/char_2009.gif) 122 122 |
25![[thin space (1/6-em)]](https://www.rsc.org/images/entities/char_2009.gif) 844 844 |
27![[thin space (1/6-em)]](https://www.rsc.org/images/entities/char_2009.gif) 143 143 |
27![[thin space (1/6-em)]](https://www.rsc.org/images/entities/char_2009.gif) 589 589 |
27![[thin space (1/6-em)]](https://www.rsc.org/images/entities/char_2009.gif) 935 935 |
28![[thin space (1/6-em)]](https://www.rsc.org/images/entities/b_char_2009.gif) 720 720
|
| Total Biomass demand NZE 2050L [TWhth] | 2020 | 2030 | 2040 | 2050 | 2060 | 2070 | 2080 | 2090 | 2100 |
|---|---|---|---|---|---|---|---|---|---|
| Europe | 0 | 6 | 60 | 188 | 162 | 151 | 149 | 150 | 153 |
| Eurasia | 0 | 3 | 24 | 60 | 60 | 63 | 68 | 69 | 71 |
| MENA | 0 | 4 | 44 | 166 | 189 | 201 | 207 | 208 | 212 |
| Sub-Saharan Africa | 0 | 2 | 65 | 501 | 773 | 947 | 1027 | 1080 | 1147 |
| SAARC | 0 | 6 | 122 | 625 | 697 | 676 | 619 | 571 | 547 |
| Northeast Asia | 0 | 14 | 150 | 463 | 385 | 336 | 314 | 304 | 302 |
| Southeast Asia | 0 | 4 | 58 | 245 | 248 | 237 | 224 | 216 | 214 |
| North America | 0 | 7 | 57 | 138 | 133 | 147 | 161 | 167 | 174 |
| South America | 0 | 2 | 37 | 162 | 163 | 154 | 141 | 133 | 128 |
| Total global | 0 | 50 | 620 | 2548 | 2811 | 2910 | 2909 | 2899 | 2948 |
| Direct Electricity demand NZE 2050L [TWhel] | 2020 | 2030 | 2040 | 2050 | 2060 | 2070 | 2080 | 2090 | 2100 |
|---|---|---|---|---|---|---|---|---|---|
| Europe | 73 | 134 | 245 | 331 | 314 | 305 | 301 | 300 | 301 |
| Eurasia | 50 | 71 | 104 | 116 | 124 | 129 | 135 | 137 | 139 |
| MENA | 56 | 97 | 181 | 281 | 339 | 369 | 385 | 391 | 397 |
| Sub-Saharan Africa | 6 | 45 | 242 | 775 | 1256 | 1590 | 1776 | 1907 | 2041 |
| SAARC | 35 | 133 | 460 | 988 | 1174 | 1196 | 1142 | 1083 | 1043 |
| Northeast Asia | 149 | 307 | 601 | 800 | 739 | 683 | 648 | 623 | 609 |
| Southeast Asia | 35 | 87 | 226 | 399 | 434 | 434 | 423 | 413 | 408 |
| North America | 104 | 160 | 241 | 268 | 278 | 300 | 319 | 328 | 337 |
| South America | 17 | 50 | 141 | 261 | 282 | 280 | 267 | 255 | 247 |
| Total global | 524 | 1086 | 2447 | 4709 | 5663 | 6118 | 6309 | 6347 | 6449 |
3.4. Cost structure for a green chemical transition
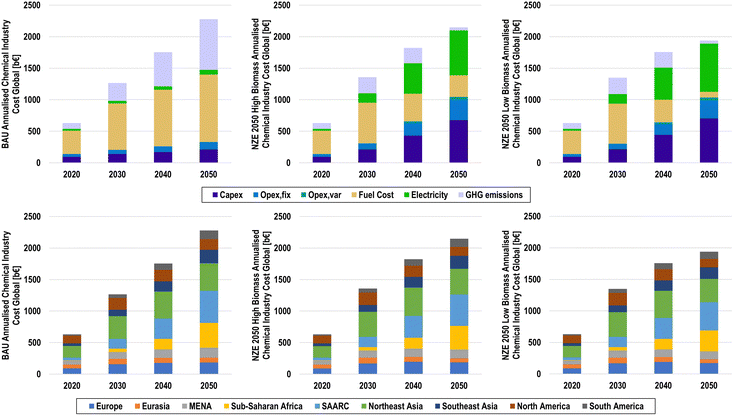
The annualised cost structures of the BAU, NZE 2050H, and NZE 2050L scenarios by cost component and by major region are shown in Fig. 27. Due to the lack of available cost data for downstream processes, the annualised costs were developed for primary production of the main platform chemicals and chlorine, as well as secondary plastic production, to represent the costs of feedstock substitution. The total annualised cost of the chemical industry in 2020 was found to be 630 b€, with fuel and feedstock costs alone totalling to 369 b€. Under BAU conditions, this cost structure continues, with GHG emission pricing mechanisms adding an additional 805 b€ by 2050 from the continued fossil fuel usage as feedstocks and for process heat. Annualised costs in the BAU scenario will reach 2274 b€ in 2050.The results suggest that the net-zero emission chemical industry can have lower annualised costs in 2050 compared to those under BAU conditions, when low-cost renewable electricity is widely applied for e-methanol and e-ammonia, as is the case in the NZE 2050L scenario, with annualised costs of 1938 b€. Conversely, the NZE 2050H scenario finds higher annualised costs of 2147 b€, which is primarily due to the high biomass feedstock costs, which total 342 b€ in 2050. Due to the widespread application of power-to-chemicals routes, the annualised cost structure transitions from being fuel dominated to being driven by electricity costs and capital expenditures (capex), especially for water electrolysers and hydrogen storage, as shown in Fig. S31 (ESI†). Increases in operational expenditures (opex) also experience a noticeable increase, largely due to high opexfix for hydrogen storage and chlor-alkali electrolysers. Furthermore, increased plastic recycling plays a limited but important role in reducing costs for primary chemical feedstocks.
Regional contributions to global annualised costs follow the structure of geographical results, as the contributions of the major chemical producing regions in 2020 decrease from 14%, 29%, and 19% to 9%, 19%, and 7% for Europe, Northeast Asia, and North America, respectively. Conversely, annualised costs in the sub-Saharan Africa and SAARC regions increase substantially from 1% and 7% in 2020 to 18% and 23% in 2050, respectively. Such a rapid growth of chemical production in the regions of the Global South suggests a massive ramping of sustainable chemical production technologies as well as renewable electricity, especially solar PV, and water electrolysers, as indicated by highly competitive solar hydrogen.100 Regional annualised costs are shown in Fig. S32–S40 (ESI†).
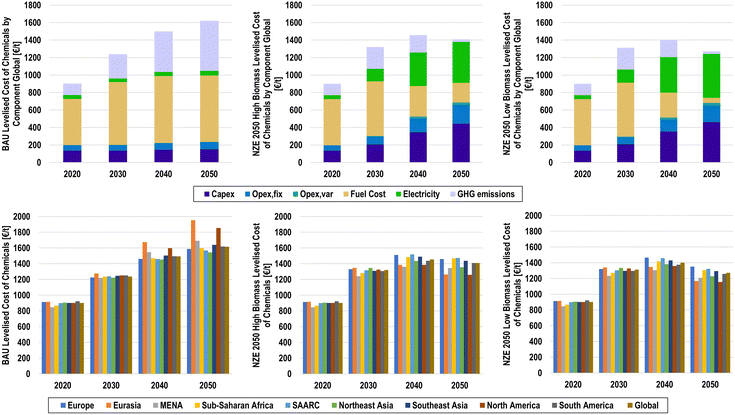
LCOC at a global level, as shown in Fig. 28, shows a similar trend as the annualised costs, as the total cost per primary chemical increases globally from 900 €/t to 1617, 1409, and 1272 €/t in 2050 for the BAU, NZE 5050H, and NZE 2050L scenarios, respectively. On a regional basis, there is a noticeable deviation of LCOC in the NZE 2050 scenarios as the LCOC ranges from 1259 to 1473 €/t and 1157 to 1352 €/t in the NZE 2050H and NZE 2050L scenarios, respectively. Despite having among the lowest LCOE, the SSA and SAARC regions have among the highest levelised costs in 2050 for the NZE 2050 scenarios, compared to MENA, which has the third lowest, due to higher demands of primary chemicals. Interestingly, North America has the lowest LCOC in 2050, pointing to optimal conditions of low LCOE and high availability of plastic waste for secondary plastics.
4. Discussion
The discussion section is separated into four sub-sections. Section 4.1 will discuss the main findings of this research in the context of other similar research. Section 4.2 provides an outlook of the green chemical industry in the context of energy system modelling. Section 4.3 considers the impacts of the defossilised chemical industry on sustainable feedstocks, and Section 4.4 discusses limitations and opportunities for further research.4.1. Main findings
The results of this research suggest that the full defossilisation of the global chemical industry implies massive renewable electricity, green e-hydrogen, and green e-methanol demands. Across the NZE emissions scenarios studied, total electricity, e-hydrogen, and e-methanol demands in 2050 range from 28![[thin space (1/6-em)]](https://www.rsc.org/images/entities/char_2009.gif) 909 to 40
909 to 40![[thin space (1/6-em)]](https://www.rsc.org/images/entities/char_2009.gif) 162 TWhel, 16
162 TWhel, 16![[thin space (1/6-em)]](https://www.rsc.org/images/entities/char_2009.gif) 069 to 23
069 to 23![[thin space (1/6-em)]](https://www.rsc.org/images/entities/char_2009.gif) 116 TWhH2,LHV, and 13
116 TWhH2,LHV, and 13![[thin space (1/6-em)]](https://www.rsc.org/images/entities/char_2009.gif) 721 to 17
721 to 17![[thin space (1/6-em)]](https://www.rsc.org/images/entities/char_2009.gif) 750 TWhMeOH,LHV, respectively. Such high quantities of sustainable feedstocks are confirmed by the literature, as research investigating net-zero emissions finds a total electricity demand of around 12
750 TWhMeOH,LHV, respectively. Such high quantities of sustainable feedstocks are confirmed by the literature, as research investigating net-zero emissions finds a total electricity demand of around 12![[thin space (1/6-em)]](https://www.rsc.org/images/entities/char_2009.gif) 3074-34
3074-34![[thin space (1/6-em)]](https://www.rsc.org/images/entities/char_2009.gif) 70033 TWhel, the majority of which would be used for green e-hydrogen production. Although increased recycling levels can reduce the quantity of primary feedstocks, secondary plastics are not sufficient to cover global plastic demands. In 2050, secondary plastics can cover 26–31% of total plastics, and by 2100, this share increases to 51%. Saygin and Gielen4 found that by 2050, 42% of the plastic demand can be satisfied by increased recycling, though this also comes with demand reduction measures. Outside of chemicals-to-plastics, chemicals-to-pesticides increase steadily from 24.8 TWhth in 2020 to 57.3 TWhth in 2050 and 82.2 TWhth in 2100, which roughly correspond to feedstock demands of 55, 129, and 185 TWhth in 2020, 2050, and 2100, respectively, considering a feedstock demand of 2.25 MWhth/MWhth,pesticide.101
70033 TWhel, the majority of which would be used for green e-hydrogen production. Although increased recycling levels can reduce the quantity of primary feedstocks, secondary plastics are not sufficient to cover global plastic demands. In 2050, secondary plastics can cover 26–31% of total plastics, and by 2100, this share increases to 51%. Saygin and Gielen4 found that by 2050, 42% of the plastic demand can be satisfied by increased recycling, though this also comes with demand reduction measures. Outside of chemicals-to-plastics, chemicals-to-pesticides increase steadily from 24.8 TWhth in 2020 to 57.3 TWhth in 2050 and 82.2 TWhth in 2100, which roughly correspond to feedstock demands of 55, 129, and 185 TWhth in 2020, 2050, and 2100, respectively, considering a feedstock demand of 2.25 MWhth/MWhth,pesticide.101
Results additionally suggest that CO2 demands by the global chemical industry will require 3.39–4.74 GtCO2 in 2050. Research investigating a CCU-based chemical industry in 203032 similarly found a global CO2 demand of 3.72 GtCO2, though this scenario assumes a power-to-methane-to-ammonia route rather than the power-to-hydrogen-to-ammonia route considered in this study. While this research assumes a supply of CO2 from DAC, there are key sustainable or unavoidable point source emissions from cement production, pulp and paper mills, and waste incineration, and this potential has been estimated to be 2471 MtCO2 in 2050.62 Additionally, point-source capture of fossil plastic emissions in waste incinerators could provide CCU opportunities for the fossil carbon embedded in fossil plastics; however, this potential is limited to only several hundred MtCO2. For the global CO2 demands of this research, the total point source emission potential could satisfy 52–74% of total CO2 demands by 2050, which could increase the economic viability of power-to-chemicals. This may also lead to co-location of e-chemical production with low-cost point source CO2 emissions.102
The geographical results suggest that the most rapid growth of green feedstocks for most regions will occur from 2030 to 2050, with regions that do not reach their peaks until the end of the century only having moderate growth in feedstock demands. The most notable exception to this trend, though, can be seen in the results for sub-Saharan Africa, as the largest growth in demand occurs in the latter half of the century. While today's chemical industry is largely dominated by countries of the Global North, this structure will likely shift to have higher shares of chemical production in the countries of the Global South, which has already been observed in net-zero emissions scenarios for the steel industry.103 Research for the chemical industry in Europe finds that in a power-to-X dominated structure, the total indirect electricity demand for chemicals reaches 2634 TWhel,43 which confirms the indirect electricity demand for Europe in this study of 2609 TWhel in the NZE 2050L scenario. Additionally, e-plastics production alone in Europe could result in a total electricity demand of 1615 TWhel.104
Analysis of annualised and levelised cost structure finds that the NZE 2050L scenario, with the highest shares of e-chemicals, has the lowest annualised costs by 2050, pointing to the viability power-to-X economy105 basis for the global chemical industry. Such levels of renewable electricity supply are feasible, as research in the 100% RE system analyses has found a cost-optimal renewable electricity generation of over 100![[thin space (1/6-em)]](https://www.rsc.org/images/entities/char_2009.gif) 000 TWhel from solar PV and wind power alone.106 While this research finds that a high electrification of the global chemical industry leads to the lowest annualised costs, Zibunas et al.33 found that higher biomass shares, in conjunction with increased recycling and some electrification, lead to lowest annualised costs among net-zero emissions scenarios compared to the high electrification scenario. This contrasting finding is heavily influenced by the electricity costs used, especially for water electrolysis, which ranges from 10.0 to 18.8 €/MWhel in this research, strongly driven by the low-cost solar PV. Additionally, relevant to the economic viability of the green chemical transition is the use of GHG emissions pricing mechanisms, as the BAU scenario without GHG emissions costs would be the least cost scenario at 1468 b€ in 2050 with a LCOC of 1044 €/t. Furthermore, sustainable chemical production during the transition would consistently be more expensive than fossil routes, especially for HVCs that have low feedstock emissions. Therefore, some additional economic incentives may be required for green chemical production, such as a carbon credit for the CO2 used in e-chemicals.107
000 TWhel from solar PV and wind power alone.106 While this research finds that a high electrification of the global chemical industry leads to the lowest annualised costs, Zibunas et al.33 found that higher biomass shares, in conjunction with increased recycling and some electrification, lead to lowest annualised costs among net-zero emissions scenarios compared to the high electrification scenario. This contrasting finding is heavily influenced by the electricity costs used, especially for water electrolysis, which ranges from 10.0 to 18.8 €/MWhel in this research, strongly driven by the low-cost solar PV. Additionally, relevant to the economic viability of the green chemical transition is the use of GHG emissions pricing mechanisms, as the BAU scenario without GHG emissions costs would be the least cost scenario at 1468 b€ in 2050 with a LCOC of 1044 €/t. Furthermore, sustainable chemical production during the transition would consistently be more expensive than fossil routes, especially for HVCs that have low feedstock emissions. Therefore, some additional economic incentives may be required for green chemical production, such as a carbon credit for the CO2 used in e-chemicals.107
4.2. Green chemical industry in energy system modelling
While the energy transition of energy systems to high shares of renewables is well understood,106,108 the global transition of non-energy feedstocks to 100% renewable feedstock has not yet been investigated in an energy system model. However, it has been conceptionally added to the first energy system model,109 and it was applied for Europe,110 which is the only known study applying all required e-fuels and e-chemical buildings blocks for the sustainable energy-industry system transition.62 The chemical sector alone is responsible for over 11![[thin space (1/6-em)]](https://www.rsc.org/images/entities/char_2009.gif) 000 TWhth of fossil fuel consumption, and the share of chemical production in total fossil fuel demands is expected to increase as other sectors defossilise.1 Furthermore, similar to other industry sectors, high electrification of production processes is not sufficient to eliminate CO2 emissions. The chemical industry is among the most difficult to abate sectors because of the requirement of hydrocarbon feedstocks and the high costs of e-chemicals. The most feedstock emission intensive processes in the chemical industry are ammonia and methanol production; thus research has largely focused on the defossilisation of these processes through power-to-X13,19,63,64,70,111–116 and biomass85,117–121 routes. While methanol-to-chemicals routes have gained increased attention in the literature for methanol-to-olefins24,72,74,75,122 and methanol-to-aromatics,76,77,123 much of this research has focused on coal-based methanol rather than power-to-methanol.
000 TWhth of fossil fuel consumption, and the share of chemical production in total fossil fuel demands is expected to increase as other sectors defossilise.1 Furthermore, similar to other industry sectors, high electrification of production processes is not sufficient to eliminate CO2 emissions. The chemical industry is among the most difficult to abate sectors because of the requirement of hydrocarbon feedstocks and the high costs of e-chemicals. The most feedstock emission intensive processes in the chemical industry are ammonia and methanol production; thus research has largely focused on the defossilisation of these processes through power-to-X13,19,63,64,70,111–116 and biomass85,117–121 routes. While methanol-to-chemicals routes have gained increased attention in the literature for methanol-to-olefins24,72,74,75,122 and methanol-to-aromatics,76,77,123 much of this research has focused on coal-based methanol rather than power-to-methanol.
Although feedstock switching is the key to defossilisation of the chemical industry, it is also crucial to understand how feedstock quantities can change because of process switching. Taking ethylene, this research shows a global transition from steam crackers based on oil products to MTO. Outside of the main products, the by-product structure of these routes is noticeably different, and research suggests that some steam crackers may be necessary to satisfy global butadiene demands, which today is covered completely by steam cracker by-products.4 Furthermore, the feedstock requirements per ton of chemicals can vary significantly by the process and feedstock, which is especially true for the MTA process, which has a BTX yield of only 16%.26 Therefore, a one-to-one feedstock switching for modelling of global chemical demands may not be appropriate, and more detailed examination of feedstock requirements for the primary platform chemicals is necessary, as performed in this research. The approach presented in this research can thus provide scalable sustainable pathways for the global chemical industry that fully phases out fossil fuels that can be applied in energy system models.
Understanding the transition of the global chemical industry towards sustainable feedstocks in conjunction with the larger global energy-industry system transition is still lacking.106 The 2022 IEA World Energy Outlook's NZE 2050 scenario99 still requires over 20 EJ of fossil feedstocks for chemical production, with electrification routes only being utilised for e-ammonia and e-methanol production. However, when considering the quantities of feedstocks that would need to be defossilised, a full consideration of chemical feedstocks is extremely relevant to the complete energy-industry transition perspective. When examining the NZE2050 scenarios, the total feedstocks required increase from 11![[thin space (1/6-em)]](https://www.rsc.org/images/entities/char_2009.gif) 029 TWhth of fossil feedstocks in 2020 to 20
029 TWhth of fossil feedstocks in 2020 to 20![[thin space (1/6-em)]](https://www.rsc.org/images/entities/char_2009.gif) 628 TWhth of e-chemical feedstocks in 2050, and 25
628 TWhth of e-chemical feedstocks in 2050, and 25![[thin space (1/6-em)]](https://www.rsc.org/images/entities/char_2009.gif) 515 TWhth in 2100. Fully defossilised feedstock demands would then require primary electricity and bioenergy demands of 27
515 TWhth in 2100. Fully defossilised feedstock demands would then require primary electricity and bioenergy demands of 27![[thin space (1/6-em)]](https://www.rsc.org/images/entities/char_2009.gif) 759–33
759–33![[thin space (1/6-em)]](https://www.rsc.org/images/entities/char_2009.gif) 082 TWhel and 2548–9848 TWhth in 2050, and 31
082 TWhel and 2548–9848 TWhth in 2050, and 31![[thin space (1/6-em)]](https://www.rsc.org/images/entities/char_2009.gif) 026–42
026–42![[thin space (1/6-em)]](https://www.rsc.org/images/entities/char_2009.gif) 108 TWhel and 2948–16
108 TWhel and 2948–16![[thin space (1/6-em)]](https://www.rsc.org/images/entities/char_2009.gif) 846 TWhth in 2100, respectively. Therefore, detailed estimates of the primary energy and final energy demands of the chemical industry, as performed in Keiner et al.,38 are essential for developing comprehensive perspectives on the energy-industry transition, as it may be the most relevant in terms of primary and final energy demands for all industrial sectors.
846 TWhth in 2100, respectively. Therefore, detailed estimates of the primary energy and final energy demands of the chemical industry, as performed in Keiner et al.,38 are essential for developing comprehensive perspectives on the energy-industry transition, as it may be the most relevant in terms of primary and final energy demands for all industrial sectors.
Insights into the European energy-industry transition110 are among the first to provide defossilisation pathways for chemical feedstocks, and point to an interesting dynamic where e-naphtha, a by-product from the Fischer-Tropsch process for e-fuels production,124 can be used as a feedstock in the chemical industry. Given the low yield of BTX aromatics from the MTA process, e-naphtha by-products may be best utilised in the catalytic reforming of naphtha, which has a much higher aromatic yield. Ikähemo et al.17 investigated the interactions of e-ammonia production in the Northern European energy system and found that e-ammonia could act as a form of long-term energy storage and that waste heat from the power-to-ammonia process could be used for space heating or in other industrial processes. Given that both the MTO and MTA processes are exothermic,74 with excess heat from these processes alone reaching over 861–1134 TWhth by 2050, there may be opportunities for analogous usage of waste heat both in other industrial processes of district heating systems, and as valuable heat for reducing CO2 sourcing cost in DAC units.125 Additionally, the high wastewater by-product from MTO and MTA could supply the high water demands required for electrolysis, which may be extremely relevant if there is a gradual shift of the global chemical industry towards production in regions with low-cost electricity and large amounts of the available land. CCU for the chemical industry could increase the circularity of the global chemical industry in CO2, energy integration, and water.45 However, the power-to-methanol and methanol-to-chemical production sites may be part of split value chains, which would reduce the potential to utilise this wastewater by-product.
4.3. Impact of the global chemical industry on sustainable feedstock demands
Since the NZE 2050L scenario emerges as the least cost scenario studied, many regions of the world may opt for an e-chemical production landscape, especially those with limited sustainable biomass resources. Of the industrial sectors, the chemical industry stands to become the industry with the highest demand for e-hydrogen, as this research finds e-hydrogen demands in the range of 16![[thin space (1/6-em)]](https://www.rsc.org/images/entities/char_2009.gif) 069–23
069–23![[thin space (1/6-em)]](https://www.rsc.org/images/entities/char_2009.gif) 116 TWhH2,LHV. In a chemical sector completely supplied by e-ammonia and e-methanol, the total e-hydrogen demand could similarly be within the range of 19
116 TWhH2,LHV. In a chemical sector completely supplied by e-ammonia and e-methanol, the total e-hydrogen demand could similarly be within the range of 19![[thin space (1/6-em)]](https://www.rsc.org/images/entities/char_2009.gif) 000 TWhH2,LHV.12 Furthermore, if all chemical demands in 2030 were to be supplied by e-methanol and e-methane for ammonia, total e-hydrogen demands would total 19
000 TWhH2,LHV.12 Furthermore, if all chemical demands in 2030 were to be supplied by e-methanol and e-methane for ammonia, total e-hydrogen demands would total 19![[thin space (1/6-em)]](https://www.rsc.org/images/entities/char_2009.gif) 831 TWhH2,LHV.32 This e-hydrogen demand may be larger than the next two largest industrial consumers, the cement and steel industry, whose e-hydrogen demands may range between 4900 and 10
831 TWhH2,LHV.32 This e-hydrogen demand may be larger than the next two largest industrial consumers, the cement and steel industry, whose e-hydrogen demands may range between 4900 and 10![[thin space (1/6-em)]](https://www.rsc.org/images/entities/char_2009.gif) 400 TWhH2,LHV126 and 2800 and 4400 TWhH2,LHV,103 respectively. In the NZE 2050 scenario studied, the total installed electrolyser capacity would reach 5.2–6.2 TWH2,LHV by 2050, assuming flexible operation according to renewable electricity generation profiles,36 which represents about 31–36% of the total estimated about 17 TWH2,LHV of the electrolyser demand by 2050.100 The steel and cement industries then may require additional terawatt-scale capacities of both electrolysers and solar PV and wind power to ensure low e-hydrogen production costs.
400 TWhH2,LHV126 and 2800 and 4400 TWhH2,LHV,103 respectively. In the NZE 2050 scenario studied, the total installed electrolyser capacity would reach 5.2–6.2 TWH2,LHV by 2050, assuming flexible operation according to renewable electricity generation profiles,36 which represents about 31–36% of the total estimated about 17 TWH2,LHV of the electrolyser demand by 2050.100 The steel and cement industries then may require additional terawatt-scale capacities of both electrolysers and solar PV and wind power to ensure low e-hydrogen production costs.
The solar PV capacity in 2021 represented 50% of the global added power generation capacity.127 It is ramped at a high CAGR of 20–30%/a in the long term and a silicon production capacity of more than 900 GW/a is forecasted by 2050,128 while the growth is projected to continue.36,129 Studies have found that 70–80% of the total global electricity generation could be contributed by solar PV by 2050,36 which is a consequence of low-costs, the historic fastest growth and phase-in of any energy source,130 and the PV industry that is capable to continuously grow faster in manufacturing capacities than the demand.129,131 It is estimated that the total installed PV capacity by 2050 could be up to 70 TW,129 of which 18.6 TW (27%) would be required for the chemical industry, assuming 76% of the 40![[thin space (1/6-em)]](https://www.rsc.org/images/entities/char_2009.gif) 382 TWh of the electricity demand for the NZE 2050L supplied by the solar PV for a global average yield of 1650 kWh/kWp.36 Furthermore, CO2 capture facilities, either a point source or DAC, will need to be in the order of GtCO2/a, as this research finds a total CO2 demand of 3.34–4.74 GtCO2/a.
382 TWh of the electricity demand for the NZE 2050L supplied by the solar PV for a global average yield of 1650 kWh/kWp.36 Furthermore, CO2 capture facilities, either a point source or DAC, will need to be in the order of GtCO2/a, as this research finds a total CO2 demand of 3.34–4.74 GtCO2/a.
During the transitionary period, biomass could be used to reduce chemical industry emissions without such a large electrolyser and CO2 capture plants, though there would still be the need for megaton-scale bio-ammonia and bio-methanol plants. In this research, biomass resources were prioritised for bioplastic chemicals, which, with limited shares of bio-ammonia and direct bio-methanol, require 16![[thin space (1/6-em)]](https://www.rsc.org/images/entities/char_2009.gif) 799 TWhth of biomass by 2100, corresponding to 60% of the global sustainable biomass resource of 100 EJ94 (27
799 TWhth of biomass by 2100, corresponding to 60% of the global sustainable biomass resource of 100 EJ94 (27![[thin space (1/6-em)]](https://www.rsc.org/images/entities/char_2009.gif) 800 TWh). While the share of biochemicals could be higher, sustainable biomass may also be in competition with use in other energy sectors, such as biofuels for transport, bioenergy for heat supply, and compete with food production.42 Without increases in plastic recycling, total biomass consumption for chemicals could reach up to 101 EJ,33 just about exceeding sustainable limits.
800 TWh). While the share of biochemicals could be higher, sustainable biomass may also be in competition with use in other energy sectors, such as biofuels for transport, bioenergy for heat supply, and compete with food production.42 Without increases in plastic recycling, total biomass consumption for chemicals could reach up to 101 EJ,33 just about exceeding sustainable limits.
Bio-based plastics are among the chemical products that have received the most attention in recent years;1 however, a challenge remains with the biodegradability of bio-plastics, as conventional bio-based plastics, e.g., bio-based polyethylene and polyethylene terephthalate, are not biodegradable nor compostable,1 though there is research to increase the biodegradability of conventional plastics.132 Furthermore, life-cycle analysis results suggest that a power-to-polyethylene route may be more beneficial in terms of climate and biodiversity impacts compared to the bio-polyethylene route.133 The use of limited biomass resources may be best prioritised in the production of biodegradable bioplastics such as polybutylene adipate terephthalate and polylactic acid, though responsible end-of-life practices are still necessary for biodegradable plastics.134 The co-evolution and integration of e-chemicals and bio-chemicals may be a viable pathway forward, as low-cost electricity could be coupled with biogenic carbon inputs,104 along with the parallel development of biodegradable plastics.
4.4. Limitations and future work recommendations
Due to the complexity of the global chemical industry, not all data regarding chemical flows were readily available, and a lack of open access to production data in the chemical industry has been highlighted by Levi and Cullen.8 Therefore, the model developed here is not able to cover every relevant chemical production process, but major routes, especially those for ammonia, methanol, and the HVCs, are fully covered. Additionally, data for the chemical industry is typically provided at a global level; thus regional distribution is based on feedstock usage, which may not perfectly capture where chemical products are finally used, as chemicals imports and exports are not transparent. The regional production and use landscape should be placed under further scrutiny in a transition to a green chemicals landscape, especially one dominated by e-chemicals. Previous research for e-steel has suggested that imports of intermediate iron and final steel from regions with abundant solar resources, many of which are in the Global South, may be lower in cost than domestic e-steel.135–137 Chemical production may follow a similar trend where chemical plants are sited in regions with the best RE resource availability. For China, the United States, and the Middle East, there may be sufficiently available RE resources to continue high levels of domestic production; however, Europe may have challenges with producing economically competitive e-chemicals compared to the best sites in the world. The solution for Europe may be to largely import e-methanol as a new bulk chemical so that HVC can be produced, similarly to the use of imported fossil feedstocks as of today. Therefore, additional research should investigate new supply chain configurations that can best capitalise on low-cost solar electricity to increase the economic viability of e-chemicals, especially for e-olefins and e-aromatics.When considering the economic viability of e-chemicals compared to fossil-based and biomass-based chemicals, electricity costs are the most relevant factor as primary electricity is the key input for e-chemicals. While the indirect LCOE applied to electrolysers, which do not need to match specific load profiles, has low uncertainty when supplied by hybrid solar PV-wind power plants, the direct LCOE applied to the chemical production plants, which are assumed to operate under near baseload conditions, has higher uncertainty. The direct LCOE applied in this study, based on the transition of the entire energy system,36 may better match the legacy cost of existing systems, and thus lead to higher LCOE. Comparatively, the approach taken by Fasihi and Breyer97 would be better adapted to near baseload supply of the chemical industry and new greenfield investments based on RE supply. In terms of annualised costs, applying the latter LCOE methodology would lead to increased annualised costs of 6.7% in 2020, but a decrease of annualised costs of 66 b€, or 3.0%, in 2050 in the NZE 2050L scenario. Additionally, the emission reductions from applying direct and indirect LCOEs based on greenfield hybrid solar PV-wind electricity supplies are 236, 110, and 56 MtCO2eq in 2020, 2030, and 2040, respectively, in the NZE 2050L scenario.
There is also high uncertainty with maximum potential recycling rates for plastics, as recycling rates in 2050 can range in the literature from 541 to 664%, and a recycling rate of 60% was established for the NZE year in this study. Potentially higher plastic recycling rates may be possible, which would reduce the primary chemical demand and thus the sustainable feedstock demands. Nevertheless, plastic chemicals comprise around 61% of the total chemical demand modelled in this research in 2050; therefore, significant quantities of sustainable feedstocks will still be required for non-plastic chemicals. Furthermore, as mentioned in Section 4.2, e-naphtha by-products from Fischer-Tropsch plants may be utilised to substitute green methanol demands,124 though quantities of e-naphtha available require comprehensive energy-industry system analysis and was thus not considered in this research.
5. Conclusions
The defossilisation of the global chemical industry implies significant e-hydrogen and renewable electricity demands as green ammonia and green methanol compose the background of a sustainable chemical industry. This research provides the first pathways to a sustainable chemical industry to the end of the century with a high global-local resolution of 145 LUT regions. While annualised costs for a green chemical industry can be lower than business-as-usual conditions, certain requirements must be met, such as• Gigaton-scale CO2 as the raw material is required either from point sources, e.g., cement, waste incinerators, or pulp and paper industries, or from direct air capture. Furthermore, terawatt-scale solar PV and wind power as well as electrolysers will be required for the chemical industry alone. The wastewater by-product of the methanol-to-olefins and methanol-to-aromatics processes may be usable by water electrolysers to reduce the freshwater demand of the chemical industry if electrolysers are co-located with chemical production facilities, which would be of high relevance in dry regions with excellent solar resources.
• High shares of plastic recycling are required to reduce the total feedstock requirement for primary chemicals, but the available secondary plastics are not sufficient to completely substitute primary plastic production.
• High biomass routes lead to higher annualised costs compared to high shares of e-chemicals, suggesting that limited sustainable biomass resources may be better utilised in emerging biodegradable bioplastic markets, or as a source of biogenic CO2 coupled with e-chemical production. Furthermore, use of first-generation biomass sources should be avoided due to land-use constraints and competition with food production.
• A full transition of the global energy system towards absolute zero CO2 emissions is required to completely decouple fossil fuels from the chemical industry. Without a full defossilisation of the energy system, increased shares of e-chemical production could lead to an increase in CO2 emissions from the chemical industry due to the high quantities of electricity required. Furthermore, this research finds that all process demands, both direct electric and heating, can be met by direct electricity, electric heating, and heat pumps.
Global feedstock demands for the chemical industry are expected to increase to the end of the century, with the highest growth being experienced in the emerging economies of the Global South, with global green ammonia and methanol demands reaching 2365 TWhNH3,LHV and 23![[thin space (1/6-em)]](https://www.rsc.org/images/entities/char_2009.gif) 343 TWhMeOH,LHV in 2100, respectively. This global growth in feedstock demands is driven primarily by sub-Saharan Africa and South Asia. Regional development of the chemical industry transition may affect feedstock choices for green chemicals, and new chemical production hubs may emerge in regions with high availability of land and low-cost renewable electricity, especially from solar photovoltaics. Access to sustainable feedstocks may be the largest bottleneck hindering green chemical production, thus improved waste management and higher recycling rates can serve to reduce primary feedstock demands. Therefore, rapid defossilisation of global energy systems through low-cost solar electricity, along with improved plastic recycling, can catalyse an economically viable defossilisation of the global chemical industry.
343 TWhMeOH,LHV in 2100, respectively. This global growth in feedstock demands is driven primarily by sub-Saharan Africa and South Asia. Regional development of the chemical industry transition may affect feedstock choices for green chemicals, and new chemical production hubs may emerge in regions with high availability of land and low-cost renewable electricity, especially from solar photovoltaics. Access to sustainable feedstocks may be the largest bottleneck hindering green chemical production, thus improved waste management and higher recycling rates can serve to reduce primary feedstock demands. Therefore, rapid defossilisation of global energy systems through low-cost solar electricity, along with improved plastic recycling, can catalyse an economically viable defossilisation of the global chemical industry.
Abbreviations
| ASU | Air separation unit |
| BECCS | Bioenergy carbon capture and storage |
| bio-Ammonia | Biomass-based ammonia |
| bio-Methanol | Biomass-based methanol |
| BNL | Belgium and the Netherlands |
| BTX | Benzene, toluene, and xylenes |
| CAGR | Compound annual growth rate |
| CCS | Carbon capture and storage |
| CCU | Carbon capture and utilisation |
| CR | Catalytic reforming of naphtha |
| crf | Capital recovery factor |
| DAC | Direct air capture |
| DCC | Deep catalytic cracking |
| e-Ammonia | Electricity-based ammonia |
| e-Hydrogen | Electricity-based hydrogen |
| e-Methanol | Electricity-based methanol |
| GHG | Greenhouse gas |
| HVC | High value chemical |
| IAM | Integrated assessment model |
| IEA | International energy agency |
| IPCC | Intergovernmental panel on climate change |
| LCOC | Levelised cost of chemicals |
| LCOE | Levelised cost of electricity |
| LPG | Liquefied petroleum gas |
| MENA | Middle east and north Africa |
| MeOH | Methanol |
| MTO | Methanol-to-olefins |
| MTA | Methanol-to-aromatics |
| NZE | Net-zero emissions |
| OECD | Organisation for economic co-operation and development |
| OPP | On-purpose propylene |
| RE | Renewable energy |
| TDP | Toluene disproportionation |
| THD | Toluene hydrodealkylation |
| TRL | Technology readiness level |
| SSA | Sub-Saharan Africa |
| SAARC | Southeast Asia association for regional cooperation |
| WACC | Weighted average cost of capital |
Conflicts of interest
There are no conflicts to declare.Acknowledgements
The authors gratefully acknowledge the public financing of Business Finland for the ‘P2XENABLE’ project under the number 8588/31/2019, the Academy of Finland for the ‘Industrial Emissions & CDR’ project under the number 329313, and the LUT University Research Platform ‘GreenRenew’, which partly funded this research. Dominik Keiner would like to thank the Jenny and Antti Wihuri foundation for the valuable grant.References
- IEA, The Future of Petrochemicals: Towards more sustainable plastics and fertilisers, Paris, 2018.
- R. Geyer, J. R. Jambeck and K. L. Law, Sci. Adv., 2017, 3, e1700782 CrossRef PubMed.
- IEA, Chemicals, https://www.iea.org/reports/chemicals, (accessed 24 May 2022).
- D. Saygin and D. Gielen, Energies, 2021, 14, 3772 CrossRef CAS.
- IEA, Technology Roadmap - Energy and GHG Reductions in the Chemical Industry via Catalytic Processes, Paris, 2013.
- Á. Galán-Martín, V. Tulus, I. Díaz, C. Pozo, J. Pérez-Ramírez and G. Guillén-Gosálbez, One Earth, 2021, 4, 565–583 CrossRef.
- United Nations Framework Convention on Climate Change (UNFCC), Adoption of the Paris Agreement—proposal by the president, http://unfccc.int/resource/docs/2015/cop21/eng/l09.pdf, (accessed 18 November 2021).
- P. G. Levi and J. M. Cullen, Environ. Sci. Technol., 2018, 52, 1725–1734 CrossRef CAS PubMed.
- The Royal Society, Ammonia: zero carbon fertiliser, fuel and energy storage, 2020.
- R. Horton, The Global Petrochemical Industry: Understanding the Complex Interactions Between Technology, Economics and Markets, Nexant, 2019.
- C. Smith, A. K. Hill and L. Torrente-Murciano, Energy Environ. Sci., 2020, 13, 331–344 RSC.
- T. Galimova, M. Ram, D. Bogdanov, M. Fasihi, A. Gulagi, C. Breyer and K. Krone, Renewable Sustainable Energy Rev., 2023 DOI:10.1016/j.rser.2023.113420.
- M. Fasihi, R. Weiss, J. Savolainen and C. Breyer, Appl. Energy, 2021, 294, 116170 CrossRef CAS.
- Z. J. Schiffer and K. Manthiram, Joule, 2017, 1, 10–14 CrossRef.
- T. Ayvalı, S. C. Edman Tsang and T. Van Vrijaldenhoven, Johnson Matthey Technol. Rev., 2021, 65, 275–290 CrossRef.
- G. Chehade and I. Dincer, Fuel, 2021, 299, 120845 CrossRef CAS.
- J. Ikäheimo, J. Kiviluoma, R. Weiss and H. Holttinen, Int. J. Hydrogen Energy, 2018, 43, 17295–17308 CrossRef.
- International Fertilizer Industry Association, Energy Efficiency and CO2 Emissions in Ammonia Production, https://www.fertilizer.org/images/Library_Downloads/2009_IFA_energy_efficiency.pdf, (accessed 12 July 2022).
- M. Pérez-Fortes, J. C. Schöneberger, A. Boulamanti and E. Tzimas, Appl. Energy, 2016, 161, 718–732 CrossRef.
- M. A. Adnan and M. G. Kibria, Appl. Energy, 2020, 278, 115614 CrossRef CAS.
- IEA, The Future of Hydrogen. Seizing today's opportunities, Assumptions Annex, Paris, 2019.
- H. S. Eggleston, L. Buendia, K. Miwa, T. Ngara and K. Tanabe, IPCC Guidelines for National Greenhouse Gas Inventories, Japan, 2006.
- A. Boulamanti and J. A. Moya, Renewable Sustainable Energy Rev., 2017, 68, 1205–1212 CrossRef CAS.
- Z. Zhao, J. Jiang and F. Wang, J. Energy Chem., 2021, 56, 193–202 CrossRef CAS.
- D. Xiang, Y. Qian, Y. Man and S. Yang, Appl. Energy, 2014, 113, 639–647 CrossRef CAS.
- J. Jiang, X. Feng, M. Yang and Y. Wang, J. Cleaner Prod., 2020, 277, 123525 CrossRef CAS.
- Z. Gholami, F. Gholami, Z. Tišler, M. Tomas and M. Vakili, Energies, 2021, 14, 1089 CrossRef CAS.
- OECD, Global Plastics Outlook, OECD Publishing, Paris, 2022 Search PubMed.
- C. Chung, J. Kim, B. K. Sovacool, S. Griffiths, M. Bazilian and M. Yang, Energy Res. Soc. Sci., 2023, 96, 102955 CrossRef.
- Material Economics, Industrial Transformation 2050 - Pathways to Net-Zero Emissions from EU Heavy Industry, 2019.
- C. Schneider and M. Saurat, Proceedings of the ECEEE Industrial Summer Study Industrial Efficiency 2020: Decarbonise industry!, 2020.
- A. Kätelhön, R. Meys, S. Deutz, S. Suh and A. Bardow, Proc. Natl. Acad. Sci. U. S. A., 2019, 116, 11187–11194 CrossRef PubMed.
- C. Zibunas, R. Meys, A. Kätelhön and A. Bardow, Comput. Chem. Eng., 2022, 162, 107798 CrossRef CAS.
- J. Huo, Z. Wang, C. Oberschelp, G. Guillén-Gosálbez and S. Hellweg, Green Chem., 2023, 25, 415–430 RSC.
- G. Luderer, S. Madeddu, L. Merfort, F. Ueckerdt, M. Pehl, R. Pietzcker, M. Rottoli, F. Schreyer, N. Bauer, L. Baumstark, C. Bertram, A. Dirnaichner, F. Humpenöder, A. Levesque, A. Popp, R. Rodrigues, J. Strefler and E. Kriegler, Nat. Energy, 2022, 7, 32–42 CrossRef.
- D. Bogdanov, M. Ram, A. Aghahosseini, A. Gulagi, A. S. Oyewo, M. Child, U. Caldera, K. Sadovskaia, J. Farfan, L. De Souza Noel Simas Barbosa, M. Fasihi, S. Khalili, T. Traber and C. Breyer, Energy, 2021, 227, 120467 CrossRef.
- IEA, World Energy Outlook 2021, Paris, 2021.
- D. Keiner, A. Gulagi and C. Breyer, Energy, 2023, 272, 127199 CrossRef.
- Ecoinvent, ecoinvent Verion 3.9 (2022) Database, https://v39.ecoquery.ecoinvent.org/Home/Index, (accessed 22 November 2022).
- International Energy Agency (IEA), Energy Statistics Data Browser, https://www.iea.org/data-and-statistics/data-tools/energy-statistics-data-browser?country=WORLD&fuel=Energysupply&indicator=TESbySource, (accessed 22 November 2022).
- DNV, Energy Transition Outlook 2022, Høvik, 2022.
- P. Gabrielli, M. Gazzani and M. Mazzotti, Ind. Eng. Chem. Res., 2020, 59, 7033–7045 CrossRef CAS.
- A. M. Bazzanella and F. Ausfelder, Low carbon energy and feedstock for the European chemical industry, Frankfurt, 2017.
- T. Galimova, M. Ram, D. Bogdanov, M. Fasihi, S. Khalili, A. Gulagi, H. Karjunen, T. N. O. Mensah and C. Breyer, J. Cleaner Prod., 2022, 373, 133920 CrossRef CAS.
- J. Mertens, C. Breyer, K. Arning, A. Bardow, R. Belmans, A. Dibenedetto, S. Erkman, J. Gripevoken, G. Leonard, S. Nizou, D. Pant, A. S. Reis-Macahdo, P. Styring, J. Vente, M. Webber and C. J. Sapart, Joule, 2023, 7, 1–8 CrossRef.
- M. Bertau, H. Offermanns, L. Plass, F. Schmidt and H.-J. Wernicke, Methanol: The basic chemical and energy feedstock of the future: Asinger's vision today, Springer, Berlin, Heidelberg, 1st edn, 2014 Search PubMed.
- M. L. Kliman, Energy, 1983, 8, 859–870 CrossRef.
- G. A. Olah, Angew. Chem., Int. Ed., 2005, 44, 2636–2639 CrossRef CAS PubMed.
- S. Ma, M. Sadakiyo, R. Luo, M. Heima, M. Yamauchi and P. J. A. Kenis, J. Power Sources, 2016, 301, 219–228 CrossRef CAS.
- A. Ozden, Y. Wang, F. Li, M. Luo, J. Sisler, A. Thevenon, A. Rosas-Hernández, T. Burdyny, Y. Lum, H. Yadegari, T. Agapie, J. C. Peters, E. H. Sargent and D. Sinton, Joule, 2021, 5, 706–719 CrossRef CAS.
- S. A. Chernyak, M. Corda, J.-P. Dath, V. V. Ordomsky and A. Y. Khodakov, Chem. Soc. Rev., 2022, 51, 7994–8044 RSC.
- K. Roh, A. Bardow, D. Bongartz, J. Burre, W. Chung, S. Deutz, D. Han, M. Heßelmann, Y. Kohlhaas, A. König, J. S. Lee, R. Meys, S. Völker, M. Wessling, J. H. Lee and A. Mitsos, Green Chem., 2020, 22, 3842–3859 RSC.
- Z. J. Schiffer, A. M. Limaye and K. Manthiram, Joule, 2021, 5, 135–148 CrossRef CAS.
- The Royal Society, Ammonia: zero-carbon fertiliser, fuel and energy store, 2020.
- E. R. Morgan, Techno-Economic Feasibility Study of Ammonia Plants Powered by Offshore Wind, University of Massachusetts Amherst, 2013.
- S. Banivaheb, S. Pitter, K. H. Delgado, M. Rubin, J. Sauer and R. Dittmeyer, Chem. Ing. Tech., 2022, 94, 240–255 CrossRef CAS.
- Power to Methanol Antwerp, Our Timeline, https://powertomethanolantwerp.com/story/#TIMELINE, (accessed 31 October 2022).
- Fortum, Significant next step in developing sustainable methanol for chemical industry, https://www.fortum.com/media/2022/07/significant-next-step-developing-sustainable-methanol-chemical-industry, (accessed 31 October 2022).
- Carbon Recycling International, World's Largest CO2-to-Methanol Plant Starts Production, https://www.carbonrecycling.is/news-media/worlds-largest-co2-to-methanol-plant-starts-production, (accessed 31 October 2022).
- M. Fasihi and C. Breyer, in 11th International Renewable Energy Storage Conference, Düsseldorf, 2017.
- M. Fasihi, O. Efimova and C. Breyer, J. Cleaner Prod., 2019, 224, 957–980 CrossRef CAS.
- T. Galimova, M. Ram, D. Bogdanov, M. Fasihi, S. Khalili, A. Gulagi, H. Karjunen, T. N. O. Mensah and C. Breyer, J. Cleaner Prod., 2022, 373, 133920 CrossRef CAS.
- C. Hank, S. Gelpke, A. Schnabl, R. J. White, J. Full, N. Wiebe, T. Smolinka, A. Schaadt, H.-M. Henning and C. Hebling, Sustainable Energy Fuels, 2018, 2, 1244–1261 RSC.
- M. J. Bos, S. R. A. Kersten and D. W. F. Brilman, Appl. Energy, 2020, 264, 114672 CrossRef CAS.
- K. Harris, R. G. Grim, Z. Huang and L. Tao, Appl. Energy, 2021, 303, 117637 CrossRef CAS.
- R. Rivera-Tinoco, M. Farran, C. Bouallou, F. Auprêtre, S. Valentin, P. Millet and J. R. Ngameni, Int. J. Hydrogen Energy, 2016, 41, 4546–4559 CrossRef CAS.
- B. Lee, H. Lee, D. Lim, B. Brigljević, W. Cho, H.-S. Cho, C.-H. Kim and H. Lim, Appl. Energy, 2020, 279, 115827 CrossRef CAS.
- N. Meunier, R. Chauvy, S. Mouhoubi, D. Thomas and G. De Weireld, Renewable Energy, 2020, 146, 1192–1203 CrossRef CAS.
- D. Bellotti, M. Rivarolo, L. Magistri and A. F. Massardo, J. CO2 Util., 2017, 21, 132–138 CrossRef CAS.
- D. S. Kourkoumpas, E. Papadimou, K. Atsonios, S. Karellas, P. Grammelis and E. Kakaras, Int. J. Hydrogen Energy, 2016, 41, 16674–16687 CrossRef CAS.
- A. Dindi, K. Coddington, J. F. Garofalo, W. Wu and H. Zhai, Environ. Sci. Technol., 2022, 56, 9872–9881 CrossRef CAS PubMed.
- Z. Zhao, K. Chong, J. Jiang, K. Wilson, X. Zhang and F. Wang, Renewable Sustainable Energy Rev., 2018, 97, 580–591 CrossRef CAS.
- M. Bertau, H. J. Wernicke, F. Schmidt, U.-D. Standt, F. Seyfried, S. Buchholz, G. Busch, M. Winterberg, L. Reichelt, C. Pätzold, S. Pohl, L. Plass, J. Roes, M. Steffen, G. Sandstede, A. Heinzel, S. Hippmann, D. Holtmann, F. Sonntag, T. Veith and J. Schrader, in Methanol: The Basic Chemical and Energy Feedstock of the Future: Asinger's Vision Today, ed. M. Bertau, H. Offermanns, L. Plass, F. Schmidt and H.-J. Wernicke, Springer Berlin Heidelberg, Berlin, Heidelberg, 2014, pp. 327–601 Search PubMed.
- M. Rosental, T. Fröhlich and A. Liebich, Front. Clim., 2020, 2, 586199 CrossRef.
- A. C. Dimian and C. S. Bildea, Chem. Eng. Res. Des., 2018, 131, 41–54 CrossRef CAS.
- D. Zhang, M. Yang and X. Feng, Comput. Chem. Eng., 2019, 126, 178–188 CrossRef CAS.
- S. Ren and X. Feng, Chin. J. Chem. Eng., 2022, 46, 134–141 CrossRef CAS.
- P. Bains, P. Psarras and J. Wilcox, Prog. Energy Combust. Sci., 2017, 63, 146–172 CrossRef.
- T. Galimova, M. Ram and C. Breyer, Energy Rep., 2022, 8, 14124–14143 CrossRef.
- P. Arora, A. F. A. Hoadley, S. M. Mahajani and A. Ganesh, J. Cleaner Prod., 2017, 148, 363–374 CrossRef CAS.
- Q. Weng, S. Toan, R. Ai, Z. Sun and Z. Sun, J. Cleaner Prod., 2021, 289, 125749 CrossRef CAS.
- E. Gençer, G. R. Burniske, O. C. Doering III, W. E. Tyner, R. Agrawal, W. N. Delgass, G. Ejeta, M. C. McCann and N. C. Carpita, Biofuels, Bioprod. Biorefin., 2020, 14, 725–733 CrossRef.
- N. S. Shamsul, S. K. Kamarudin, N. A. Rahman and N. T. Kofli, Renewable Sustainable Energy Rev., 2014, 33, 578–588 CrossRef CAS.
- O. Bazaluk, V. Havrysh, V. Nitsenko, T. Baležentis, D. Streimikiene and E. A. Tarkhanova, Energies, 2020, 13, 3113 CrossRef CAS.
- C. N. Hamelinck and A. P. C. Faaij, J. Power Sources, 2002, 111, 1–22 CrossRef CAS.
- F. Keller, R. P. Lee and B. Meyer, J. Cleaner Prod., 2020, 250, 119484 CrossRef CAS.
- C. Liptow, A.-M. Tillman and M. Janssen, Int. J. Life Cycle Assess., 2015, 20, 632–644 CrossRef CAS.
- I. Tsiropoulos, A. P. C. Faaij, L. Lundquist, U. Schenker, J. F. Briois and M. K. Patel, J. Cleaner Prod., 2015, 90, 114–127 CrossRef CAS.
- A. Maneffa, P. Priecel and J. A. Lopez-Sanchez, ChemSusChem, 2016, 9, 2736–2748 CrossRef CAS PubMed.
- J. S. Mahajan, R. M. O’Dea, J. B. Norris, L. T. J. Korley and T. H. I. I. I. Epps, ACS Sustain. Chem. Eng., 2020, 8, 15072–15096 CrossRef CAS.
- V. J. Margarit, E. M. Gallego, C. Paris, M. Boronat, M. Moliner and A. Corma, Green Chem., 2020, 22, 5123–5131 RSC.
- M. M. Bugge, T. Hansen and A. Klitkou, Sustainability, 2016, 8(7), 691 CrossRef.
- E. Smeets, M. Junginger, A. Faaij, A. Walter, P. Dolzan and W. Turkenburg, Biomass Bioenergy, 2008, 32, 781–813 CrossRef.
- F. Creutzig, N. H. Ravindranath, G. Berndes, S. Bolwig, R. Bright, F. Cherubini, H. Chum, E. Corbera, M. Delucchi, A. Faaij, J. Fargione, H. Haberl, G. Heath, O. Lucon, R. Plevin, A. Popp, C. Robledo-Abad, S. Rose, P. Smith, A. Stromman, S. Suh and O. Masera, GCB Bioenergy, 2015, 7, 916–944 CrossRef CAS.
- R. Volk, C. Stallkamp, J. J. Steins, S. P. Yogish, R. C. Müller, D. Stapf and F. Schultmann, J. Ind. Ecol., 2021, 25, 1318–1337 CrossRef.
- M. Stork, J. de Beer, N. Lintmeijer and B. den Ouden, Chemistry for Climate: Acting on the need for speed, Utrecht, 2018.
- M. Fasihi and C. Breyer, J. Cleaner Prod., 2020, 243, 118466 CrossRef.
- T. Aikawa, IEA Bioenergy Int. Work. Futur. Perspect. bioenergy Dev. Asia, 2018.
- International Energy Agency, World Energy Outlook 2022, Paris, 2022.
- E. Vartiainen, C. Breyer, D. Moser, E. Román Medina, C. Busto, G. Masson, E. Bosch and A. Jäger-Waldau, Sol. RRL, 2022, 6, 2100487 CrossRef.
- T. Nemecek and T. Kägi, Life Cycle Inventories of Agricultural Production Systems, 2007.
- H. Karjunen, E. Inkeri and T. Tynjälä, Energies, 2021, 14, 8518 CrossRef CAS.
- G. Lopez, J. Farfan and C. Breyer, J. Cleaner Prod., 2022, 375, 134182 CrossRef.
- E. Palm, L. J. Nilsson and M. Åhman, J. Cleaner Prod., 2016, 129, 548–555 CrossRef.
- C. Breyer, D. Bogdanov, M. Ram, S. Khalili, E. Vartiainen, D. Moser, E. R. Medina, G. Masson, A. Aghahosseini, T. N. O. Mensah, M. Schmela, R. Rossi, W. Hemetsberger and A. Jäger-Waldau, Prog. Photovoltaics, 2022, 1–27 Search PubMed.
- C. Breyer, S. Khalili, D. Bogdanov, M. Ram, A. S. Oyewo, A. Aghahosseini, A. Gulagi, A. A. Solomon, D. Keiner, G. Lopez, P. A. Østergaard, H. Lund, B. V. Mathiesen, M. Z. Jacobson, M. Victoria, S. Teske, T. Pregger, V. Fthenakis, M. Raugei, H. Holttinen, U. Bardi, A. Hoekstra and B. K. Sovacool, IEEE Access, 2022, 10, 78176–78218 Search PubMed.
- G. Zang, P. Sun, A. Elgowainy and M. Wang, Environ. Sci. Technol., 2021, 55, 5248–5257 CrossRef CAS PubMed.
- S. Khalili and C. Breyer, IEEE Access, 2022, 10, 125792–125834 Search PubMed.
- D. Bogdanov, A. Gulagi, M. Fasihi and C. Breyer, Appl. Energy, 2021, 283, 116273 CrossRef.
- M. Ram, D. Bogdanov, R. Satymov, G. Lopez, T. N. O. Mensah, K. Sadovskaia and C. Breyer, Accelerating the European renewable energy transition, Lappeenranta, Brussels, 2022.
- H. A. Daggash, C. F. Patzschke, C. F. Heuberger, L. Zhu, K. Hellgardt, P. S. Fennell, A. N. Bhave, A. Bardow and N. Mac Dowell, Sustainable Energy Fuels, 2018, 2, 1153–1169 RSC.
- H. Nieminen, A. Laari and T. Koiranen, Processes, 2019, 7, 405 CrossRef CAS.
- T. B. H. Nguyen and E. Zondervan, J. CO2 Util., 2019, 34, 1–11 CrossRef CAS.
- D. Abad, F. Vega, B. Navarrete, A. Delgado and E. Nieto, Int. J. Hydrogen Energy, 2021, 46, 34128–34147 CrossRef CAS.
- M. Sterner and M. Specht, Energies, 2021, 14, 6594 CrossRef CAS.
- M. J. Palys and P. Daoutidis, Comput. Chem. Eng., 2022, 165, 107948 CrossRef CAS.
- A. Poluzzi, G. Guandalini, S. Guffanti, M. Martinelli, S. Moioli, P. Huttenhuis, G. Rexwinkel, J. Palonen, E. Martelli, G. Groppi and M. C. Romano, Front. Energy Res., 2022, 9, 795673 CrossRef.
- Y. Liu, G. Li, Z. Chen, Y. Shen, H. Zhang, S. Wang, J. Qi, Z. Zhu, Y. Wang and J. Gao, Energy, 2020, 204, 117961 CrossRef CAS.
- P. Gautam, S. N. Upadhyay and S. K. Dubey, Fuel, 2020, 273, 117783 CrossRef CAS.
- J. Andersson and J. Lundgren, Appl. Energy, 2014, 130, 484–490 CrossRef CAS.
- D. Flórez-Orrego, F. Maréchal and S. de Oliveira Junior, Energy Convers. Manag., 2019, 194, 22–36 CrossRef.
- A. Dutta, I. A. Karimi and S. Farooq, Ind. Eng. Chem. Res., 2019, 58, 963–972 CrossRef CAS.
- H. R. Omran, S. M. EL-Marsafy, F. H. Ashour and E. F. Abadir, Egypt. J. Pet., 2017, 26, 855–863 CrossRef.
- M. Fasihi, D. Bogdanov and C. Breyer, Energy Procedia, 2016, 99, 243–268 CrossRef CAS.
- C. Breyer, M. Fasihi, C. Bajamundi and F. Creutzig, Joule, 2019, 3, 2053–2057 CrossRef.
- J. Farfan, M. Fasihi and C. Breyer, J. Cleaner Prod., 2019, 217, 821–835 CrossRef CAS.
- S. Maia and L. Demôro, Power Transition Trends 2022, 2022.
- D. Fickling, The Supply Chain to Beat Climate Change Is Already Being Built, https://www.bloomberg.com/opinion/articles/2022-09-06/solar-industry-supply-chain-that-will-beat-climate-change-is-already-being-built?leadSource=uverifywall, (accessed 28 November 2022).
- N. M. Haegel, H. Atwater, T. Barnes, C. Breyer, A. Burrell, Y.-M. Chiang, S. De Wolf, B. Dimmler, D. Feldman, S. Glunz, J. C. Goldschmidt, D. Hochschild, R. Inzunza, I. Kaizuka, B. Kroposki, S. Kurtz, S. Leu, R. Margolis, K. Matsubara, A. Metz, W. K. Metzger, M. Morjaria, S. Niki, S. Nowak, I. M. Peters, S. Philipps, T. Reindl, A. Richter, D. Rose, K. Sakurai, R. Schlatmann, M. Shikano, W. Sinke, R. Sinton, B. J. Stanbery, M. Topic, W. Tumas, Y. Ueda, J. van de Lagemaat, P. Verlinden, M. Vetter, E. Warren, M. Werner, M. Yamaguchi and A. W. Bett, Science, 2019, 364, 836–838 CrossRef CAS PubMed.
- M. Victoria, N. Haegel, I. M. Peters, R. Sinton, A. Jäger-Waldau, C. del Cañizo, C. Breyer, M. Stocks, A. Blakers, I. Kaizuka, K. Komoto and A. Smets, Joule, 2021, 5, 1041–1056 CrossRef CAS.
- P. J. Verlinden, J. Renewable Sustainable Energy, 2020, 12, 53505 CrossRef.
- J. Singh Jadaun, S. Bansal, A. Sonthalia, A. K. Rai and S. P. Singh, Bioresour. Technol., 2022, 347, 126697 CrossRef CAS PubMed.
- L. Leppäkoski, G. Lopez, V. Uusitalo, H. Nieminen, N. Järviö, A. Kosonen, T. Koiranen, A. Laari, C. Breyer and J. Ahola, Sci. Total Environ., 2023, 882, 163628 CrossRef PubMed.
- S. Kubowicz and A. M. Booth, Environ. Sci. Technol., 2017, 51, 12058–12060 CrossRef CAS PubMed.
- A. Devlin and A. Yang, Energy Convers. Manag., 2022, 254, 115268 CrossRef CAS.
- H. Trollip, B. McCall and C. Bataille, Clim. Policy, 2022, 22, 236–247 CrossRef.
- G. Lopez, T. Galimova, M. Fasihi, D. Bogdanov and C. Breyer, Energy, 2023, 273, 127236 CrossRef.
Footnote |
| † Electronic supplementary information (ESI) available. See DOI: https://doi.org/10.1039/d3ee00478c |
| This journal is © The Royal Society of Chemistry 2023 |

