 Open Access Article
Development and assessment of speed-up algorithms for the reactive CFD–DEM simulation of fluidized bed reactors†
Riccardo
Uglietti
 ,
Mauro
Bracconi
 and
Matteo
Maestri
 *
*
Laboratory of Catalysis and Catalytic Processes, Dipartimento di Energia, Politecnico di Milano, via La Masa 34, 20156 Milano, Italy. E-mail: matteo.maestri@polimi.it
First published on 24th December 2019
Abstract
In this work, we propose a particle agglomeration (PA) speed-up algorithm to reduce the computational cost of the CFD–DEM framework based on the coupled solution (CP) of the gas–solid transport and heterogeneous reaction at the level of each particle in a fluidized bed reactor. The performances of PA are assessed and compared with the ones provided by the previously proposed operator-splitting (OS) and in situ adaptive tabulation (ISAT) speed-up algorithm. The analysis is carried out on methanation and steam reforming systems to investigate different reactions and transport characteristic times under different operating conditions. The results revealed that OS & ISAT is generally computationally more efficient by providing a higher chemical speed-up than CP & PA both in methanation (15 vs. 6) and steam reforming (13 vs. 4). However, OS requires a smaller simulation time step with respect to the CP to achieve convergent results when fast transport/reaction phenomena are considered. Hence, the overall computational cost might be even larger with respect to the CP despite the ISAT technique. Consequently, the selection of the best performing algorithm is not trivial and strongly depends on the characteristic times of transport and reaction which are a function of the local conditions experienced in the bed. Thus, we propose a strategy to select the most adequate algorithm (i.e., CP & PA or OS & ISAT). The strategy is based on the simulation of a test reactor characterized by a small computational cost but conceived to be representative of the chemical and fluid dynamic behavior of the target reactor. This enabled the simulation of a million particle methanation reactor experimentally investigated in the literature. A good agreement between simulation and experimental outlet concentrations (error up to 7% for the main species) is observed along with a significant 20-fold chemical speed-up.
Introduction
Fluidized bed technology is of great interest in the context of important catalytic processes, e.g. methanation1–3 or methanol-to-olefin.4,5 The description of the complex multiphase fluid dynamics coupled with reactivity is a crucial task for gaining detailed insights into the system behavior6–8 and eventually for designing fluidized systems.9 In particular, reactive CFD–DEM is usually applied to track a few thousands of reactive particles in fluidized beds in the order of 105 inert sand particles in the context of char combustion10 or biomass gasification.11 In the case of catalytic processes, all the particles are catalytically active, and a computational cell basis for the evaluation of the catalytic chemistry is mandatory.12 To overcome such a limitation, in our previous work, we proposed a reactive numerical framework,13 based on a computational fluid dynamics–discrete element method (CFD–DEM) algorithm,14,15 able to couple the catalytic reactions at the active sites with the Lagrangian tracking of each particle in the fluidized system along with the solution of Navier–Stokes and transport equations at the reactor scale. However, the application of CFD–DEM to dense lab scale catalytic reactors (usually in the order of 106 particles) is strongly hampered by the computational cost related to the chemistry. In this respect, we implemented an in situ tabulation speed-up technique13,16,17 (ISAT) to reduce the number of required ODE integrations. In particular, we first implemented the solution of the species and energy balances in each particle by means of the operator-splitting18,19 (OS) approach. By doing so, the chemistry and gas–particle transport phenomena were solved separately, within a time step for each particle in the system, enabling the efficient application of ISAT to the chemistry solution, and the analytical solution of the interphase transport phenomena.13 The combined OS & ISAT speed-up algorithm showed relevant speed-up factors up to 12 in a reactor of 104 particles. However, the accuracy19 and the speed-up13 provided by the algorithm are dependent on the minimum time step used to split gas–particle transport and reactions. This was found to affect the maximum allowed simulation time step depending on the characteristic times of gas-particle transport and catalytic reactions. In the case that this maximum time step of splitting is very small, the computational cost of the simulation becomes the limiting factor.In this work, we propose a numerical framework based on the coupled solution of transport and reaction terms (i.e. coupled approach, CP). In fact, by accounting the reaction and the transport at the same time, this method can be a valuable alternative when OS becomes too limiting in the selection of the maximum time-step. Moreover, to tackle the computational burden in the CP approach, we propose a particle agglomeration (PA) speed-up technique based on cell agglomeration (CA).20–22 According to this speed-up algorithm, similar particles along the fluidized bed are binned at each time step in computational parcels. The parcels are solved by means of the integration of the ODE system describing transport and reactions coupled, and the results of the parcel are finally mapped back to the underlying particles. As a result, the number of ODE integrations are reduced with a consequent beneficial effect on the computational time.
To assess the performance of the CP & PA speed-up algorithm with respect to the previously proposed OS & ISAT, we applied the two algorithms to the reactive CFD–DEM framework13 under different operating conditions. The CP & PA algorithm has provided a very good accuracy and a relevant speed-up under the investigated conditions. However, when the selection of the maximum time step turned out not to be limiting, the OS & ISAT algorithm has provided higher speed-up factors.
The selection between the two procedures cannot be performed a priori, especially when complex mixtures are present. As such, we propose a methodology for selecting the best algorithm for different cases. First, a small test reactor is considered and employed to identify the best performing algorithm and to achieve an optimal selection of the parameters of the speed-up technique. Then, the resulting optimal algorithm is employed for the simulation of the target reactor, where the same numerical tests are very computationally demanding or even not sustainable.
Thanks to this procedure, we were able to simulate the 1.2 million Geldart A particle methanation reactor, experimentally investigated in the literature by Li and Yang.23 The results have shown good agreement between the predicted outlet compositions of the reactor and the experimental data (error up to 7% for the main species) with a 20-fold speed-up factor.
All in all, these methods make it possible to simulate fluidized bed with a particle resolved description of the chemistry and with the number of particles in the order of 106. The possibility of accounting for the chemical phenomena at the particle level with such a number of particles paves the way towards the hierarchical refinement24 of Euler–Euler models for the simulation of devices of technical relevance.
Coupled & particle agglomeration speed-up algorithm
The governing equations are reported in the ESI† – section 1. They consist of gas-phase and particle mass and energy conservation equations and the Navier–Stokes equations. These equations are sequentially solved for a given time step. Within the time step, the reaction and transport operators in the mass and energy equations at the particle can either be treated by means of operator-splitting (OS) or by means of a coupled approach (CP) – the two operators are simultaneously accounted for in the numerical solution. In our previous work, we presented and assessed the OS approach with the ISAT technique to speed-up the simulation. Here, instead, we propose and assess a particle agglomeration (PA) algorithm for the speed-up of the numerical solution of the ODE system within the CP approach.PA is a runtime classification technique, based on the cell agglomeration (CA) algorithm,22 aimed at decreasing the computational cost through the reductions of ODE integrations by agglomerating similar particles along the fluidized bed. According to PA, an index (iPA) is computed at each time step for each particle in the domain. This index is a measure of the similarity among the particles in terms of characteristic variables, i.e., composition, coverages, temperature and the Reynolds number of the particle. The gas thermo-chemical and fluid dynamic states are also considered in the index formula for PA, since they are key factors in the quantification of gas–solid transfer rates. Then, the particles characterized by the same index are grouped into a computational parcel which is integrated by the ODE solver. Finally, the result of the parcel is used to update all the particles that belong to that parcel.
The index iPA is computed as follows:
 | (1) |
The normalized variables ϕi are computed as follows:
 | (2) |
Once the parcels are generated by means of eqn (1)–(2), the properties of each parcel are computed as the arithmetic average of the properties of the particles in the bin. Then, the parcel is integrated, and the results are mapped back to each particle by means of the following formula:22
| yfi,p = y0i,p + (yfi,b − y0i,b) | (3) |
Procedure for the selection of the test reactor
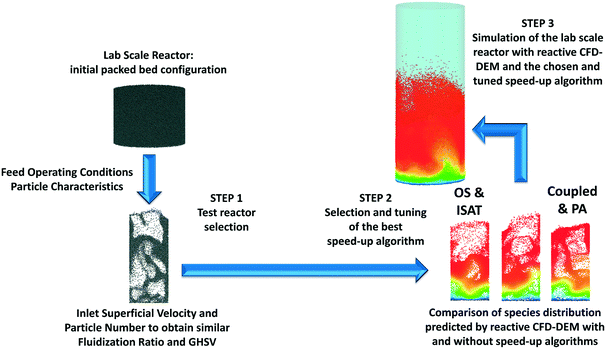
The selection of the two procedures (i.e., OS & ISAT and CP &PA) is not always obvious, especially when several species are present with significantly different diffusion properties. Here, we propose a methodology for selecting the best algorithm and for tuning its parameters. As shown in Fig. 1, a small test reactor – which retains the features of the target reactor – is considered and employed to identify the most adequate algorithm and to optimally tune the parameters of the speed-up technique. In particular, once the test reactor is selected (step 1), CP & PA and OS & ISAT are assessed by using this test reactor and for the process under investigation, thus avoiding the simulation of the massive number of particle reactor. By means of this step, the choice of the best performing speed-up algorithm and the tuning of its appropriate tolerance are carried out (step 2). Finally, the simulation of the lab scale reactor is performed adopting the selected and properly tuned speed-up algorithm (step 3).Crucial for the reliability of the procedure is the selection of the test reactor. The geometry of both the test bed and particles has to be carefully set to reproduce the target reactor behavior. Moreover, the inlet composition and temperature along with the inlet superficial velocity must be imposed to be representative of the target reactor. In doing so, it is crucial to ensure that the test reactor shows the same chemical and interphase transport phenomena occurring in the target reactor. In particular, the geometry of the bed can be the same shape of either the lab scale reactor or a pseudo-2D parallelepipedal reactor, typically used in the literature for the numerical investigation of small fluidized beds.25–27 The ratio between the height and width of the test reactor must be chosen to avoid the occurrence of slugging behavior.28 The mechanical characteristics of the particles must be the same as the ones used in the target reactor since they affect the fluidization behavior of the bed.29 The temperature and composition of the target reactor are adopted, since they lead to the similar characteristic times for both the interphase species mass transfer and catalytic reactions. The inlet superficial velocity and the number of particles in the bed (and, in turn, the height of the bed) are finally selected to achieve fluid dynamic and chemical similarities with respect to the target reactor. The fluid dynamic similarity is obtained by comparing the fluidization ratio of the two reactors, defined as the ratio between the adopted inlet superficial velocity and the minimum fluidization. The chemical similarity is achieved by assuring a comparable gas-hourly-space-velocity (GHSV) in the test and target reactors. Both fluid-dynamics and GHSV are affected by the number of particles. Thus, a trade-off between the two constraints must be achieved, and it can be reached by using a maximum ratio of 2 between the GHSV of the two reactors and between the fluidization ratio of the two reactors to assure an adequate similarity between the test and lab scale reactors.
Computational domains and numerical settings
We focus our analysis on the methanation million-particle fluidized bed reported by Li and Yang,23 that we use as a showcase in this work (target reactor). In this section, we present the numerical details of the test reactor and of the target reactor used for the analysis.Million-particle lab scale reactor (target reactor)
The target reactor is characterized by a cylindrical geometry with a diameter of 1.5 cm and a height of 9 cm, as shown in Fig. 2. The bed consists of 1.2 million particles, which are initially packed at the bottom of the reactor. The geometrical and mechanical characteristics of the particles are reported in Table 1.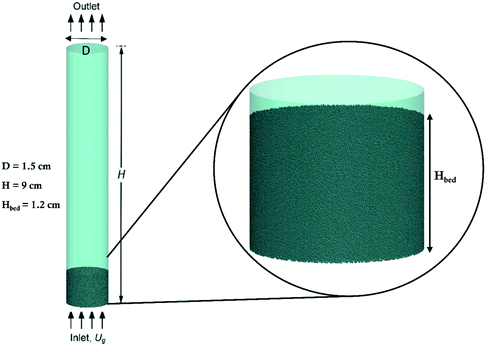 | ||
| Fig. 2 Cylindrical reactor employed for the simulation of the lab scale reactor and packed bed configuration adopted as a starting point for the reactive simulations of the methanation lab scale reactor reported by Li and Yang.23 | ||
| Geometrical properties | |
|---|---|
| Particle diameter DP [μm] | 125 |
| Particle density ρP [kg m−3] | 1684 |
| Particle number NP [−] | 1![[thin space (1/6-em)]](https://www.rsc.org/images/entities/char_2009.gif) 244 244![[thin space (1/6-em)]](https://www.rsc.org/images/entities/char_2009.gif) 130 130 |
| Mechanical properties | |
|---|---|
| Young modulus E [Pa] | 106 |
| Poisson ratio ν [−] | 0.3 |
| Restitution coefficient e [−] | 0.8 |
| Friction factor μ [−] | 0.3 |
The following numerical settings have been adopted for the simulation of the catalytic process. An atmospheric pressure has been imposed at the top of the reactor, while a zero-gradient condition has been assumed for the lateral walls and for the bottom (i.e., inlet). At the bottom of the reactor, three superficial velocities equal to 0.162, 0.270 and 0.323 m s−1 have been investigated. A no-slip condition has been imposed for the lateral walls of the cylinder. The temperature and composition of the gas phase have been imposed at the inlet of the reactor equal to the operating conditions of the inlet feed stream. A zero-gradient condition has been imposed on the remaining boundaries. The simulations are carried out under isothermal conditions. The computational grid has been generated ensuring a minimum cell-to-particle-diameter ratio equal to 3.30 Additional information on the mesh and on the numerical schemes is reported in the ESI† – section 2.
Test reactor
The pseudo-2D parallelepiped geometry employed in our previous work13 has been chosen. Its dimensions have been adapted to obtain the reactor configuration (i.e. 6 mm width, 3 cm height and 500 μm depth) containing 104 particles with the same mechanical properties reported in Table 1. The number of particles is equal to the one simulated in our previous work, which provided representative fluidization behaviors of the bed and an affordable computational time. Thus, the inlet superficial velocity has been selected to be equal to 0.152 m s−1 in order to keep a maximum ratio of 2 between the fluidization ratio and the GHSV of the two reactors, as reported in Table 2, for the case of the superficial velocity equal to 0.162 m s−1 assumed to be representative of all the investigated conditions. Finally, the same composition and temperature adopted in the million-particle reactor have been used. The simulations are carried out under isothermal conditions. Additional information on the mesh and on the numerical schemes is reported in the ESI† – section 2.| Test reactor | Lab scale reactor | |
|---|---|---|
| Fluidization ratio [−] | 20 | 40 |
| GHSV [1/h] | 70![[thin space (1/6-em)]](https://www.rsc.org/images/entities/char_2009.gif) 728 728 |
40![[thin space (1/6-em)]](https://www.rsc.org/images/entities/char_2009.gif) 416 416 |
Average quantities, error estimation and speed-up calculation
The average composition of the bed 〈ω〉 as a function of the simulation time has been selected as the reference variable representative of the reactor behavior:13,25,26 | (4) |
The accuracy has been assessed by means of the evaluation of the mean global error:17
 | (5) |
 | (6) |
The speed-up of the solution of the catalytic particles, i.e., the chemical speed-up factor (SPC), has been computed to measure the computational gain provided by each speed-up algorithm:
 | (7) |
Results and discussion
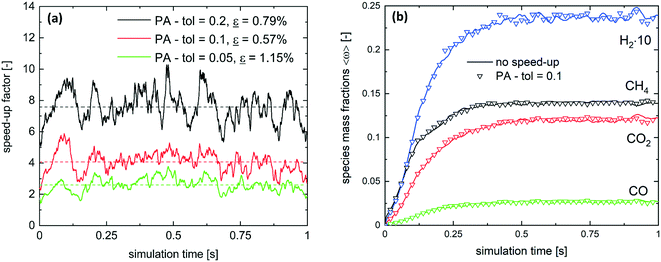
Here, we first present the assessment of the performance of CP & PA and OS & ISAT in the test reactor configuration for two different processes, i.e., methanation and steam reforming. The assessment is performed in terms of both accuracy and speed-up. The operating conditions are reported in Tables 3 and 5. The test reactor for the methanation process for the simulation of the target reactor reported by Li and Yang23 has been described in the previous section. For the case of steam reforming, we have considered the same reactor geometry, particle dimensions and number of particles as well as isothermal conditions of the test reactor for the methanation case. Moreover, the inlet velocity has been set equal to 0.128 m s−1 to obtain the same fluidization ratio of the methanation test reactor under the operating conditions selected for the methane steam reforming process (Table 5).| Methanation | |
|---|---|
| Temperature [K] | 673.15 |
| Pressure [bar] | 1.01325 |
| Inlet mole fractions [−] | |
| Carbon monoxide | 0.2 |
| Hydrogen | 0.6 |
| Argon | 0.2 |
Then, the simulation of the target reactor (lab-scale reactor with 106 particles) in the case of the methanation process is performed by employing the algorithm and the parameter obtained and optimized at the test reactor level. The accuracy of the CFD–DEM and the computational gain in this system characterized by such a massive number of particles are assessed and quantified with respect to the experimental data from the literature.23
Analysis of the speed-up algorithms in the test reactor
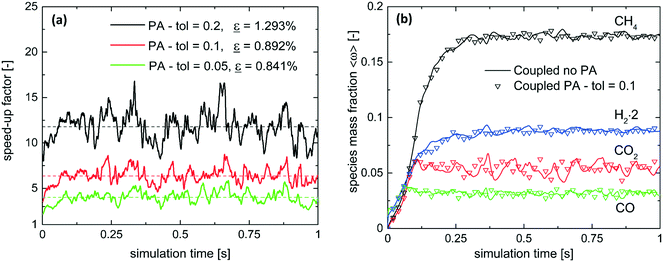
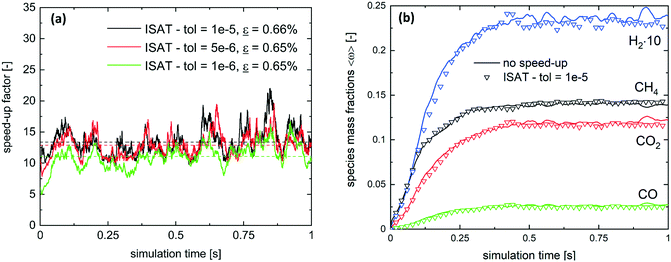
Fig. 3b shows the average composition of the bed as a function of the simulation time for the main species involved in the process obtained with the coupled algorithm with and without the PA speed-up technique. The comparison of the results makes it evident that the excellent temporal averaged error corresponds to a good agreement between the simulations with and without the speed-up algorithm at each time step (maximum mean global error ε equal to 2.49%), thus proving the accuracy provided by the algorithm both during the dynamics and the pseudo-steady state regime of the process.
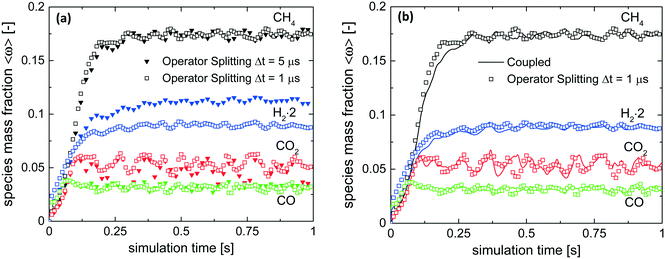
Fig. 4a shows the comparison of the average composition of the bed as a function of the simulation time for the main species involved in the process. The time step has a strong effect on the predictions of the species. We found that a time step equal to 1 μs is capable of providing a solution which is independent of the time discretization. In contrast, a time step equal to 5 μs, i.e. the same employed in the case of CP & PA, provides inaccurate results since an overestimation of the hydrogen content in the order of 15% is observed, as shown in Fig. 4a. In this case, a violation of the atomic balances is observed due to the misprediction of the hydrogen concentration. The reason of the deviation is ascribed to the OS algorithm which accounts for the competitive and simultaneous transport and reaction phenomena in separate terms. To guarantee the convergence to the solution, it is necessary that the simulation time step is lower than the characteristic time of the transport of the species.
To better clarify this issue, we have computed the characteristic times of the gas–particle transport of all the reactive species involved in the process according to eqn (8):31
 | (8) |
| τ min [μs] | τ average [μs] | τ max [μs] | τ max [μs] | |
|---|---|---|---|---|
| CH4 | 7.18 | 9.77 | 11.8 | 11.8 |
| H2 | 3.33 | 3.84 | 4.10 | 4.10 |
| CO | 7.59 | 10.5 | 12.8 | 12.8 |
| CO2 | 9.20 | 12.9 | 16.1 | 16.1 |
| H2O | 6.08 | 8.61 | 10.5 | 10.5 |
However, the smaller time step required by the OS dramatically increases the number of time steps necessary to simulate the same real time resulting in an additional computational burden. To improve the computational efficiency, we assessed the effect of the ISAT technique in reducing the simulation computational cost.13 The performance of the ISAT speed-up technique has been tested by considering different tolerances. In particular, three values equal to 1 × 10⁻⁵, 5 × 10⁻⁶, and 1 × 10⁻⁶ have been employed. ISAT boosts the simulation by reducing the computational burden of the chemical sub-step. An average chemical speed-up equal to 15.5, 14.9 and 9.0, respectively, has been found resulting in an overall simulation speed-up17 in the order of 5.5, 5.4 and 4.5, respectively. The simulation speed-up provided by ISAT is able to only partially recover the additional cost due to the reduced time step. However, the overall computational cost of the OS & ISAT method is similar to the one of the sole CP algorithm. Hence, the overall performance of the OS & ISAT is worse with respect to the CP & PA method for these operating conditions.
| Methane steam reforming | |
|---|---|
| Temperature [K] | 1048.15 |
| Pressure [bar] | 29 |
| Inlet mass fractions [−] | |
| Methane | 0.1911 |
| Steam | 0.7218 |
| Carbon monoxide | 0.0001 |
| Carbon dioxide | 0.0200 |
| Hydrogen | 0.0029 |
| Nitrogen | 0.0641 |
| τ min [μs] | τ average [μs] | τ max [μs] | |
|---|---|---|---|
| CH4 | 79 | 119 | 160 |
| H2 | 31 | 43 | 54 |
| CO | 83 | 140 | 160 |
| CO2 | 99 | 176 | 189 |
| H2O | 77 | 125 | 127 |
As a whole, the analysis revealed that different speed-up strategies may have different performances even in similar reacting environments elucidating the importance of the selection of the most adequate algorithm for the efficient simulation of reactors characterized by a large number of particles.
Simulation of the million particle reactor: methanation
The results of the analysis of the test reactor enabled us to properly define both the numerical algorithm and the parameters to carry out a numerical simulation of a lab scale reactor. The selection of the best performing speed-up algorithm and its tuning is key to enable the simulations of million particle reactors whose computational cost would be unaffordable without any speed-up technique. Thus, we employed the algorithm and the optimal parameters obtained in the analysis of the test reactor. Thus, the methanation lab scale reactor (“the target reactor”) experimentally investigated by Li and Yang23 has been simulated by means of the CP & PA algorithm, which has been the most effective for this specific process.The kinetics proposed by Li and Yang23 (already used for the assessment of the algorithms in the test reactor) have been adopted, since it has been validated against the experimental data23 for the operating conditions investigated in this study.
The operating conditions employed in the experiments have been adopted (see Table 3). Three different inlet velocities equal to 0.162, 0.270 and 0.323 m s−1 have been selected to investigate the effect of different fluid dynamic conditions.
The following procedure has been followed to perform the simulation of the reactor. First, the packed bed configuration (Fig. 2) has been generated by injecting the particles from the top of the reactor and allowing them to settle. A particle flow rate of 8 × 10⁶ particles per second was employed. Then, the system has been fluidized by using an inert stream of Argon at 673.15 K injected from the bottom with a velocity of 0.162 m s−1. Once a steady fluidization is achieved, the syngas has been fed from the bottom, and the reactor has been simulated until a pseudo-steady state of the process has been achieved, i.e. reproducing a real time higher than 8 times the residence time in the bed. Then, the value of the relevant quantities, i.e. pressure drops and concentrations, has been evaluated by temporal averaging the last two residence times. The other simulations have been carried out starting from the pseudo-steady state results at 0.162 m s−1 by changing the inlet velocity value.
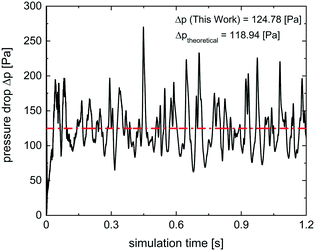
First, we assessed the fluid dynamic predictions of the reactive CFD–DEM framework by observing the temporal trend of the pressure drops inside the reactor. Fig. 7 shows the pressure profile which is characterized by an oscillating behavior caused by the expansion and contraction behavior of the fluidized bed as usually observed in fluidized bed reactors. The temporal average of the pressure drops is in excellent agreement (deviation below 5%) with the theoretical value obtained as the ratio between the weight of the bed divided by the cross-sectional area of the reactor.
Then, the accuracy has been assessed by a comparison of the outlet composition measured in the experiments with the one evaluated in the simulation. The reactor outlet composition has been evaluated at each time step by means of the cup-mix average over a section at a height of 4 cm from the bottom, i.e. slightly above the end of the expanded bed.
Fig. 8 shows a parity plot between the concentrations measured in the experiments23 and the results of numerical simulations for all the investigated flow velocities. The results show a good agreement with the experiments, since all the species are within the experimental confidence interval (±5% for the main species and ±10% for CO2). These results confirm the accuracy of the CFD–DEM framework and of the CP & PA algorithm for the simulation of catalytic processes in fluidized bed reactors.
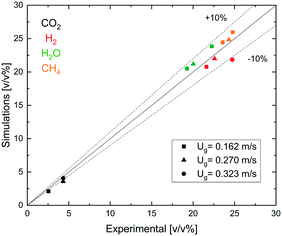 | ||
| Fig. 8 Parity plot comparing the numerical results with the experimental data by Li and Yang23 for the outlet reactor compositions predicted with the reactive CFD–DEM framework and the CP & PA speed-up algorithm proposed in this work at 0.162 m s−1 (square), 0.270 (triangle) m s−1 and 0.323 (circle) m s−1 inlet velocities. | ||
Finally, the computational gain offered by the CP & PA speed-up algorithm in the case of the million-particle reactor has been computed. The entire simulation without any speed-up technique is unfeasible due to the computational cost. Hence, the evaluation of the computational gain is not carried out along the entire simulation but locally every 0.2 s according to the following procedure. Two time steps have been simulated with and without the speed-up algorithm, starting from the results obtained by means of CP & PA. Then, the ratio between the computational times required by the reactive CFD–DEM framework with and without the speed-up technique has been computed to evaluate the speed-up factor according to eqn (7). Fig. 9 shows the evolution of the chemical speed-up factor during the simulation. A chemical speed-up-factor up to 27 and an average value around 20 has been quantified, corresponding to a significant computational gain for the entire simulation.
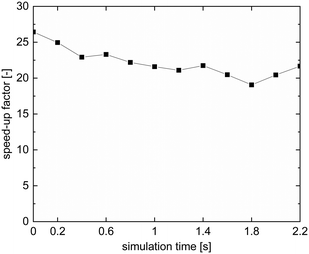 | ||
| Fig. 9 Trend of the chemical speed-up factor provided by the CP & PA algorithm as a function of the simulation time in the case of the methanation million particle reactor. | ||
Conclusions
A speed-up algorithm based on the coupled ODE integration of the gas–particle transfer and catalytic chemistry (CP) and the PA speed-up technique (i.e. CP & PA) has been implemented in the existing CFD–DEM framework and compared to the operator-splitting & ISAT algorithm developed in our previous work.13 Then, a comparison between the performance of CP & PA and OS & ISAT has been carried out in a test reactor for both a methanation and a steam reforming system.The analysis revealed that the OS algorithm requires a careful definition of the simulation time step which has to be lower than the minimum characteristic time of transport phenomena to achieve a converged solution. In contrast, the CP algorithm partially overcomes this limitation due to the simultaneous accounting for both the reaction and the transport. At the same time the performances of the speed-up techniques are different. The ISAT generally outperforms the PA providing usually higher computational gain. In this view, the selection of the approach, i.e., CP & PA or OS & ISAT, turned out to be strongly dependent from the system and the operating conditions investigated. Hence, the analysis carried out on the test reactor enables the assessment of the different approaches along with the tuning of the algorithm parameters.
The results of this analysis in the test reactor for the methanation system enabled the selection of the approach (i.e., CP & PA) and optimized the algorithm tolerance. The results have proven the capability of the framework with the speed-up strategies of simulating millions of bed particles. In particular, a good agreement with the experimental data (error up to 7% for the main species) is obtained along with a 20-fold chemical speed-up factor, which translates into significant reduction of the computational cost related to the solution of the heterogeneous chemistry which now turns to be comparable with the cost of the particle tracking.
As a whole, the application of the reactive CFD–DEM framework by means of speed-up algorithms has been effective both in small test fluidized beds and in massive number of particle lab scale reactors, thus, enabling both the fundamental investigation of lab scale reactors and their efficient simulation in the context of a hierarchical analysis of fluidized systems.
Conflicts of interest
There are no conflicts to declare.Acknowledgements
The project leading to this work has received funding from the European Research Council (ERC) under the European Union's Horizon 2020 research and innovation programme (Project SHAPE - grant agreement No. 677423). Computational time at CINECA, Bologna (Italy) is gratefully acknowledged.References
- J. Li, H. Wang, Q. Zhu and H. Li, Chem. Eng. J., 2019, 357, 298–308 CrossRef CAS.
- L. Sun, K. Luo and J. Fan, Catal. Commun., 2018, 105, 37–42 CrossRef CAS.
- J. Liu, D. Cui, C. Yao, J. Yu, F. Su and G. Xu, Fuel Process. Technol., 2016, 141, 130–137 CrossRef CAS.
- S. Xu, Y. Zhi, J. Han, W. Zhang, X. Wu, T. Sun, Y. Wei and Z. Liu, Advances in Catalysis for Methanol-to-Olefins Conversion, Elsevier Inc., 1st edn., 2017, vol. 61 Search PubMed.
- P. Tian, Y. Wei, M. Ye and Z. Liu, ACS Catal., 2015, 5, 1922–1938 CrossRef CAS.
- N. Jurtz, M. Kraume and G. D. Wehinger, Rev. Chem. Eng., 2019, 35, 139–190 Search PubMed.
- B. Partopour and A. G. Dixon, Ind. Eng. Chem. Res., 2019, 58, 5733–5736 CrossRef CAS.
- M. Maestri, Chem. Commun., 2017, 53, 10244–10254 RSC.
- M. P. Dudukovic, Science, 2009, 325, 698–701 CrossRef CAS PubMed.
- Y. Zhuang, X. Chen, D. Liu and C. Bu, in Clean Coal Technology and Sustainable Development. ISCC 2015, Springer, 2016 Search PubMed.
- S. Yang, H. Wang, Y. Wei, J. Hu and J. W. Chew, Energy Convers. Manage., 2019, 196, 1–17 CrossRef CAS.
- D. M. Snider, S. M. Clark and P. J. O'Rourke, Chem. Eng. Sci., 2011, 66, 1285–1295 CrossRef CAS.
- R. Uglietti, M. Bracconi and M. Maestri, React. Chem. Eng., 2018, 3, 527–539 RSC.
- Y. Tsuji, T. Kawaguchi and T. Tanaka, Powder Technol., 1993, 77, 79–87 CrossRef CAS.
- B. H. Xu and A. B. Yu, Chem. Eng. Sci., 1997, 52, 2785–2809 CrossRef CAS.
- S. B. Pope, Combust. Theory Modell., 1997, 1, 41–63 CrossRef CAS.
- M. Bracconi, M. Maestri and A. Cuoci, AIChE J., 2017, 63, 95–104 CrossRef CAS.
- G. Strang, SIAM J. Numer. Anal., 1968, 5, 506–517 CrossRef.
- Z. Ren and S. B. Pope, J. Comput. Phys., 2008, 227, 8165–8176 CrossRef CAS.
- G. M. Goldin, Z. Ren and S. Zahirovic, Combust. Theory Modell., 2009, 13, 721–739 CrossRef.
- L. Zhou, L. Zhong, W. Qin, W. Zhao and H. Wei, Fuel, 2018, 234, 1313–1321 CrossRef CAS.
- S. Rebughini, A. Cuoci, A. G. Dixon and M. Maestri, Comput. Chem. Eng., 2017, 97, 175–182 CrossRef CAS.
- J. Li and B. Yang, AIChE J., 2019, 65, 1–15 CrossRef.
- S. Rebughini, M. Bracconi, A. G. Dixon and M. Maestri, React. Chem. Eng., 2018, 3, 25–33 RSC.
- Q.-F. Hou, Z.-Y. Zhou and A.-B. Yu, Ind. Eng. Chem. Res., 2012, 51, 11572–11586 CrossRef CAS.
- M. J. V. Goldschmidt, R. Beetstra and J. A. M. Kuipers, Powder Technol., 2004, 142, 23–47 CrossRef CAS.
- J. Li, R. K. Agarwal, L. Zhou and B. Yang, Chem. Eng. Sci., 2019, 207, 100031 Search PubMed.
- D. Kunii and O. Levenspiel, Fluidization engineering, Butterworth-Heinemann, 1991 Search PubMed.
- D. Geldart, Powder Technol., 1973, 7, 285–292 CrossRef CAS.
- Z. Peng, E. Doroodchi, C. Luo and B. Moghtaderi, AIChE J., 2014, 60, 2000–2018 CrossRef CAS.
- X. Gao, B. Kong and R. D. Vigil, Bioresour. Technol., 2015, 198, 283–291 CrossRef CAS.
- A. Donazzi, A. Beretta, G. Groppi and P. Forzatti, J. Catal., 2008, 255, 259–268 CrossRef CAS.
- K. R. Rout and H. A. Jakobsen, Can. J. Chem. Eng., 2015, 93, 1222–1238 CrossRef CAS.
Footnote |
| † Electronic supplementary information (ESI) available: Reactive CFD–DEM framework; computational domain and numerical methods; parametric analysis of the effect of yi,min. See DOI: 10.1039/c9re00440h |
| This journal is © The Royal Society of Chemistry 2020 |

