
 Open Access Article
 This Open Access Article is licensed under a Creative Commons Attribution-Non Commercial 3.0 Unported Licence
Apoptosis induction and cell cycle arrest induced by Sinkiangenone B, a novel phenylpropanoid derivative from the resin of Ferula sinkiangensis K. M. Shen†
Junchi Wanga,
Yuan Gaoa,
Huijuan Wanga,
Lihua Chena,
Li Caoa,
Jianguo Xub,
Xiaojin Lib,
Yaqin Zhaob,
Jun Zhub and
Jianyong Si *a
*a
aThe Key Laboratory of Bioactive Substances and Resources Utilization of Chinese Herbal Medicine, Ministry of Education, Institute of Medicinal Plant Development, Chinese Academy of Medical Sciences, Peking Union Medical College, Beijing 100193, P. R. China. E-mail: jianyongsi1963@126.com; Tel: +86-10-57833299
bXinjiang Institute of Chinese Materia Medica and Ethical Materia Medica, Urumqi 830002, P. R. China
First published on 23rd January 2018
Abstract
Four new phenylpropanoid derivatives, Sinkiangenone A–D (1–2, 4–5), together with eleven known compounds (3, 6–15), were isolated from the resin of Ferula sinkiangensis. Their structures were determined on the basis of spectroscopic analysis, including IR, UV, HR-ESI-MS, 1D NMR, 2D NMR and CD spectra. Of all the compounds, Sinkiangenone B showed the best antitumor activity against AGS gastric cancer cells with lower toxicity against normal human gastric epithelial cells. In addition, we characterized its mechanism of the antiproliferation effects on AGS cells. Annexin V-FITC/PI staining and increased Bax/Bcl-2 ratios indicated that Sinkiangenone B induced apoptosis in AGS cells. Cell cycle analysis showed Sinkiangenone B arrested cell cycle at G0/G1 phase. Western blot results showed the expression of P16, P27 and RB proteins increased, while the expression of P53, Cdk2, Cdk4, cyclin D1 and cyclin E decreased in AGS cells. In summary, these results suggested that Sinkiangenone B had the potential to be treated as a valuable candidate in gastric cancer therapy.
Introduction
Gastric cancer has become one of the most prevalent cancers in the world in recent years,1 and its mortality ranks second in the world in terms of cancer mortality. China is a high incidence area of gastric cancer; its annual prevalence and the mortality rates of gastric cancer are more than twice the world level, and gastric cancer has become China's third largest common cancer. The current treatment therapy for gastric cancer is chemotherapy, but the side effects limit its application. Recently, natural products for gastric cancer treatment therapy have drawn increasing attention.2,3The genus Ferula belongs to the family Umbelliferae with more than 150 species distributed throughout Central Asia and the Mediterranean.4 Modern pharmacology research suggests Ferula genus have a variety of biological activities, such as cancer chemopreventive activity,5–7 antiinflammatory,8–10 antiulcerative,11,12 antibacterial,13–15 anticoagulant,15,16 anticonvulsant17 and antispasmodic18 effects.
As an important member of this genus, Ferula sinkiangensis K. M. Shen is mainly distributed in the Xinjiang Uygur Autonomous Region of China, and has long been used as a folk medicine for the treatment of stomach disorders,19 the potential value of this herb to treat gastric cancer cannot be ignored. Previous phytochemical studies of genus Ferula mainly focused on sesquiterpenes and sesquiterpene coumarins,20,21 and compounds such as sesquiterpene coumarins, steroidal esters and disulphide have been found from F. sinkiangensis.22–25 However, the constituents of phenylpropanoid derivatives rarely reported in recent years. In this study, four new phenylpropanoid derivatives, Sinkiangenone A–D (1–2, 4–5), together with eleven known compounds (3, 6–15) were isolated from the resin of F. sinkiangensis. Extensive spectroscopic analysis, including IR, UV, HR-ESI-MS, 1D NMR, 2D NMR and CD spectra, were described. Furthermore, we screened these compounds for the growth inhibition effect in gastric cancer cells, and then characterized the possible mechanism. It was found that Sinkiangenone B showed the best antitumor activity against gastric cancer cells with lower toxicity against normal human gastric epithelial cells, when compared with other compounds. Besides, Sinkiangenone B induced apoptosis and cell cycle arrest in gastric cancer cells.
Results and discussion
Structural elucidation
An 95% ethanol extract of the resin of Ferula sinkiangensis K. M. Shen was subjected to repeated silica gel, MCI gel, Sephadex LH-20 and semi-prepare HPLC to afford four new phenylpropanoid derivatives, Sinkiangenone A–D (1–2, 4–5), along with eleven known compounds, ferulaeone G (3), ferulic acid (6), 3′,4′-dimethoxy cinnamyl isovalent (7), (2E)-3-(4-ethoxy-3-methoxyphenyl)prop-2-en-1-ol (8), vanillin (9), 4,4′-dihydroxy-3,3′-dimethoxy-trans-stilbene (10), coniferaldehyde (11), 3-(3,4-dimethoxyphenyl)-2-propen-1-yl ester (12), p-hydroxycinnamic acid (13), (7S,8R)-guaiacyl glycerol (14), and (7S,8S)-guaiacyl glycerol (15) (Fig. 1). | ||
| Fig. 1 Structures of compounds 1–15. | ||
Compound (1) was isolated as colorless gum and its molecular formula was established by HR-ESI-MS (positive-ion mode) as C35H44O7, with a quasi-molecular ion peak of [M + Na]+ at m/z 599.3027 (calcd for C35H44O7Na, 599.2985), and [M + H]+ at m/z 577.3207 (calcd for C35H45O7, 577.3165), implying fourteen degrees of unsaturation. The IR spectrum of compound (1) showed carbonyl (1734 cm−1), hydroxyl (3414 cm−1) and double bond (1616 cm−1) groups. The 1H-NMR spectrum (Table 1) showed the presence of two 1,2,4-trisubstituted benzene rings (δH 7.47 (d, J = 9.0 Hz, 1H), 6.82 (d, J = 1.8 Hz, 1H), 6.70 (dd, J = 8.4, 1.8 Hz, 1H), 6.67 (d, J = 8.4 Hz, 1H), 6.29 (dd, J = 9.0, 2.4 Hz, 1H) and 6.27 (d, J = 2.4 Hz, 1H)), five olefinic protons at δH 6.23 (d, J = 15.6 Hz, 1H), 5.78 (m, 1H), 5.06 (t, J = 7.2 Hz, 2H), and 4.95 (t, J = 7.2 Hz, 1H), two methoxy groups at δH 3.81 and 3.63, four methyl signals at δH 1.63, 1.57, 1.56 and 1.48. The 13C-NMR spectrum (Table 1) presented two carbonyl groups at δC 201.63 and 175.21.
| Position | Compound 1 | Compound 2 | ||
|---|---|---|---|---|
| δC | δH (J in Hz) | δC | δH (J in Hz) | |
| 1 | 130.79 | — | 130.35 | — |
| 2 | 110.27 | 6.82 (d, 1.8) | 110.04 | 6.64 (d, 1.2) |
| 3 | 149.01 | — | 148.94 | — |
| 4 | 147.40 | — | 147.52 | — |
| 5 | 116.19 | 6.67 (d, 8.4) | 116.07 | 6.61 (d, 8.4) |
| 6 | 120.58 | 6.70 (dd, 8.4, 1.8) | 120.78 | 6.58 (dd, 8.4, 1.2) |
| 7 | 135.29 | 6.23 (d, 15.6) | 135.97 | 6.30 (d, 15.6) |
| 8 | 121.84 | 5.78 (m) | 120.85 | 5.69 (m) |
| 9 | 38.11 | 2.83 (m) | 43.23 | 2.80 (m), 2.89 (m) |
| 1′ | 112.76 | — | 113.57 | — |
| 2′ | 167.30 | — | 167.51 | — |
| 3′ | 104.30 | 6.27 (d, 2.4) | 103.87 | 6.44 (d, 1.8) |
| 4′ | 166.09 | — | 114.71 | 6.68 (dd, 8.4, 1.8) |
| 5′ | 109.07 | 6.29 (dd, 9.0, 2.4) | 158.33 | — |
| 6′ | 132.39 | 7.47 (d, 9.0) | 129.86 | 7.75 (d, 8.4) |
| 7′ | 201.63 | — | 193.96 | — |
| 8′ | 62.54 | — | 63.19 | — |
| 9′ | 175.21 | — | 172.16 | — |
| 1′′ | 33.12 | 2.77 (m) | 38.66 | 2.69 (m), 1.76 (m) |
| 2′′ | 118.68 | 4.95 (t, 7.2) | 118.40 | 4.99 (t, 7.2) |
| 3′′ | 140.39 | — | 141.58 | — |
| 4′′ | 40.97 | 1.97 (m) | 40.78 | 1.81 (m) |
| 5′′ | 27.27 | 2.05 (m) | 27.23 | 1.96 (m) |
| 6′′ | 125.16 | 5.06 (t, 7.2) | 124.93 | 4.90 (m) |
| 7′′ | 136.16 | — | 136.11 | — |
| 8′′ | 40.86 | 1.97 (m) | 40.72 | 1.81 (m) |
| 9′′ | 27.81 | 2.05 (m) | 27.71 | 1.96 (m) |
| 10′′ | 125.50 | 5.06 (t, 7.2) | 125.43 | 4.90 (m) |
| 11′′ | 132.08 | — | 132.02 | — |
| 12′′ | 17.78 | 1.56 (s) | 17.76 | 1.54 (s) |
| 13′′ | 16.49 | 1.48 (s) | 16.52 | 1.62 (s) |
| 14′′ | 16.22 | 1.57 (s) | 16.00 | 1.57 (s) |
| 15′′ | 25.92 | 1.63 (s) | 25.90 | 1.45 (s) |
| 3-OCH3 | 56.30 | 3.81 (s) | 56.21 | 3.73 (s) |
| 9′-OCH3 | 52.98 | 3.63 (s) | — | — |
Comprehensive analysis of the HSQC and 1H–1H COSY data (Fig. 2) led to the identification of four 1H–1H spin systems (H-7/H-8/H-9, H-1′′/H-2′′, H-4′′/H-5′′/H-6′′, H-8′′/H-9′′/H-10′′), which revealed four partial structures (C-7-C-8-C-9, C-1′′-C-2′′, C-4′′-C-5′′-C-6′′, C-8′′-C-9′′-C-10′′). In the HMBC spectrum (Fig. 2), the correlations from H-2, H-5 and H-6 to C-7; H-9 to C-7′ and C-8′; H-3′, H-5′ and H-6′ to C-7′; H-1′′ to C-7′ and C-8′; H-13′′ to C-2′′, C-3′′ and C-4′′; H-14′′ to C-6′′, C-7′′ and C-8′′; H-15′′ to C-10′′, C-11′′ and C-12′′ established the skeleton structure of compound (1). The positions of two methoxy groups were assigned by HMBC correlations from 3-OCH3 (δH 3.81) to C-2 (δC 110.27), C-3 (δC 149.01), C-4 (δC 147.40), and 9′-OCH3 (δH 3.63) to C-8′ (δC 62.54), C-9′ (δC 175.21). Thus, the planar structure of compound (1) was established. The configuration of the double bond Δ7,8 was assigned as E based on the coupling constant (J = 15.6 Hz). However, compound (1) was uncrystallziable and we couldn't find an effective method to determine the configuration of C-8′ so far. In the end, compound (1) was named Sinkiangenone A.
 | ||
| Fig. 2 Key 1H–1H COSY and HMBC correlations of compounds 1 and 2. | ||
Compound (2) was isolated as colorless gum with the molecular formula C34H42O7, as determined by the [M − H2O + Na]+ quasi-molecular ion peak at m/z 567.2761 (calcd for C34H40O6Na+, 567.2723) and [M − H2O + H]+ quasi-molecular ion peak at m/z 545.2939 (calcd for C34H41O6, 545.2903) in its positive-ion HR-ESI-MS, implying fourteen degrees of unsaturation. The IR spectrum of compound (2) suggested hydroxyl (3437 cm−1) and double bond (1613 cm−1) groups. The 13C-NMR and 1H-NMR data of (2) (Table 1) were similar to those of Sinkiangenone A (1), except that the chemical shifts of C-7′ (δC 193.96), C-9′ (δC 172.16) were significantly shifted to the highfield region and C-9 (δC 43.23), C-1′′ (δC 38.66) were significantly shifted to the downfield region compared to that of (1), and a methoxy group signal was lost. Considering their differences in molecular mass (14 amu), (2) was deduced to lose a methoxy group at C-9 compared to (1), which was established by the HMBC correlations (Fig. 2). Besides, in the downfield region, chemical shift of δC 158.33 was significantly smaller than C-4′ (δC 166.09) of (1), which indicated the locations of hydroxyl groups of (2) may be different from that of (1) on the ring which C-4′ located at. In the HMBC spectrum, there were correlations from H-3′ and H-6′ to C-1 and no correlation from H-4′ to C-1, which established the structure of this ring. Thus, the planar structure of compound (2) was established. The configuration of the double bond Δ7,8 was assigned as E based on the coupling constant (J = 15.6 Hz). And the same reason as compound (1), the configuration of C-8′ couldn't be determined. Finally, compound (2) was named Sinkiangenone B.
Compound (4) was obtained as colorless gum. Its molecular formula was established as C20H22O8 by HR-ESI-MS (positive-ion mode) with a quasi-molecular ion peak of [M + Na]+ at m/z 413.1230 (calcd for C20H22O8Na, 413.1212), implying ten degrees of unsaturation. The IR spectrum of (4) showed a strong absorption band at 3391 cm−1, which was typical for hydroxyl groups. The 1H-NMR spectrum (Table 2) showed the presence of two 1,2,4-trisubstituted benzene rings [δH 7.16 (d, J = 1.8 Hz, 1H), 7.04 (dd, J = 8.4, 1.8 Hz, 1H), 7.01 (d, J = 1.8 Hz, 1H), 6.83 (dd, J = 8.4, 1.8 Hz, 1H), 6.78 (d, J = 8.4 Hz, 1H) and 6.75 (d, J = 8.4 Hz, 1H)], two olefinic protons at δH 7.58 (d, J = 15.6 Hz, 1H) and 6.34 (d, J = 15.6 Hz, 1H), two methoxy groups at δH 3.87 and 3.84. The 13C-NMR spectrum (Table 2) presented a carbonyl group at δC 169.32, two O-bearing methines at δC 75.59 and 74.36, an O-bearing methylene at δC 66.75. Further analysis of the HSQC and 1H–1H COSY data (Fig. 3) led to the identification of a 1H–1H spin system (H-7′/H-8′/H-9′), which indicated the presence of a partial structure (C-7′-C-8′-C-9′). The fragments were connected through the correlations from H-7 to C-1, C-2, C-5, C-6, C-9; H-8 to C-9; H-9′ to C-9; H-7′ to C-1′, C-2′, C-6′, C-8′, C-9′ in the HMBC spectrum (Fig. 3). The positions of two methoxy groups were assigned by HMBC correlations between the methoxy protons and C-2 (δC 116.67), C-3 (δC 149.36), C-4 (δC 150.62), and C-2′ (δC 111.65), C-3′ (δC 148.81), C-4′ (δC 147.06). Thus, the planar structure of compound (4) was established.
| Position | Compound 1 | Compound 2 | ||
|---|---|---|---|---|
| δC | δH (J in Hz) | δC | δH (J in Hz) | |
| 1 | 127.73 | — | 127.69 | — |
| 2 | 111.67 | 7.16 (d, 1.8) | 111.66 | 7.16 (d, 1.8) |
| 3 | 149.36 | — | 149.36 | — |
| 4 | 150.62 | — | 150.64 | — |
| 5 | 116.45 | 6.78 (d, 8.4) | 116.45 | 6.78 (d, 8.4) |
| 6 | 124.10 | 7.04 (dd, 8.4, 1.8) | 124.13 | 7.04 (dd, 8.4, 1.8) |
| 7 | 146.90 | 7.58 (d, 15.6) | 146.99 | 7.56 (d, 15.6) |
| 8 | 115.40 | 6.34 (d, 15.6) | 115.25 | 6.32 (d, 15.6) |
| 9 | 169.32 | — | 169.09 | — |
| 1′ | 134.51 | — | 134.24 | — |
| 2′ | 111.65 | 7.01 (d, 1.8) | 111.47 | 6.97 (d, 1.8) |
| 3′ | 148.81 | — | 148.91 | — |
| 4′ | 147.06 | — | 147.27 | — |
| 5′ | 115.77 | 6.75 (d, 8.4) | 115.95 | 6.75 (d, 8.4) |
| 6′ | 120.91 | 6.83 (dd, 8.4, 1.8) | 120.67 | 6.80 (dd, 8.4, 1.8) |
| 7′ | 75.59 | 4.57 (d, 6.0) | 76.00 | 4.56 (d, 6.6) |
| 8′ | 74.36 | 3.97 (m) | 75.00 | 3.91 (m) |
| 9′ | 66.75 | 4.32 (dd, 11.4, 3.6), 4.19 (dd, 11.4, 6.6) | 66.78 | 4.08 (dd, 10.8, 3.6), 3.94 (dd, 10.8, 6.6) |
| 3-OCH3 | 56.42 | 3.87 (s) | 56.43 | 3.87 (s) |
| 3′-OCH3 | 56.31 | 3.84 (s) | 56.30 | 3.82 (s) |
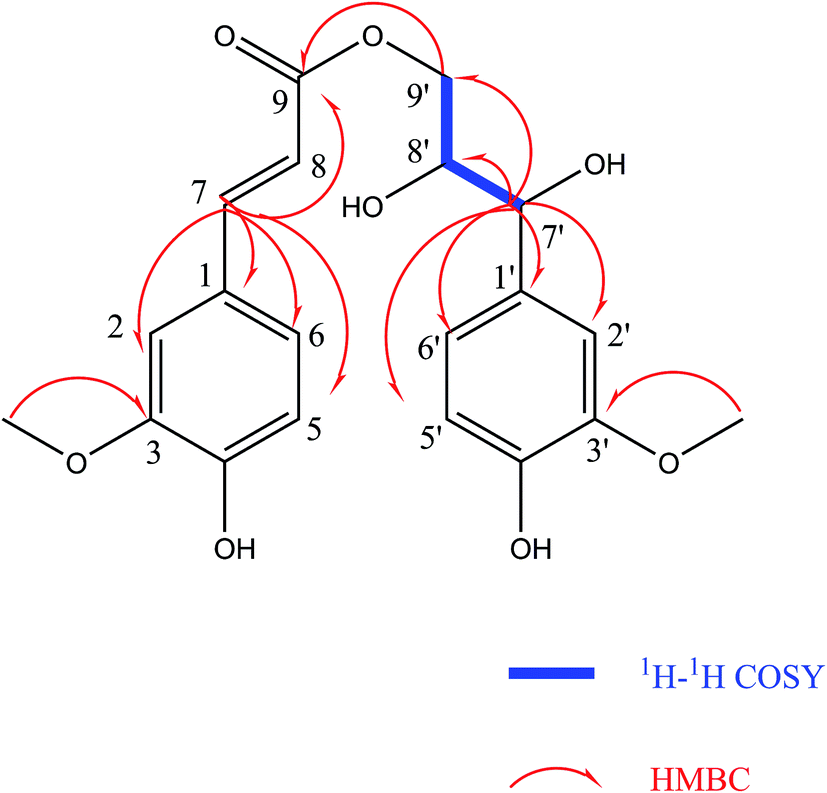 | ||
| Fig. 3 Key 1H–1H COSY and HMBC correlations of compound 4. | ||
The configuration of the double bonds Δ7,8 was assigned as E based on coupling constant (J = 15.6 Hz), and there is no NOE cross-peak between H-7 and H-8. The relative configuration of C-7′, C-8′ was based on the coupling constant (J = 6.0 Hz) between H-7′ and H-8′, which suggested a threo isomer in the cases of guaiacylglycerol derivatives.26 The absolute configuration of (4) was established by the Mo2(OAc)4-induced CD spectrum. In the CD spectrum, a positive Cotton effect at 310 nm (Fig. 4) confirmed the absolute configuration of the vic-diols as S,S (Fig. 5) on the basis of Snatzke's method.27 Therefore, compound (4) was named Sinkiangenone C.
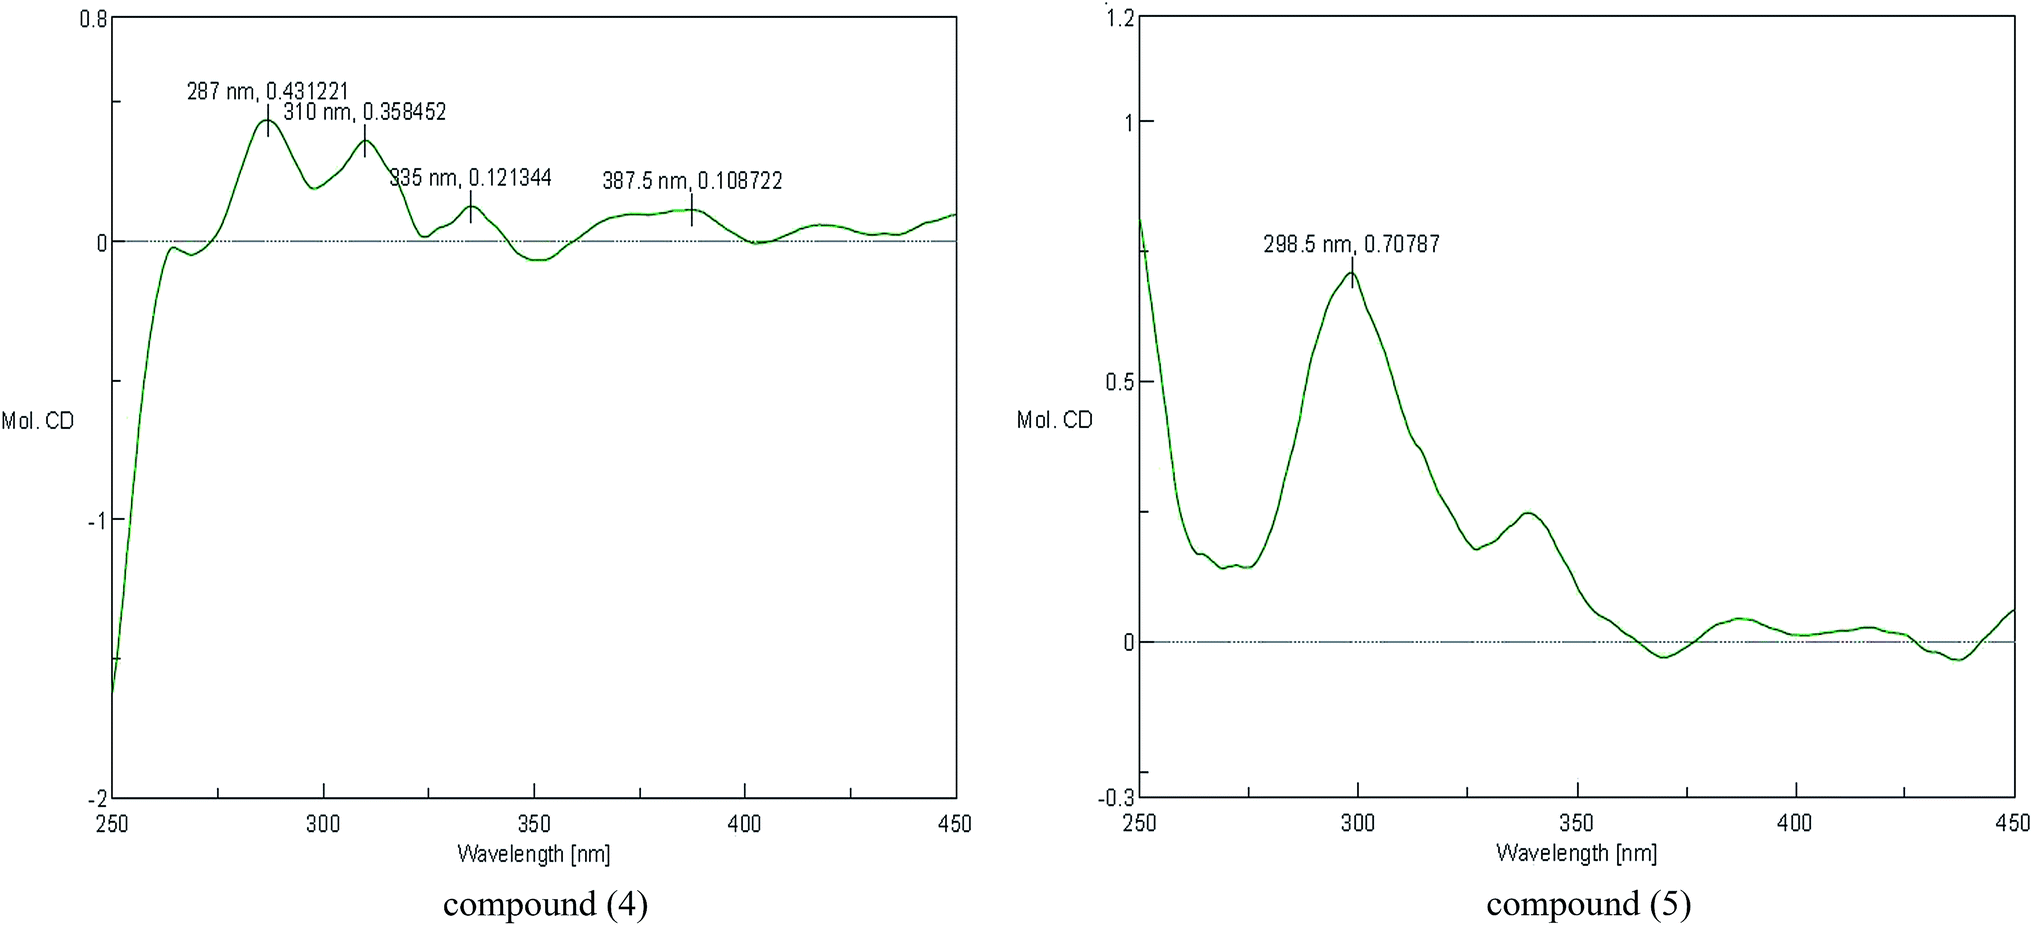 | ||
| Fig. 4 Mo2(OAc)4-induced CD spectra of compounds 4 and 5. | ||
 | ||
| Fig. 5 The torsions of dihedral angles of compounds 4 and 5. | ||
Compound (5) was obtained as colorless gum and its molecular formula was established as C20H22O8 by HR-ESI-MS (positive-ion mode) with a quasi-molecular ion peak of [M + Na]+ at m/z 413.1229 (calcd for C20H22O8Na, 413.1212), implying ten degrees of unsaturation. The IR spectrum of (5) showed a strong absorption band at 3373 cm−1, typical for a hydroxyl group. The 13C-NMR data of (5) (Table 2) were very similar to those of Sinkiangenone C (4), but in the 1H-NMR spectrum (Table 2), the chemical shifts of H-7′ (δH 4.56), H-8′ (δH 3.91) and H-9′ (δH 4.08 and 3.94) were shifted to the highfield region, suggesting that compound (5) differed from compound (4) in the absolute configuration of C-7′ and C-8′.
The relative configuration of C-7′, C-8′ was based on the coupling constant (J = 6.6 Hz) between H-7′ and H-8′, which also suggested a threo isomer. In the Mo2(OAc)4-induced CD spectrum, compound (5) produced a positive minimum effect around 310 nm (Fig. 4), due to the strong positive effect of both sides of the band, and it could be considered that the trend was consistent with the predicted negative band,28 which confirmed the absolute configuration of the vic-diols as R,R (Fig. 5). Thus, compound (5) was named Sinkiangenone D.
Cytotoxicity
All isolated compounds were assessed for their in vitro cytotoxic activities against human gastric cancer cell lines MGC-803, AGS and normal human gastric epithelial cells line GES-1, using the MTT method with Taxol as the positive control. The data in Table 3 suggested that Sinkiangenone B showed the best antitumor activity against AGS gastric cancer cell line and was less cytotoxic to GES-1 cells compared with AGS cells. Therefore, we chose Sinkiangenone B for further research.| Compounds | IC50a (μM) | ||
|---|---|---|---|
| MGC-803 | AGS | GES-1 | |
| a Values represent mean ± SD of triplicate experiments.b Positive control substance. | |||
| 1 | 45.05 ± 3.09 | 48.13 ± 0.87 | 32.37 ± 0.12 |
| 2 | 18.89 ± 1.32 | 16.15 ± 0.14 | 36.73 ± 0.98 |
| 3 | 35.15 ± 1.37 | >200 | 35.23 ± 0.78 |
| 4 | 176.19 ± 10.99 | 182.46 ± 5.92 | 156.05 ± 6.28 |
| 5 | 177.85 ± 4.20 | >200 | 180.12 ± 7.34 |
| 6 | >200 | >200 | >200 |
| 7 | 160.06 ± 6.11 | >200 | >200 |
| 8 | >200 | >200 | >200 |
| 9 | >200 | >200 | >200 |
| 10 | >200 | >200 | >200 |
| 11 | 69.65 ± 0.56 | >200 | 106.67 ± 4.47 |
| 12 | 107.32 ± 3.81 | >200 | >200 |
| 13 | >200 | >200 | >200 |
| 14 | >200 | >200 | >200 |
| 15 | >200 | >200 | >200 |
| Taxolb | 3.35 ± 0.09 | 1.82 ± 0.09 | 2.67 ± 0.06 |
Sinkiangenone B induces apoptosis in AGS cells
In order to characterize the apoptosis process of AGS cells induced by Sinkiangenone B, we examined the numbers of apoptotic cells by Annexin V-FITC/PI apoptosis staining. After 24 h exposure to different concentrations of Sinkiangenone B, the numbers of apoptotic cells (AV+/PI− and AV+/PI+) increased in a dose-dependent manner (Fig. 6A). The cellular apoptotic rates are shown in Fig. 6B. These results demonstrated that Sinkiangenone B was effective in the induction of apoptosis in AGS gastric cancer cells.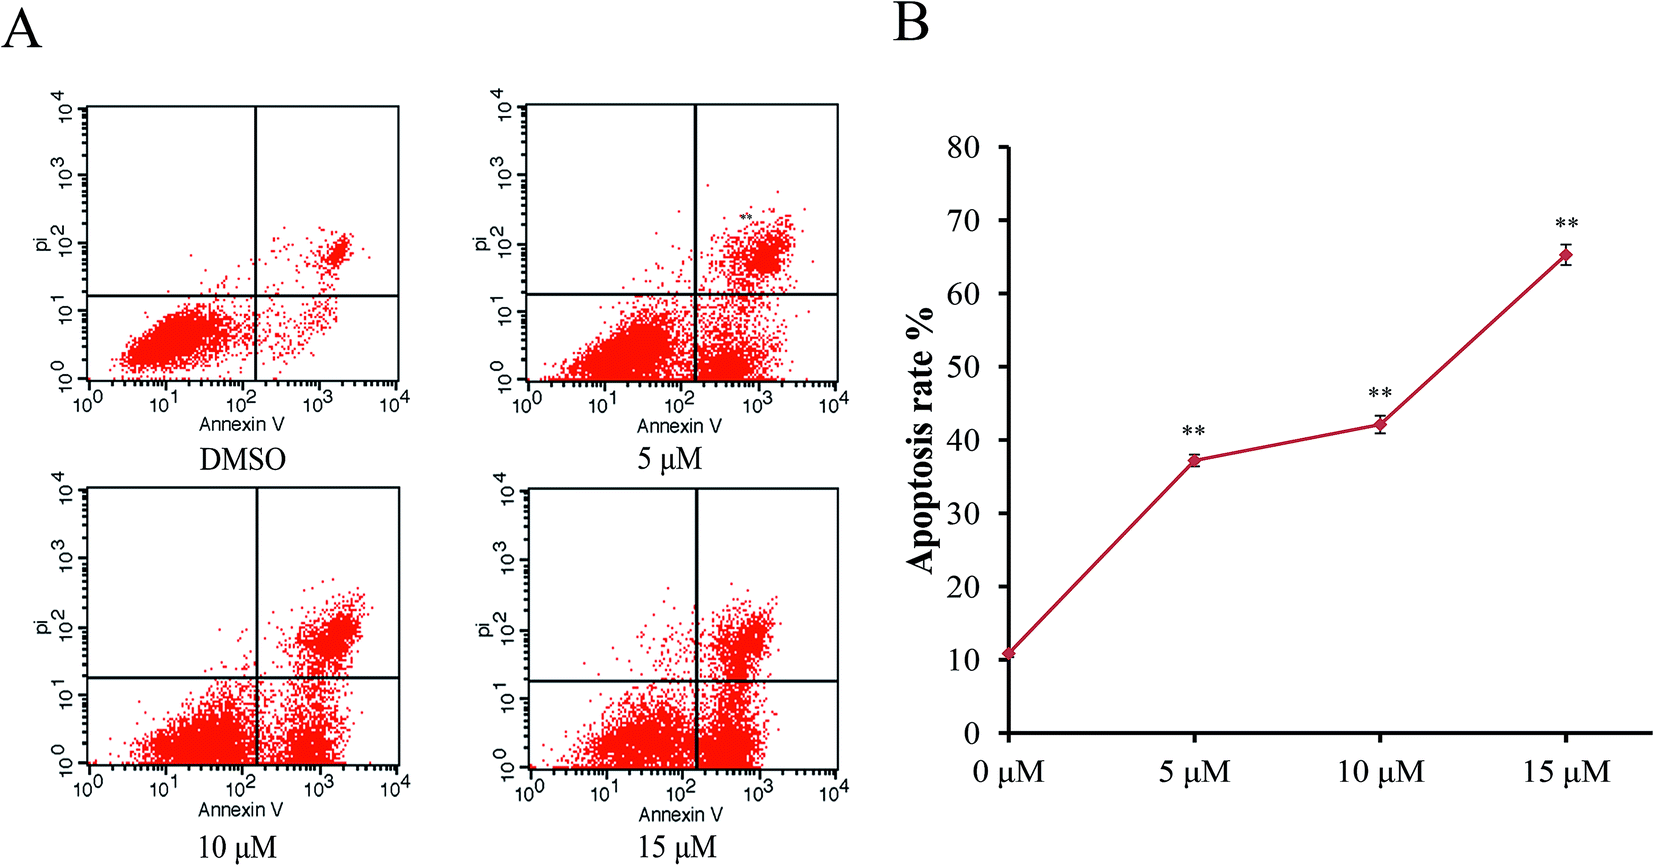 | ||
| Fig. 6 Apoptosis induced by Sinkiangenone B in AGS cells detected by the Annexin V-FITC/PI staining test. AGS cells were treated with Sinkiangenone B (0, 5, 10, 15 μm) for 24 h. DMSO treatment was used as a vehicle control. The apoptotic rates were determined by Annexin V-FITC/PI staining. Dot-plot graphs show viable cells (AV−/PI−), necrotic cells (AV−/PI+), early phase apoptotic cells (AV+/PI−), and late phase apoptotic cells (AV+/PI+). *p < 0.05 and **p < 0.01 were considered statistically significance. | ||
Sinkiangenone B affects apoptosis-related protein expression in AGS gastric cancer cells
The Bcl-2 protein family is the key regulator of apoptosis.29 Previous results indicated that Sinkiangenone B induced apoptosis in AGS cells, therefore, we analyzed the protein expression of Bax and Bcl-2 after treating with different concentrations of Sinkiangenone B. Western blot results showed an increased level of Bax and a decreased level of Bcl-2 protein after treatment with Sinkiangenone B (Fig. 8A). Furthermore, we assessed the cleaved caspase-3 and cleaved PARP after exposure to different concentrations of Sinkiangenone B, as caspase-3 is an executioner that cleaves a broad spectrum of cellular target proteins like nuclear PARP, leading to a cell death cascade. The results showed downregulation of cleaved PARP and upregulation of cleaved caspase-3 (Fig. 8A). Relative protein expression data are shown in Fig. 8B.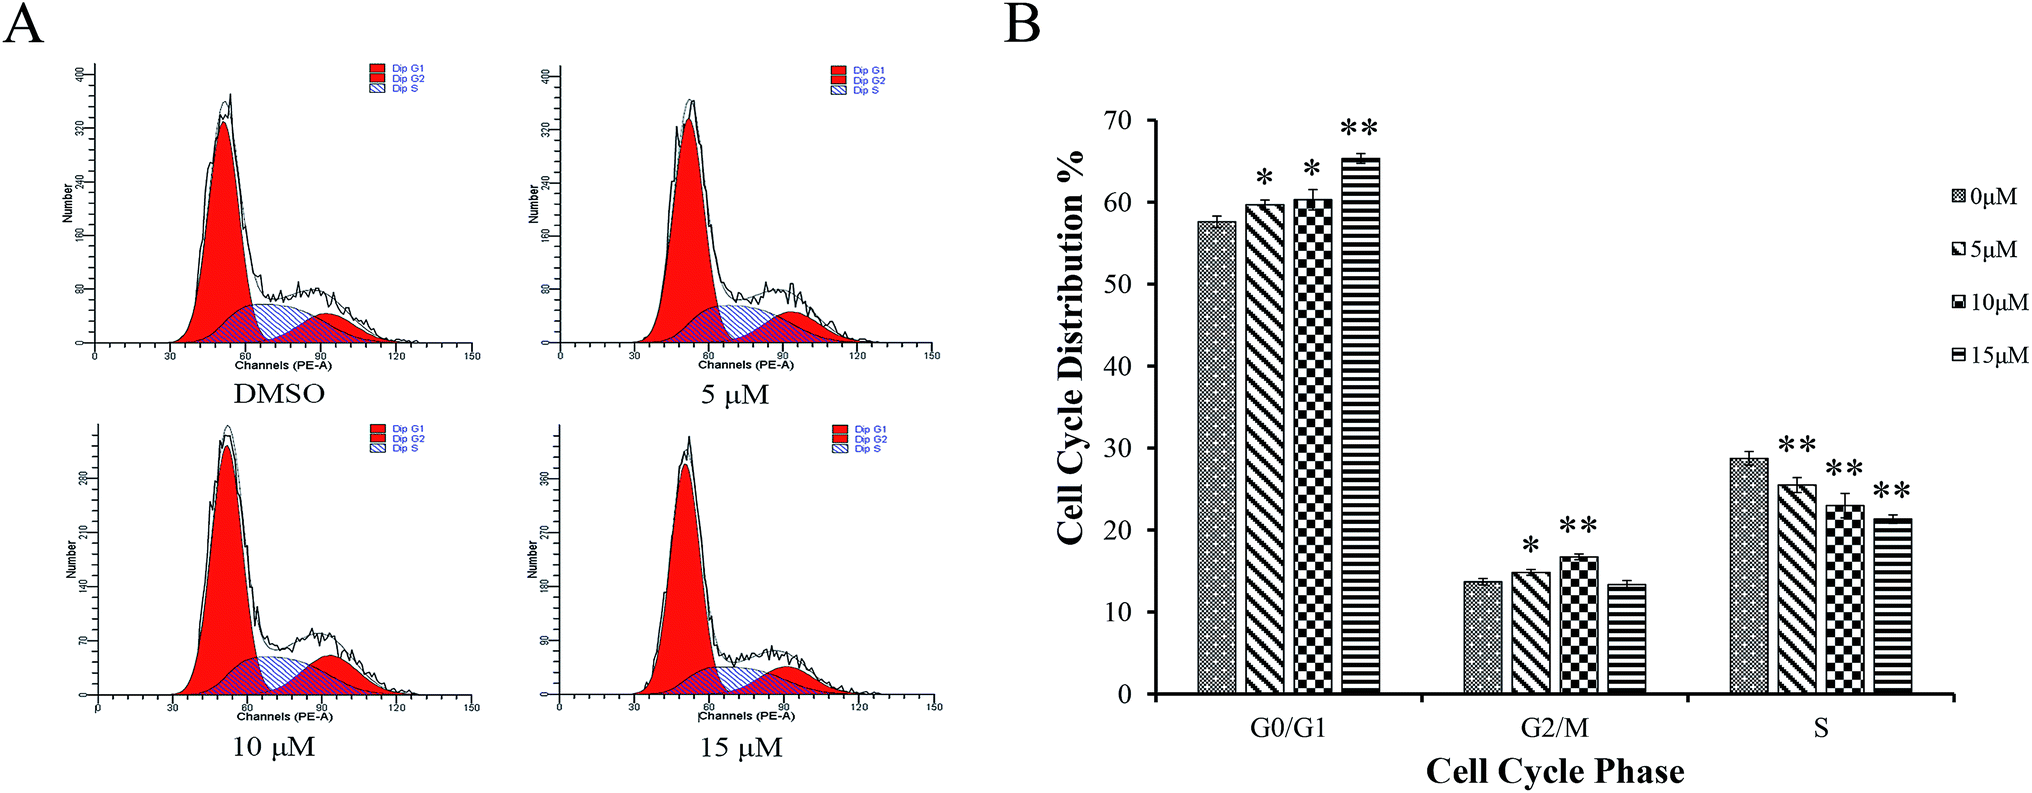 | ||
| Fig. 7 Effects of Sinkiangenone B on cell cycle distribution in AGS cells. AGS cells were treated by Sinkiangenone B (0, 5, 10, 15 μm) for 24 h, then analyzed by flow cytometry for cell cycle distribution. Cell cycle distributions after Sinkiangenone B treatment in AGS cells are shown. *p < 0.05 and **p < 0.01 were considered statistically significance. | ||
 | ||
| Fig. 8 The effects of Sinkiangenone B on the expression of apoptosis-related proteins determined by western blot. AGS cells were treated with Sinkiangenone B (0, 5, 10, 15 μm) for 24 h. Sinkiangenone B decreased the expression of Bcl-2 and cleaved PARP, and increased the expression of Bax and cleaved caspase-3. Relative expression levels of apoptosis-related proteins were showed. β-Tubulin was used to confirm equal protein loading. *p < 0.05 and **p < 0.01 were considered statistically significant. | ||
Sinkiangenone B increases G0/G1 arrest of cell cycle in AGS cells
AGS cells were treated with different concentrations of Sinkiangenone B for 24 h, followed by flow cytometry analyses and the Sinkiangenone B-treated group revealed G0/G1 phase arrest compared with control group (Fig. 7A). Fig. 7B revealed the numbers of cells arrested in G0/G1 phase. These results indicated that growth inhibition and apoptosis induction of Sinkiangenone B in AGS gastric cancer cells were partly associated with the induction of G0/G1 arrest in cell cycle.Sinkiangenone B affects cell cycle regulation-related protein expression in AGS cells
The effects of Sinkiangenone B on the expression of some major regulatory proteins were analyzed. Fig. 9A showed that after treatment with different concentrations of Sinkiangenone B, the expression of P53, cyclin D1, cyclin E, CDK2 and CDK4 decreased, while the expression of P16, P27 and RB increased. Relative protein expression data are shown in Fig. 9B. These data indicated that changes of protein expression might play a crucial part in G0/G1 arrest of cell cycle in AGS cells. | ||
| Fig. 9 The effects of Sinkiangenone B on the expression of cell cycle-related proteins determined by western blot. AGS cells were treated with Sinkiangenone B (0, 5, 10, 15 μm) for 24 h. Sinkiangenone B decreased the expression of P53, cyclin D1, cyclin E, Cdk2 and Cdk4, with the expression of P27, P16 and RB increased. Relative expression levels of cell cycle-related proteins were showed. β-Tubulin was used to confirm equal protein loading. *p < 0.05 and **p < 0.01 were considered statistically significant. | ||
Experimental section
General experimental procedures
HR-ESI-MS data were obtained with a Thermo Scientific LTQ-Obitrap XL (Thermo Scientific, Bremen, Germany). UV spectra were recorded on a Shimadzu UV-2550 UV-Vis spectrophotometer. A FTIR-8400S spectrometer was used for recording the IR spectra with KBr pellets. Optical rotations were determined in MeOH at 25 °C using a Perkin-Elmer 341 digital polarimeter. NMR spectra were recorded on a Bruker AV III 600 spectrometer with TMS as the internal reference. Chemical shifts were expressed in δ (ppm) with reference to the solvent signals. Circular dichroism (CD) spectra were measured on a JASCO J-815 spectropolarimeter. Column chromatography was performed on silica gel (100–200 mesh, Qingdao Haiyang Chemical Co., Ltd., Qingdao, P. R. China) and Sephadex LH-20 (Pharmacia Biotech, Sweden). Thin layer chromatography (TLC) was performed using precoated silica gel F254 plates (0.25 mm, Qingdao Haiyang Chemical Co., Ltd., Qingdao, P. R. China). Semi-preparative HPLC was carried out on a K1001 analytic LC instrument (Beijing Chuangxintongheng Science & Technology CO., Ltd) with a YMC-Pack ODS-AQ column (250 × 10 mm, 5 μm). All reagents were purchased from Beijing Chemical Works (Beijing, P. R. China), and all solvents used for HPLC were of HPLC grade.Plant material
The resin of F. sinkiangensis were collected from Yili state, Xinjiang Uygur Autonomous Region of China in May 2015, and were identified by Prof. Xiaojin Li, Xinjiang Institute of Chinese Materia Medica and Ethical Materia Medica, Urumqi, China. A voucher specimen was deposited in the Xinjiang Institute of Chinese Materia Medica and Ethical Materia Medica.Extraction and isolation
The resin of F. sinkiangensis (2.0 kg) was extracted three times with 95% ethanol (3.0 L each time) under reflux for 2 h. The solvent was removed under reduced pressure to yield approximately 1400 g of the ethanol extract, which was then suspended in H2O (2500 mL) and partitioned with petroleum ether, dichloromethane, ethyl acetate, and n-butanol to obtain the respective fractions: petroleum ether fraction (Fr. P, 14.0 g), dichloromethane fraction (Fr. D, 1300.0 g), ethyl acetate fraction (Fr. E, 23.0 g), n-butanol fraction (Fr. B, 21.2 g), and water fraction (Fr. W, 14.5 g).Fr. D was separated into six fractions (Fr. D-1–6) by silica gel chromatography and eluted using PET–EtOAc (20![[thin space (1/6-em)]](https://www.rsc.org/images/entities/char_2009.gif) :1–0:1, v/v) and CH2Cl2–MeOH (1:0–0:1, v/v). Fr. D-3 (193 g) was further separated into five fractions (Fr. D-3-1–5) by silica gel chromatography and eluted with n-hexane–acetone (20:1–0:1, v/v). Fr. D-3-1 was further purified using Sephadex LH-20 column (MeOH) to obtain compound (7) (6.2 mg). Fr. D-3-2 was then separated into two fractions (Fr. D-3-2-1–2) by silica gel chromatography and eluted using PET–EtOAc (40:1–0:1, v/v). Fr. D-3-2-1 was chromatographed over a Sephadex LH-20 column (MeOH), and then was purified by semi-preparative HPLC (MeOH–H2O, 70%:30%, flow rate: 2.0 mL min−1, tR = 13.0 min) to obtain compound (8) (5.0 mg). Fr. D-3-4 was separated into two fractions (Fr. D-3-4-1–2) by silica gel chromatography and eluted using PET–EtOAc (15:1–0:1, v/v). Fr. D-3-4-1 was purified by semi-preparative HPLC (MeOH–H2O, 70%:30%, flow rate: 2.0 mL min−1, tR = 13.0 min) to obtain compound (9) (39.0 mg). Fr. D-3-5 was fractionated into eight fractions (Fr. D-3-5-1–5) by MCI gel chromatography and eluted with MeOH–H2O solvent system (60%:40%–100%:0%, v/v). Fr. D-3-5-2 was chromatographed over a Sephadex LH-20 column (MeOH) to obtain compound (10) (6.7 mg) and two fractions (Fr. D-3-5-2-1–2), and Fr. D-3-5-2-1 was then purified by semi-preparative HPLC (MeOH–H2O, 70%:30%, flow rate: 2.0 mL min−1, tR = 13.7 min) to obtain compound (11) (12.4 mg). Fr. D-3-5-8 was chromatographed over a Sephadex LH-20 column (MeOH), and then was purified by semi-preparative HPLC (MeOH–0.1% formic acid–H2O, 92%:8%, flow rate: 2.0 mL min−1) to obtain compound (1) (10.0 mg, 25.5 min), (2) (9.0 mg, 27.8 min), and (3) (5.0 mg, 32.5 min). Fr. D-4 (360 g) was separated into four fractions (Fr. D-4-1–4) by silica gel chromatography and eluted using CH2Cl2–MeOH (1:0–0:1, v/v). Fr. D-4-1 was chromatographed over a silica gel column (PET–EtOAc, 10:1, v/v) and a Sephadex LH-20 column (MeOH), and then was purified by semi-preparative HPLC (MeOH–H2O, 90%:10%, flow rate: 2.0 mL min−1) to obtain compound (6) (10.0 mg, 8.8 min) and compound (12) (5.0 mg, 9.9 min). Fr. D-4-4 was chromatographed over a Sephadex LH-20 column (MeOH), and then was purified by preparative TLC (CHCl3–MeOH–H2O, 8.5:1.5:1, v/v/v) to obtain compound (13) (15.0 mg). Fr. D-5 (150 g) was separated into two fractions (Fr. D-5-1–2) by silica gel chromatography and eluted using CH2Cl2–MeOH (40:1–0:1, v/v). Fr. D-5-2 was then separated into two fractions (Fr. D-5-2-1–2) by silica gel chromatography and eluted using n-hexane–acetone (2:1–0:1, v/v). Fr. D-5-2-2 was chromatographed over a Sephadex LH-20 column (MeOH), and then was purified by semi-preparative HPLC (CH3CN–H2O, 20%:80%, flow rate: 2.0 mL min−1) to obtain compound (4) (4.0 mg, 59.9 min) and compound (5) (9.0 mg, 62.7 min).
:1–0:1, v/v) and CH2Cl2–MeOH (1:0–0:1, v/v). Fr. D-3 (193 g) was further separated into five fractions (Fr. D-3-1–5) by silica gel chromatography and eluted with n-hexane–acetone (20:1–0:1, v/v). Fr. D-3-1 was further purified using Sephadex LH-20 column (MeOH) to obtain compound (7) (6.2 mg). Fr. D-3-2 was then separated into two fractions (Fr. D-3-2-1–2) by silica gel chromatography and eluted using PET–EtOAc (40:1–0:1, v/v). Fr. D-3-2-1 was chromatographed over a Sephadex LH-20 column (MeOH), and then was purified by semi-preparative HPLC (MeOH–H2O, 70%:30%, flow rate: 2.0 mL min−1, tR = 13.0 min) to obtain compound (8) (5.0 mg). Fr. D-3-4 was separated into two fractions (Fr. D-3-4-1–2) by silica gel chromatography and eluted using PET–EtOAc (15:1–0:1, v/v). Fr. D-3-4-1 was purified by semi-preparative HPLC (MeOH–H2O, 70%:30%, flow rate: 2.0 mL min−1, tR = 13.0 min) to obtain compound (9) (39.0 mg). Fr. D-3-5 was fractionated into eight fractions (Fr. D-3-5-1–5) by MCI gel chromatography and eluted with MeOH–H2O solvent system (60%:40%–100%:0%, v/v). Fr. D-3-5-2 was chromatographed over a Sephadex LH-20 column (MeOH) to obtain compound (10) (6.7 mg) and two fractions (Fr. D-3-5-2-1–2), and Fr. D-3-5-2-1 was then purified by semi-preparative HPLC (MeOH–H2O, 70%:30%, flow rate: 2.0 mL min−1, tR = 13.7 min) to obtain compound (11) (12.4 mg). Fr. D-3-5-8 was chromatographed over a Sephadex LH-20 column (MeOH), and then was purified by semi-preparative HPLC (MeOH–0.1% formic acid–H2O, 92%:8%, flow rate: 2.0 mL min−1) to obtain compound (1) (10.0 mg, 25.5 min), (2) (9.0 mg, 27.8 min), and (3) (5.0 mg, 32.5 min). Fr. D-4 (360 g) was separated into four fractions (Fr. D-4-1–4) by silica gel chromatography and eluted using CH2Cl2–MeOH (1:0–0:1, v/v). Fr. D-4-1 was chromatographed over a silica gel column (PET–EtOAc, 10:1, v/v) and a Sephadex LH-20 column (MeOH), and then was purified by semi-preparative HPLC (MeOH–H2O, 90%:10%, flow rate: 2.0 mL min−1) to obtain compound (6) (10.0 mg, 8.8 min) and compound (12) (5.0 mg, 9.9 min). Fr. D-4-4 was chromatographed over a Sephadex LH-20 column (MeOH), and then was purified by preparative TLC (CHCl3–MeOH–H2O, 8.5:1.5:1, v/v/v) to obtain compound (13) (15.0 mg). Fr. D-5 (150 g) was separated into two fractions (Fr. D-5-1–2) by silica gel chromatography and eluted using CH2Cl2–MeOH (40:1–0:1, v/v). Fr. D-5-2 was then separated into two fractions (Fr. D-5-2-1–2) by silica gel chromatography and eluted using n-hexane–acetone (2:1–0:1, v/v). Fr. D-5-2-2 was chromatographed over a Sephadex LH-20 column (MeOH), and then was purified by semi-preparative HPLC (CH3CN–H2O, 20%:80%, flow rate: 2.0 mL min−1) to obtain compound (4) (4.0 mg, 59.9 min) and compound (5) (9.0 mg, 62.7 min).
Fr. B (21.2 g) was separated into eight fractions (Fr. B-1–8) by MCI gel chromatography and eluted with MeOH–H2O solvent system (40%:60%–100%:0%, v/v). Fr. B-1 was chromatographed over a Sephadex LH-20 column (MeOH), and then was purified by semi-preparative HPLC (MeOH–H2O, 16%:84%, flow rate: 2.0 mL min−1) to obtain compound (14) (7.2 mg, 10.0 min) and compound (15) (18.0 mg, 11.8 min).
Characterization of new compounds
Sinkiangenone A (1). Colorless gum; UV (MeOH) λmax (logε): 272 (4.65) nm; [α]25D: +22.22° (c = 0.108, MeOH); IR: 3414, 2965, 2923, 1772, 1734, 1616, 1609, 1516, 1277, 1158, 1033, 968, 854, 809 cm−1; 1H NMR (600 MHz, MeOH) and 13C NMR (150 MHz, MeOH) data, see Table 1; HR-ESI-MS (positive mode) m/z: 599.3027 [M + Na]+ (calcd for C35H44O7Na, 599.2985), 577.3207 [M + H]+ (calcd for C35H45O7, 577.3165).
Sinkiangenone B (2). Colorless gum; UV (MeOH) λmax (logε): 271 (4.45) nm; [α]25D: −23.08° (c = 0.065, MeOH); IR: 3437, 2963, 2921, 2851, 2366, 1613, 1609, 1513, 1452, 1276, 1155, 1034, 996, 856, 805 cm−1; 1H NMR (600 MHz, MeOH) and 13C NMR (150 MHz, MeOH) data, see Table 1; HR-ESI-MS (positive mode) m/z: 567.2761 [M − H2O + Na]+ (calcd for C34H40O6Na+, 567.2723), 545.2939 [M − H2O + H]+ (calcd for C34H41O6, 545.2903).
Sinkiangenone C (4). Colorless gum; UV (MeOH) λmax (logε): 324 (4.52), 287 (4.40) nm; [α]25D: +2.00° (c = 0.05, MeOH); IR: 3391, 2963, 2944, 2841, 1694, 1609, 1632, 1601, 1516, 1429, 1386, 1275, 1180, 1127, 1032, 821, 573 cm−1; 1H NMR (600 MHz, MeOH) and 13C NMR (150 MHz, MeOH) data, see Table 2; HR-ESI-MS (positive mode) m/z: 413.1230 [M + Na]+ (calcd for C20H22O8Na, 413.1212).
Sinkiangenone D (5). Colorless gum; UV (MeOH) λmax (logε): 323 (4.39), 288 (4.26) nm; [α]25D: −3.33° (c = 0.09, MeOH); IR: 3273, 2942, 1684, 1632, 1601, 1516, 1274, 1178, 1160, 1126, 1033, 984, 821, 572 cm−1; 1H NMR (600 MHz, MeOH) and 13C NMR (150 MHz, MeOH) data, see Table 1; HR-ESI-MS (positive mode) m/z: 413.1229 [M + Na]+ (calcd for C20H22O8Na, 413.1212).
Reagents and antibodies
3-(4,5-Dimethylthiazol-2-yl)-2,5-diphenyltetrazolium bromide (MTT), RNase A, propidium iodide (PI) were purchased from Sigma-Aldrich (MO, USA). Dulbecco's Modified Eagle's Medium (DMEM), RPMI 1640 medium, trypsin, penicillin, streptomycin, fetal bovine serum (FBS) were purchased from Gibco (CA, USA). The Annexin V-FITC apoptosis detection kit was obtained from Solarbio (Beijing, China). Antibodies against Bax, Bcl-2, cleaved PARP, cleaved caspase-3, cyclin D1, cyclin E, Cdk4, Cdk2, P16, P27 and P53 were purchased from Santa Cruz Biotechnology (CA, USA). Antibodies against RB and β-tubulin were obtained from Sigma-Aldrich (MO, USA).Cell viability assay
The cytotoxic activities of all isolated compounds were assessed using the MTT method against human gastric cancer cell lines MGC-803, AGS and normal human gastric epithelial cell line GES-1, as previously reported.30–32 The MGC-803, AGS and GES-1 cell lines were obtained from Prof. Li Cao. Cells were seeded at a density of 3 × 10⁴, 7 × 10⁴ and 9 × 10⁴ cells per mL per well in a 96-well flat-microtitre plate. MGC-803 and GES-1 cells were cultured in DMEM, and AGS cells were cultured in RPMI 1640 medium, supplemented with 10% fetal bovine serum. After 24 h of incubation, the cells were treated with the isolated compounds dissolved in dimethyl sulfoxide (DMSO) at six different concentrations (6.25–200 μM). Samples were cultured in a humidified atmosphere at 37 °C in 5% CO2 for 48 h. Taxol (Cisen Pharmaceutical Co., H20057404) was used as a positive control, and three replicate wells were used for each point measurement. 20 μL of MTT (5 mg mL−1) was added to each well and cultured for another 4 h before the termination of culture. Then the supernatant was discarded and DMSO (150 μL) was added to each well. The absorbance was recorded on a microplate reader at a wavelength of 570 nm (SpectramaxPlus 384; Molecular Devices, Sunnyvale, CA).Apoptosis analysis
Sinkiangenone B induced apoptosis in AGS cells were detected using Annexin V-FITC/PI apoptosis staining by flow cytometry. Cells were plated and treated with Sinkiangenone B (0, 5, 10, 15 μM) for 24 h. After harvested and washed twice with cold PBS, the cells were incubated with Annexin V in binding buffer for 10 min at room temperature in the dark, followed by PI for 5 min. Stained cells were detected and analyzed using FACS Calibur flow cytometry (Becton Dickinson, USA). Apoptotic rates were reported as the percentage of apoptotic cells among total cells.Cell cycle analysis
Cell cycle distribution was measured by staining DNA with PI. Cells (1 × 10⁶) were seeded in 6-well plates and treated with Sinkiangenone B (0, 5, 10, 15 μM) for 24 h. Then cells were harvested and fixed with 70% ethanol at −20 °C overnight. After washing twice with PBS, the cells were treated with RNase A for 20 min and then stained with PI (50 mg L−1) for 10 min in the dark at room temperature.33 The distribution of each phase in the cell cycle measured by DNA content was detected using FACS Calibur flow cytometry and analyzed by ModFit LT 4.0 software.Western blot
AGS cells were exposed to Sinkiangenone B (0, 5, 10, 15 μM) for 24 h. After collection, cells were lysed in lysis buffer and protein concentrations were determined by the BCA method. Protein samples were separated by SDS-PAGE and electrically transferred onto PVDF membranes. After blocking with 5% non-fat milk solution for 1 h, the membranes were incubated with primary antibody at 4 °C overnight. Later, the primary antibody was washed with TBST and incubated with secondary antibody at room temperature for 1 h. Protein bands were visualized by ECL and the levels of β-tubulin for each sample were used as a normalizing control.Statistical analysis
All data were analyzed by software using SPSS 14.0. Statistical significance between groups was defined as *p < 0.05 and **p < 0.01. Results were expressed as mean ± SD.Conclusions
In this work, four new phenylpropanoid derivatives, Sinkiangenone A–D, together with eleven known compounds, were isolated from the resin of F. sinkiangensis. Their structures were established by extensive spectroscopic and spectrometric analyses, including IR, UV, HR-ESI-MS, 1D NMR, 2D NMR and CD spectra. After screening, we found Sinkiangenone B showed the best antitumor activity against AGS cells with lower toxicity against normal human gastric epithelial cells, indicating that Sinkiangenone B could be an effective agent against human gastric cancer cells. We then took this compound as a potential therapeutic agent in gastric cancer treatment for further study. Sinkiangenone B could induce apoptosis in AGS cells with increased Bax/Bcl-2 ratios and induce G0/G1 phase arrest in cell cycle through the regulation of the G0/G1 phase checkpoint proteins. Therefore, Sinkiangenone B could be treated as a potential candidate for gastric cancer treatment for further study.Conflicts of interest
There are no conflicts to declare.Acknowledgements
This work was financially supported by the National Natural Science Foundation of China (81460661 and 81460586), National Mega-Project for Innovative Drugs (2012ZX09301-002-001 and 2011ZX09307-002-01), and the program for Innovative Research Team in IMPLAD.Notes and references
- Y. J. Yu, W. J. Sun, M. D. Lu, F. H. Wang, D. S. Qi, Y. Zhang, P. H. Li, H. Huang, T. You and Z. Q. Zheng, World J. Gastroenterol., 2014, 20, 18413–18419 CrossRef PubMed.
- M. Y. Xu, D. H. Lee, E. J. Joo, K. H. Son and Y. S. Kim, Food Chem. Toxicol., 2013, 59, 703–708 CrossRef CAS PubMed.
- R. Qin, H. Shen, Y. Cao, Y. Fang, H. Li, Q. Chen and W. Xu, PLoS One, 2013, 8, e76486 CAS.
- M. Iranshahi, S. T. Hosseini, A. R. Shahverdi, K. Molazade, S. S. Khan and V. U. Ahmad, Phytochemistry, 2008, 69, 2753–2757 CrossRef CAS PubMed.
- M. Iranshahy and M. Iranshahi, J. Ethnopharmacol., 2011, 134, 1–10 CrossRef CAS PubMed.
- M. Iranshahi, F. Kalategi, R. Rezaee, A. R. Shahverdi, C. Ito, H. Furukawa, H. Tokuda and M. Itoigawa, Planta Med., 2008, 74, 147–150 CrossRef CAS PubMed.
- M. Saleem, A. Alam and S. Sultana, Life Sci., 2001, 68, 1913–1921 CrossRef CAS PubMed.
- M. Mahmoud, S. Zahra, Z. T. R. Shahrzad and I. Mehrdad, Clin. Biochem., 2011, 44, S37 CrossRef.
- E. Valencia, M. Feria, J. G. Díaz, A. González and J. Bermejo, Planta Med., 1994, 60, 395–399 CrossRef CAS PubMed.
- Y. C. Xing, N. Li, D. Zhou, G. Chen, K. Jiao, W. L. Wang, Y. Y. Si and Y. Hou, Planta Med., 2017, 83, 135–142 CAS.
- L. Teng, G. Z. Ma, L. Li, L. Y. Ma and X. Q. Xu, Chem. Nat. Compd., 2013, 49, 606–609 CrossRef CAS.
- I. Pavlović, S. Petrović, M. Milenković, D. Nikolić and M. Niketić, Planta Med., 2009, 75, 1039 Search PubMed.
- F. Eftekhar, M. Yousefzadi and K. Borhani, Fitoterapia, 2004, 75, 758–759 CrossRef CAS PubMed.
- K. Tamemoto, Y. Takaishi, B. Chen, K. Kawazoe, H. Shibata, T. Higuti, G. Honda, M. Ito, Y. Takeda and O. K. Kodzhimatov, Phytochemistry, 2001, 58, 763–767 CrossRef CAS PubMed.
- M. Mazandarani, Z. Zeinali and M. Ghafourian, J. Biol. Chem., 2015, 275, 27901–27908 Search PubMed.
- A. Egber, A. Perevolotsky, R. Yonatan, A. Shlosberg, M. Belaich and S. Landau, Appl. Anim. Behav. Sci., 1998, 61, 51–62 CrossRef.
- M. Sayyah, A. Mandgary and M. Kamalinejad, J. Ethnopharmacol., 2002, 82, 105–109 CrossRef PubMed.
- M. Fatehi, F. Farifteh and Z. Fatehihassanabad, J. Ethnopharmacol., 2004, 91, 321–324 CrossRef PubMed.
- J. R. Yang, A. Zheng and Z. H. Li, Chem. Pharm. Bull., 2006, 54, 1595–1598 CrossRef CAS PubMed.
- Y. Shikishima, Y. Takaishi, G. Honda, M. Ito, Y. Takeda, M. Tori, S. Takaoka, O. K. Kodzhimatov and O. Ashurmetov, J. Nat. Prod., 2002, 65, 1897–1903 CrossRef CAS PubMed.
- M. H. Abd ElRazek, S. Ohta, A. A. Ahmed and T. Hirata, Phytochemistry, 2001, 58, 1289–1295 CrossRef CAS.
- G. Z. Li, J. C. Wang, X. J. Li, L. Cao, L. Gao, N. Lv and J. Y. Si, J. Asian Nat. Prod. Res., 2016, 18, 891–896 CrossRef CAS PubMed.
- G. Z. Li, X. J. Li, L. Cao, L. J. Zhang, L. G. Shen, J. Zhu, J. C. Wang and J. Y. Si, Fitoterapia, 2015, 103, 222–226 CrossRef CAS PubMed.
- G. Z. Li, X. J. Li, L. Cao, L. G. Shen, J. Zhu, J. Zhang, J. C. Wang, L. J. Zhang and J. Y. Si, Fitoterapia, 2014, 97, 247–252 CrossRef CAS PubMed.
- B. Ye, S. Wang and L. Zhang, Nat. Prod. Res., 2011, 25, 1161–1170 CrossRef CAS PubMed.
- K. H. Kim, S. K. Ha, S. U. Choi, S. Y. Kim and K. R. Lee, Planta Med., 2013, 79, 361–364 CrossRef CAS PubMed.
- B. L. Di, G. Pescitelli, C. Pratelli, D. Pini and P. Salvadori, J. Org. Chem., 2001, 66, 4819–4825 CrossRef.
- M. Górecki, A. Kamiñska, P. Ruœkowska, A. Suszczyñska and J. Frelek, Pol. J. Chem., 2006, 80, 523–534 Search PubMed.
- W. A. Siddiqui, A. Ahad and H. Ahsan, Arch. Toxicol., 2015, 89, 289–317 CrossRef CAS PubMed.
- C. Nie, J. Zhou, X. Qin, X. Shi, Q. Zeng, J. Liu, S. Yan and L. Zhang, Oncol. Rep., 2016, 35, 649–658 CrossRef CAS PubMed.
- J. Shen, Z. Xiao, W. K. Wu, M. H. Wang, K. F. To, Y. Chen, W. Yang, M. S. Li, V. Y. Shin and J. H. Tong, Cancer Res., 2015, 75, 754–765 CrossRef CAS PubMed.
- G. Wang, Y. Fu, G. Liu, Y. Ye and X. Zhang, Oncol. Res., 2017, 25, 355–364 CrossRef PubMed.
- N. N. Danial, Clin. Cancer Res., 2007, 13, 7254–7263 CrossRef CAS PubMed.
Footnote |
| † Electronic supplementary information (ESI) available. See DOI: 10.1039/c7ra13716h |
| This journal is © The Royal Society of Chemistry 2018 |