 Open Access Article
Creative Commons Attribution 3.0 Unported Licence
Coupling free energy and surface anchoring mechanism in gold nanorod–nematic liquid crystal dispersions†
Qi Wang a,
Liying Liu*a and
Lei Xu*ab
aKey Lab for Micro and Nanophotonic Structures (Ministry of Education), Department of Optical Science and Engineering, School of Information Science and Engineering, Fudan University, Shanghai 200433, China. E-mail: lyliu@fudan.edu.cn; leixu@fudan.ac.cn
bDepartment of Physics, Fudan University, Shanghai 200433, China
First published on 23rd January 2018
Abstract
The self-organizing properties of nematic liquid crystals (NLC) have been widely used to align anisotropic nanorods (NR) dispersed in them. The coupling interaction of the NR–NLC is an important parameter to determine the surface anchoring strength of GNRs in NLC. Herein, we have taken gold nanorods (GNRs) as a typical example to develop a method to measure the coupling free energy between the NRs and NLCs. By probing the magnetic Fréedericksz transition (MFT) thresholds of the doped-LC cells, the extraordinary increasing trend of MFT thresholds in the GNR–LC system can be explained by theory of the Landau–de Gennes free energy. The coupling coefficient γ of the binary composition and the anchoring energy W of the GNR surface were obtained by choosing proper limitations. Similarly, the MFT thresholds of gold nanospheres (GNSs) and other surfactant-capped GNR were measured for reference and comparison. In addition, response time measurements of the LC cells were carried out to prove the accuracy of the MFT thresholds. These results provide insight into the GNR–LC binary systems, and the technique can be extended to more NR–LC compositions.
I. Introduction
Realization of self-assembly for well-organized nanoparticles is always the core target in nanoscience.1–4 As anisotropic materials, nanorods need a specific and suitable medium to maintain their order and orientation.5,6 Liquid crystals (LCs), owing to their large anisotropy, shape-proximity to nanorods, and extreme sensitivity to small external perturbations, are a good surrounding to align the nanorods.7–10In the past few years, the gold nanorod (GNR)–liquid crystal (LC) composition as a typical case of NR–LC binary system has been studied from different perspectives.11,12 GNR can well-disperse and can be long-range ordered in nematic LC with no aggregation.13 The mixture can be realigned, just like pure LCs, under shearing and electric fields. Moreover, by choosing different aspect ratios of GNR or surfactants around the rods, NLC can be anchored in a parallel or homeotropic fashion on the surface of the nanorods;14,15 thus, the field-assisted alignment of GNR can be induced in selected NLCs. By utilizing the surface plasmon resonance of GNR, whose longitudinal SPR can be tuned in both the visible and infrared spectral range, electrically tunable plasmonic filters and polarizers can be fabricated.16,17 However, the mechanism for the alignment of GNR in NLC has not been examined from a free energy perspective, and the interaction between the GNR and NLC has not been studied.
In this study, we further explored the GNR–NLC system and focused on the free energy of the system and the coupling effect between the GNR and NLC.18 The interaction theory for ordered dispersion of an anisotropic rod-like nano-material in nematic hosts is applied in our case by giving Landau–de Gennes description of free energy.19 It is found that for higher concentrations of GNRs, the main change in free energy of the system is dominated by the coupling free energy term fGNR/NLC. Owing to this additional free energy, an extraordinary increase in the MFT threshold of the LC cell was observed as expected. By combining the GNR–NLC free energy model and the experimental result of the MFT threshold, both the coupling coefficient γ and the interface anchoring energy W were obtained.20 Gold nanospheres or GNRs with different surfactants were doped into a 5CB LC cell for comparison and reference.21 Time-resolved measurements of the GNR–NLC were carried out to verify the MFT threshold.
II. Theoretical background
A. Anchoring effect for a single GNR
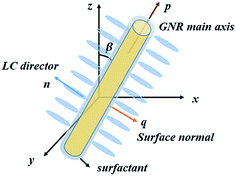
On the border of a single NR surface, the director of the LC will tend to be aligned along a certain direction due to the anchoring effect. Upon highly doping GNRs into NLCs, it is necessary to take the anchoring energy of the NLC molecules on the GNR surface into account. In this case, the anchoring effect will obey a Rapini–Papoular type of expression for the surface energy.22,23 By distinguishing the polar anchoring from the azimuthal anchoring, the surface energy W per unit area can be written as follows:
W = Wiso + Wpolar + Wazi = Wiso + Wα (![[p with combining right harpoon above (vector)]](https://www.rsc.org/images/entities/char_0070_20d1.gif) · ·![[n with combining right harpoon above (vector)]](https://www.rsc.org/images/entities/char_006e_20d1.gif) ) + Wβ ( ) + Wβ (![[q with combining right harpoon above (vector)]](https://www.rsc.org/images/entities/char_0071_20d1.gif) · ·![[n with combining right harpoon above (vector)]](https://www.rsc.org/images/entities/char_006e_20d1.gif) ) )
| (1) |
![[p with combining right harpoon above (vector)]](https://www.rsc.org/images/entities/char_0070_20d1.gif) ,
, ![[q with combining right harpoon above (vector)]](https://www.rsc.org/images/entities/char_0071_20d1.gif) , and
, and ![[n with combining right harpoon above (vector)]](https://www.rsc.org/images/entities/char_006e_20d1.gif) stand for the GNR main axis, GNR side surface normal, and director of the NLC, respectively. If Wpolar > Wazi, the NLC favors an alignment along the GNR main axis; for Wpolar < Wazi, the NLC preferentially aligns perpendicular to the surface of the rods. Both the perpendicular alignment to the surface of the rods or along the GNR main axis can be realized by surface modification with DMOAP (N,N-dimethyl-N-octadecyl-3-aminopropyl trimethoxysilyl-chloride) or PEG-SH (thiol-terminated methoxy-poly(ethylene glycol)),13,14 and the anchoring energies are enslaved by different surface modifiers (Fig. 1).
stand for the GNR main axis, GNR side surface normal, and director of the NLC, respectively. If Wpolar > Wazi, the NLC favors an alignment along the GNR main axis; for Wpolar < Wazi, the NLC preferentially aligns perpendicular to the surface of the rods. Both the perpendicular alignment to the surface of the rods or along the GNR main axis can be realized by surface modification with DMOAP (N,N-dimethyl-N-octadecyl-3-aminopropyl trimethoxysilyl-chloride) or PEG-SH (thiol-terminated methoxy-poly(ethylene glycol)),13,14 and the anchoring energies are enslaved by different surface modifiers (Fig. 1).
B. Pure LC cell with limited boundary under an external magnetic field
In all the experiments hereinafter, the LC cell is subjected to an external magnetic field H, which is parallel to the substrate, to induce the MFT into the LC. Thus, the total free energy function of pure LC cells under an external magnetic field per area on the substrate can be written as follows:3,22
 | (2) |
Using the variational method, we can obtain the Euler equation for the system in an equilibrium state:
 | (3) |
Under boundary conditions,
 | (4) |
| Hth = (π/d)(k33/χa)1/2 | (5) |
 | (6) |
 , and
, and  , B = (1 − k − 9u/4)/4,
  ,
,  .
.
As the magnetic field continues to increase to a saturation point (θ = π/2), the LC molecules will re-orient to the magnetic field director with the following free energy:
 | (7) |
In our experiment, we focused on the moment when the magnetic field was around the threshold point of the system. Then, fθ is only determined by H. Thus, we can plot a function curve for the change in the distortion free energy fθ of the LC cell with H based on first two parts of eqn (6). The third part of the anchoring energy can be obtained from the MFT experiment of the pure LCs.
C. Free energy for anisotropic GNR dispersions in NLC
For free energy theory of anisotropic GNR dispersions in NLC, the free energy per unit volume f = F/V of the binary compositions has three contributions:| f = fNLC + fGNR + fGNR/NLC | (8) |
Considering the coupling interaction between the GNR and the NLC host and inspired by Paul van der Schoot and coworker's method for carbon nanotubes dispersed in LC, the coupling free energy per unit volume is in the form of a Boltzmann description:23
 | (9) |
According to eqn (9), the coupling parameter has the following relation with SNLC, W, and D:23
| γ = 4SNLC−1W/3D | (10) |
Then, by substituting all three terms for free energy into the GNR–LC condition and with quantitative value calculation, we can derive that
 | (11) |
This means that as the doping concentration increases, the change in the coupling free energy takes the main role in the free energy change of the GNR–NLC mixture.
For doped-GNRs in the limited LC cells, the macroscopic distortion solution of the free energy will add an additional term that involves the coupling effect between the GNRs and LC molecules. We have already defined eqn (9) as the expression for the coupling term for GNR/LC per unit. Then, herein, for per area at the substrate, this term can be written as fGNR/NLC = sγϕd, in which s = −SNLCSGNR, γ is the coupling coefficient, ϕ is the volume fraction, and d is the thickness of the LC cell. Therefore, the distortion free energy of the doped-GNR LC cell can be written as follows:
 | (12) |
Eqn (12) indicates that the extra term for the coupling interaction is similar to an additional anchoring effect for the doped GNR LC cell, and more doped GNR will require a higher magnetic field to reach the MFT threshold of the LC cell. It is also worth noting that we only take into account the elastic free energy of the LC, and we speculate that the LC temperature is constant; thus, the change in the LC thermotropic free energy density can be ignored.
III. Experimental
A. Synthesis of the gold NRs
Seeded growth of colloidal GNR utilizing binary surfactant mixtures of cetyltrimethylammonium bromide (CTAB) and sodium oleate (NaOL) can improve the dimensional tunability and size uniformity of the GNRs.25 At first, for the preparation of the seed solution, 5 mL of 0.5 mM HAuCl4 was mixed with 5 mL of 0.2 M CTAB solution in a 20 mL scintillation vial. Fresh 0.01 M NaBH4 was diluted in 1 mL ice water and then injected into the Au(III)–CTAB solution. The solution changed from yellow to brownish yellow. For the growth solution, 7.0 g of CTAB and 1.2 g of NaOL were dissolved in 250 mL of warm water (50 °C). After the solution cooled down to 30 °C, 4 mM AgNO3 solution was added. The mixture was kept undisturbed at 30 °C for 15 min after 250 mL of 1 mM HAuCl4 solution was added. The solution became colorless after 90 min of stirring (700 rpm), and 1.5 mL of HCl (37 wt% in water) was then introduced to adjust the pH. After another 15 min of slow stirring at 400 rpm, 1.25 mL of 0.064 M ascorbic acid (AA) was added, and the solution was vigorously stirred for 30 s. Finally, 0.8 mL of seed solution was injected into the growth solution. The resultant mixture was stirred for 30 s and left undisturbed at 30 °C for 12 h for NR growth. The final products were isolated by centrifugation at 7000 rpm twice for 10 min to remove the supernatant.B. Synthesis of DMOAP-capped GNRs and doping of GNRs into 5CB LC
To realize the surface coating of DMOAP (N,N-dimethyl-N-octadecyl-3-aminopropyltrimethoxysilyl chloride), the GNRs needed a two-step method for their prior coating with silica.26 First, 0.1 M NaOH was added (under vigorous stirring) to 1 mL aqueous dispersion of GNRs with a longitudinal mode optical density (O.D.) of 10. Then, 50 μL of 2.5 vol% tetraethyl orthosilicate (TEOS) in ethanol was added under rapid stirring for 0.5 h, and the mixture was kept undisturbed for 24 h. After washing and centrifuging twice at 6000 rpm for 10 minutes, the GNR solution was diluted to 4 mL, and then, 400 μL of DMOAP was injected under stirring. The solution was kept stirring for 20 min, washed by centrifugation at 5000 rpm for 8 minutes twice to eliminate the excess DMOAP, and transferred into methanol. Capped-DMOAP GNRs were redispersed in methanol and mixed with 200 μL of nematic 4-cyano-4′-pentylbiphenyl (5CB), followed by full evaporation of the solvent within 1 h at 90 °C. By mixing and sonicating for 5 min at 40 °C to put LC in an isotropic state and then vigorously stirring the mixture while cooling down, an excellent dispersion of GNR in the LC phase was achieved.C. LC cell fabrication
K9 glass slides modified with DMOAP as the alignment surfactant were used as substrates for perpendicularly aligned LC cell. K9 glass slides with the dimensions of 32 × 25 × 0.5 mm were sonicated for 5 min by acetone, ethanol, and deionized water. The clean K9 glass slides were dipped in the DMOAP (wt 1% in water) aqueous solution for 30 min to assure a homeotropic LC alignment. After washing with deionized water to remove the redundant surfactant, the deposited-DMOAP slides were separated by a 100 μm thick mylar spacer and sealed with epoxy glue. Then, the GNR–LC composite was injected into the cell by capillary forces. We fabricated the LC cells with the doped weight ratios of 0.5%, 1%, 1.5%, 2%, and 5%. Formation of the nematic liquid crystal phase was confirmed by observing birefringence between crossed polarizers. The room temperature was maintained at 25(±2) °C to keep the 5CB in the nematic phase.D. Characterization
Steady-state ultraviolet-visible (UV-vis) absorption spectra of GNRs were obtained using a spectrophotometer (Shimadzu UV-3100). Both the spectra of DMOAP-capped GNR in water and those of the doped-GNR LC cells with different doping weight ratios were obtained. From the absorption spectrum, we can ensure that the orientation of the nanorods was orthogonal to the nematic LC director; thus, a strong longitudinal surface plasmon resonance (LSPR) at 810 nm was triggered by the probe light. Experiment shows that the LSPR redshifts when the GNRs are in the LC; this indicates that the GNRs experience a higher surrounding refractive index in LC than that in water. When the weight ratio reached 5%, the spectra showed a broad saturation absorbance around 810 nm, and the FWHM of the LSPR peak broadened; this meant that a high number of the GNRs in LC had broken the ordered alignment, and scattering was strongly enhanced. Transmission electron microscopy (TEM) was performed using a JEOL 2000FX microscope to determine the morphology of the GNRs, as shown in Fig. 2(b). GNRs with an average length of 69.9 nm and diameter of 23.4 nm have an LSPR wavelength around 810 nm.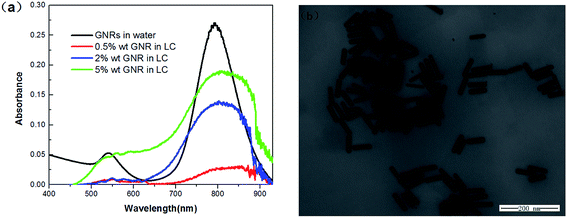 | ||
| Fig. 2 (a) Absorption spectra of GNR in water or doped at various concentrations in a 5CB LC cell. (b) The TEM image of GNR deposited on a copper net. | ||
E. Magnetic Kerr Effect (MKE) experimental setup
The MFT of an LC cell is probed by optical birefringence, as shown in Fig. 3(a). A linearly polarized 632.8 nm He–Ne laser was used as the probe light, with an intensity of 0.05 mW and spot diameter of 26 μm that caused almost no effect on the LC molecules. The LC cell is set between orthogonal polarizers. When the MFT occurs in the LC cell, the dielectric anisotropy of the LC will lead to LC cell birefringence, and residual light passes through. The transmitted probe beam is collected by a photon detector (silicon photodiode) connected to an oscilloscope (TechtronixTDS3012).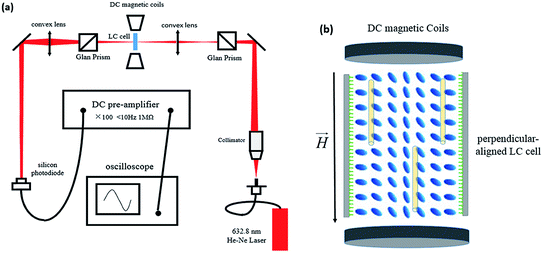 | ||
| Fig. 3 (a) Setup for the Magnetic Kerr Effect (MKE) experiment. (b) Schematic of an LC cell under a magnetic field. | ||
IV. Result and discussion
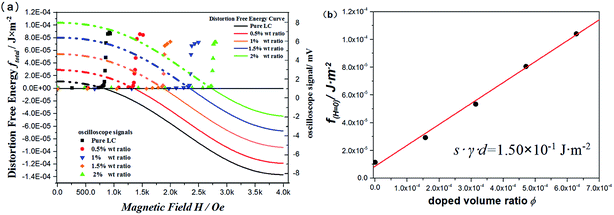
The experimental measurement of the MFT threshold from the oscilloscope is shown by dots in Fig. 4(a). When the magnetic field increases to the MFT threshold of the LC cell, the LC molecules will try to rotate in response to the external stimulus, and the LC birefringence will cause a significant increase in the transmitted light; hence, the MFT threshold can be obtained. We notice that as the doping ratio increases, the MFT threshold value increases dramatically. When the doping weight ratio reaches 2%, the MFT threshold is almost 3.5 times that of the pure LC cell; this significant increase is mainly due to the coupling interaction between the GNRs and the LC molecules.As abovementioned, before H reaches the MFT threshold, the system is under uniform conditions, and its uniform free energy ftotal = 0. In addition, based on eqn (12), we know the first two part of the distortion free energy exactly, and the third part of anchoring and fourth part of coupling do not depend on H. Hence, in Fig. 4(a), we can confirm the curves of distortion free energy ftotal with the general shapes predicted by eqn (12) by crossing these curves through the MFT threshold points (significant signal rise positions); this indicates that the LC cell starts to undergo the magnetic Fréedericksz transition at this point. Moreover, from eqn (12), the distortion free energy ftotal at H = 0 refers to only the anchoring term and coupling term. Therefore, we used Fig. 4(b) to plot ftotal (H = 0) versus doping concentration. Since the anchoring term is independent of the doping ratios, we can fit the anchoring and coupling terms with the doping ratios as
| fH=0 = Wsubstrate anchoring + sγϕd | (13) |
With the increasing doping ratios, the coupling of the GNR to the LC host fluid also increases, and the free energy of the system undergoes a linear growth before reaching a saturated doping ratio (in our experiment 5% weight ratio is over-saturation). By linearly fitting the points, the slope of the line comes out as sγd. The thickness of the LC cell is maintained at 100 μm such that the coupling coefficient γ = 1.50 × 10³ J m−3. According to eqn (10) (γ = 4SNLC−1W/3D), the anchoring energy at the GNR surface W depends on the coupling coefficient γ and the diameter of GNR. Thus, we can calculate the GNR surface anchoring energy to be W = 1.35 × 10⁻⁵ J m−2, indicating that DMOAP provides strong anchoring conditions for the GNR–LC interface. On the other hand, the intercept of the fitting line gives Wsubstrate anchoring = 1.05 × 10⁻⁵ J m−2, which agrees with our independent measurement of Wsubstrate anchoring = 1.02 × 10⁻⁵ J m−2 based on
 | (14) |
The LC response time measurements can provide an independent measure value of the MFT threshold. The response time of an LC cell depends on the external applied field and can be obtained from the dynamic time response of transmitted light from crossed polarizers.27 Under the conditions of our experiments, the nematic LCs are vertically aligned (VA) on the surface, and zero pretilt angles are set up at the surface boundaries. Supposing that a VA cell is initially biased with a magnetic field (H) that is not too far above Hth and according to the Erickson–Leslie equation, the transmittance I(t) is
 | (15) |
Upon removing the magnetic field (H), the transmittance during the LC cell decay process is
 | (16) |
In these equations, τ0 is the LC director reorientation decay time and has the form τ0 = γ1d2/π2K33, where γ1 is the rotational viscosity, and τr is the LC director reorientation rise time:
 | (17) |
δ0 is the net phase change, Ø∞ is the steady-state tilt angle of the LC directors in response to the applied H, and Ø0 is the initial director fluctuation. Eqn (16) can be re-written as
 | (18) |
During the measurements, the LC cell is optically pumped when a specific H is applied. The response times are obtained using a digital multi-meter connected to the photodiode. The rise and decay process is measured by applying and removing the magnetic field. τr and τ0 can be obtained by fitting the measured time t into eqn (15) and (16) for either the rise or the decay process. In Fig. 5(a), the rise and decay process of a 0.5% doped LC cell is given as an example. In each doped sample, τ0 does not change with H, whereas τr depends on H. As an example, Fig. 5(b) plots the relation of (τ0/τr + 1)1/2 with H for a 0.5% doped LC cell; other LC cells will have similar linear dependences with a higher magnetic field H. Therefore, an estimated MFT threshold is deduced for every LC cell. The outcomes are listed in Table 1. We can see that the estimated threshold Hth agrees well with the previous direct measurement results shown in Fig. 4(a). It is also noteworthy that higher doping ratios of GNR in LC show a longer decay time τ0, which can be attributed to the LC order parameter reduction and higher rotational viscosity γ1.
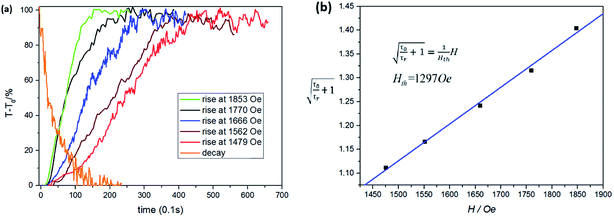 | ||
| Fig. 5 (a) 0.5% doped LC cell rise and decay process with time-resolved measurement. (b) Typical linear relation between (τ0/τr + 1)1/2 and the magnetic field H for a 0.5% doped LC cell. | ||
| LC cell/weight ratio | τ0/s | Estimated threshold Hth/Oe | Previous threshold Hth in Fig. 4(a)/Oe |
|---|---|---|---|
| Pure | 11.8 | 852 | 831 |
| 0.5% | 12.7 | 1297 | 1265 |
| 1% | 14.6 | 1892 | 1825 |
| 2% | 17.9 | 3015 | 2910 |
Similar to the DMOAP-capped GNRs, gold nanomaterials of other shapes or surfactants can self-assemble in 5CB LC at high concentrations (herein, GNS is at most 0.5% wt and PEG-GNR at 2% wt). We prepared LC dispersions of gold nanospheres (GNS) and PEG-capped gold nanorods (PEG-GNR) to further reveal the nature of the coupling effect. The preparation of GNS in 5CB LC is carried out according to S. Khatua's methodology,28 in which 6 nm gold nanospheres form highly stable solutions in 5CB LC by functionalization with 4-sulfanylphenyl-4-[4(octyloxy)phenyl]benzoate (SOPB). Moreover, ordered PEG-GNR dispersions in LC with tangential boundaries have been realized by following the Liu's work.29 The synthesis of GNRs is identical to that of DMOAP-GNRs to maintain the same shapes and initial conditions. By choosing the PEG-SH terminal groups, the main axis of the gold nanorods will show the same orientation as the LC director. We have provided the UV-vis absorption spectra for all types of doped LC cells in Fig. 6(a). It is found that the GNSs have a strong SPR at 550 nm, which is due to their 6 nm spherical shape. The PEG-GNRs have a strong transverse SPR at 560 nm and a weak longitudinal SPR at 810 nm. This means that in a vertical-aligned LC cell, the main axis of the GNR tends to be perpendicular to the substrate and shows little longitudinal SPR.
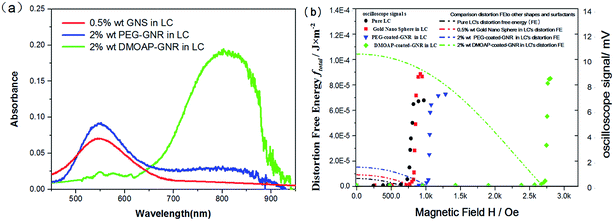 | ||
| Fig. 6 (a) Absorption spectra of gold nanomaterials doped in a 5CB LC cell. (b) Dependence of induced optical birefringence signals and simulated free energy ftotal with the pump intensity H. | ||
We used the same experimental setup for the MFT measurements of the LC cell with both GNSs and PEG-GNRs. The outcome is demonstrated in Fig. 6(b). The presence of various nanoparticles in a liquid crystal has been shown to alter the threshold magnetic field in different ways. An enhancement of the magnetic anisotropy due to 6 nm metallic particles is responsible for the slight decrease trend for the GNS samples. Their small size only causes nanometer-scale defects, and the coupling effect can almost be neglected. The magneto-optical properties of PEG-GNRs show the same increase trend as DMOAP-GNRs. We can apply the same process to obtain the PEG-GNR coupling coefficient γ = 1.12 × 10² J m−3 and anchoring energy W = 9.93 × 10⁻⁷ J m−2. The significant reduction in W for PEG-GNRs implies that silica and DMOAP two step-capped GNRs provide strong anchoring conditions, whereas PEG-SH, owing to its long carbon chain and tangential boundary, only provides weak anchoring conditions.
V. Conclusion
In summary, we have successfully developed an approach to measure the anisotropic anchoring strength of NRs in an LC host. As a typical case, by utilizing perpendicular alignment of GNR dispersed in a thermotropic LC and measuring the MFT thresholds of the LC cell, the coupling coefficient of the GNR-doped LC is deduced. Combining the Landau–de Gennes free energy theory of the binary mixture of GNR and LC, an internal view of LC and NR coupling interaction is obtained, and the anchoring energy between the LC and NR can be derived. The response time data of the doped LCs has been provided as additional confirmation for the threshold measurement. This method can be further extended to other nanorod–LC systems (such as CdS30 or CNT) to derive their coupling coefficients. The properties of binary GNR–LC mixtures can provide a great potential for the design and realization of new devices28,29 for guest–host optoelectronics and display applications.Conflicts of interest
There are no conflicts to declare.Acknowledgements
This work was supported in part by the National Natural Science Foundation of China (Grants No. 61327008, No. 11474070), and Specialized Research Fund for the Doctoral Program of Higher Education (Grant No. 20130071130004). We thank Professor Zongzhi Zhang for the help with the MFT measurements.References
- J. A. Fan, C. Wu, K. Bao, J. Bao, R. Bardhan, N. J. Halas, V. N. Manoharan, P. Nordlander, G. Shvets and F. Capasso, Science, 2010, 328, 1135–1138 CrossRef CAS PubMed.
- J. Kao, K. Thorkelsson, P. Bai, B. J. Rancatore and T. Xu, Chem. Soc. Rev., 2013, 42, 2654–2678 RSC.
- J. Shan, W. Shi, L. Y. Liu, Y. R. Shen and L. Xu, Phys. Rev. Lett., 2012, 109, 147801 CrossRef CAS PubMed.
- X. Zheng, J. Fontana, M. Pevnyi, M. Ignatenko, S. Wang, R. Vaia and P. Palffy-Muhoray, J. Mater. Sci., 2012, 47, 4914–4920 CrossRef CAS.
- X. Huang, S. Neretina and M. A. El-Sayed, Adv. Mater., 2009, 21, 4880–4910 CrossRef CAS PubMed.
- C. J. Murphy, T. K. Sau, A. M. Gole, C. J. Orendorff, J. Gao, L. Gou, S. E. Hunyadi and T. Li, J. Phys. Chem. B, 2005, 109, 13857–13870 CrossRef CAS PubMed.
- T. A. Wood, J. S. Lintuvuori, A. B. Schofield, D. Marenduzzo and W. C. K. Poon, Science, 2011, 334, 79–83 CrossRef CAS PubMed.
- H. K. Bisoy and S. Kumar, Chem. Soc. Rev., 2011, 40, 306–319 RSC.
- G. M. Koenig, J. J. de Pablo and N. L. Abbott, Langmuir, 2009, 25, 13318–13321 CrossRef CAS PubMed.
- V. Tomar, T. F. Roberts, N. L. Abbott, J. P. Hernandez-Ortiz and J. J. de Pablo, Langmuir, 2012, 28, 6124–6131 CrossRef CAS PubMed.
- S. Umadevi, X. Feng and T. Hegmann, Adv. Funct. Mater., 2013, 22, 1393–1403 CrossRef.
- S. Sridevi, S. K. Prasad, G. G. Nair, V. D. Britto and B. L. V. Prasad, Appl. Phys. Lett., 2010, 97, 151913 CrossRef.
- Y. Zhang, Q. Liu, H. Mundoor, Y. Yuan and I. I. Smalyukh, ACS Nano, 2015, 9, 3097–3108 CrossRef CAS PubMed.
- G. H. Sheetah, Q. Liu and I. I. Smalyukh, Opt. Lett., 2016, 41, 4899–4902 CrossRef PubMed.
- B. Senyuk, D. Glugla and I. I. Smalyukh, Phys. Rev. E: Stat., Nonlinear, Soft Matter Phys., 2013, 88, 062507 CrossRef PubMed.
- C. W. Hsu, B. Zhen, W. Qiu, O. Shapira, B. G. DeLacy, J. D. Joannopoulos and M. Soljacic, Nat. Commun., 2014, 5, 3152 Search PubMed.
- T. Ellenbogen, K. Seo and K. B. Crozier, Nano Lett., 2012, 12, 1026–1031 CrossRef CAS PubMed.
- P. Schoot, V. Popa-Nita and S. Kralj, J. Phys. Chem. B, 2008, 112, 4512–4518 CrossRef PubMed.
- P. G. de Gennes and J. Prost, The Physics of Liquid Crystals, Clarendon: Oxford, U.K., 1995, pp. 53–66 Search PubMed.
- X. Nie, R. Lu, H. Xian, T. X. Wu and S.-T. Wu, J. Appl. Phys., 2007, 101, 103110 CrossRef.
- J. P. F. Lagerwall and G. Scalia, J. Mater. Chem., 2008, 18, 2890 RSC.
- H. L. Ong, Phys. Rev. A, 1986, 33, 3550 CrossRef CAS.
- V. Popa-Nita and S. Kralj, Opt. Lett., 2010, 132, 024902 CAS.
- R. G. Horn, J. Phys., 1978, 39, 105–109 CAS.
- X. Ye, C. Zheng, J. Chen, Y. Gao and C. B. Murray, Nano Lett., 2013, 13, 765–771 CrossRef CAS PubMed.
- W. C. Wu and J. B. Tracy, Chem. Mater., 2015, 27, 2888 CrossRef CAS PubMed.
- H. Wang and T. X. Wu, J. Appl. Phys., 2004, 95, 5502 CrossRef CAS.
- S. Khatua, P. Manna, W.-S. Chang, A. Tcherniak, E. Friedlander, E. R. Zubarev and S. Link, J. Phys. Chem. C, 2010, 114, 7251–7257 CAS.
- Q. Liu, Y. Yuan and I. I. Smalyukh, Nano Lett., 2014, 14, 4071–4077 CrossRef CAS PubMed.
- A. A. Ezhov, G. A. Shandryuk, G. N. Bondarenko, A. S. Merekalov, S. S. Abramchuk, A. M. Shatalova, P. Manna, E. R. Zubarev and R. V. Talroze, Langmuir, 2011, 27, 13353–13360 CrossRef CAS PubMed.
Footnote |
| † Electronic supplementary information (ESI) available. See DOI: 10.1039/c7ra09378k |
| This journal is © The Royal Society of Chemistry 2018 |

