
 Open Access Article
 This Open Access Article is licensed under a Creative Commons Attribution-Non Commercial 3.0 Unported Licence
Trends in C–O and N–O bond scission on rutile oxides described using oxygen vacancy formation energies†
Hai-Yan
Su
 ab,
Xiufang
Ma
c,
Keju
Sun
*d,
Chenghua
Sun
ae,
Yongjun
Xu
a and
Federico
Calle-Vallejo
*f
ab,
Xiufang
Ma
c,
Keju
Sun
*d,
Chenghua
Sun
ae,
Yongjun
Xu
a and
Federico
Calle-Vallejo
*f
aSchool of Chemical Engineering and Energy Technology, Dongguan University of Technology, Dongguan, 523808, China
bState Key Laboratory of Molecular Reaction Dynamics, Dalian Institute of Chemical Physics, Chinese Academy of Science, Dalian, 116023, China
cShenzhen Key Laboratory of Advanced Thin Films and Applications, College of Physics and Optoelectronic Engineering, Shenzhen University, Shenzhen, 518060, China
dKey Laboratory of Applied Chemistry, College of Environmental and Chemical Engineering, Yanshan University, 438 Hebei Avenue, Qinhuangdao, 066004, China. E-mail: kjsun@ysu.edu.cn
eCentre for Translational Atomaterials, Swinburne University of Technology, Hawthorn, Victoria 3122, Australia
fDepartament de Ciència de Materials i Química Física, Institut de Química Teòrica i Computacional (IQTCUB), Universitat de Barcelona, Martí i Franquès 1, 08028 Barcelona, Spain. E-mail: f.calle.vallejo@ub.edu
First published on 23rd March 2020
Abstract
Reactivity trends on transition metals can generally be understood through the d-band model, but no analogous theory exists for transition metal oxides. This limits the generality of analyses in oxide-based catalysis and surface chemistry and has motivated the appearance of numerous descriptors. Here we show that oxygen vacancy formation energy (ΔEVac) is an inexpensive yet accurate and general descriptor for trends in transition-state energies, which are usually difficult to assess. For rutile-type oxides (MO2 with M = 3d metals from Ti to Ni), we show that ΔEVac captures the trends in C–O and N–O bond scission of CO2, CH3OH, N2O, and NH2OH at oxygen vacancies. The proportionality between ΔEVac and transition-state energies is rationalized by analyzing the oxygen–metal bonds, which change from ionic to covalent from TiO2 to NiO2. ΔEVac may be used to design oxide catalysts, in particular those where lattice oxygen and/or oxygen vacancies participate in the catalytic cycles.
1. Introduction
With the advent and increase in the use of Density Functional Theory (DFT), the theoretical description of catalytic reactions has experienced great advances.1–3 The properties at the atomic scale that determine the macroscopic kinetics have been established in numerous cases and some key descriptors, such as adsorption energies of intermediates,1,4 band centers,1 and coordination numbers,5,6 among others,7 have been identified to correlate with the catalytic activity. All this has substantially facilitated the rapid screening and in silico design of a large number of new materials.However, the advancements pertain mostly to metals and many fundamental properties of the surfaces of metal oxides are still poorly understood due to their inherent complexity. This is because oxide properties depend on the interplay between the geometric structure, the band structure, the local stoichiometry of the surface and the oxidation states of the components.8 In this context, a great challenge is the elaboration of an atomic-scale surface chemistry theory for metal oxides3,9 as comprehensive as the d-band model for transition metals.1 Such a theory would undoubtedly be the groundwork for the rational design of metal oxide catalysts.
Numerous studies have been conducted to identify the key factors that affect the activity of oxide surfaces. For instance, Shao-Horn et al. showed that the oxygen evolution activity of perovskite oxides exhibits a volcano-shaped dependence on the occupancy of the eg orbitals, with the peak activity achieved at an eg occupancy close to unity.10 Similarly, Rossmeisl et al. proposed the concept of outer electrons to capture the trends in adsorption energies of metals, rock-salt monoxides, and perovskites altogether.11 Jiang et al. proposed an adjusted coordination number as a general descriptor for the H adsorption energy and C–H activation energies over surface facets and defects of V2O3, Cr2O3, Co3O4, and NiO.12 Furthermore, Morgan et al. reported that the experimentally measured area specific resistance and oxygen surface exchange of perovskites are well correlated with the DFT-calculated oxygen p-band center and vacancy formation energy.13 Similarly, Dickens et al. reported a correlation between the average energy of adsorbed oxygens' 2p states and their reactivity at transition metals and some oxides.14 Hinuma et al. also reported fair correlations between oxygen vacancy formation energies and various adsorption energies.15
In addition, the versatile Brønsted–Evans–Polanyi (BEP) relation observed on metals is often found on rutiles and perovskites. This relation, which correlates elementary reaction thermodynamics and kinetics, seems to be universal on metals16,17 but not on oxides, as it depends on the type of oxide, the active site and the dissociating molecules.18
Since the structural complexity of oxides appears to prevent the elaboration of universal descriptors, a viable strategy is to establish links between macroscopic functionality and atomic-scale properties for a given family of oxides.
The rutile TiO2(110) surface is considered a prototypical system for metal oxide surfaces because of its rich surface chemistry and numerous applications in heterogeneous catalysis, photocatalysis, and gas sensors.19–22 The surface reactivity of TiO2(110) has been shown to be mainly controlled by defects, particularly oxygen vacancies.23 The latter can either modify the behavior of neighboring metal sites or themselves act as active sites for many surface reactions, such as water dissociation and CO oxidation.24–27 Other rutile oxides such as SnO2, CeO2, IrO2, RuO2 and MnO2 have interesting applications in (electro)catalysis and gas sensing.28–35 It has been argued that lattice oxygen may play a central role in the catalytic properties of some oxides,36–41 typically via Mars/van Krevelen mechanisms in which oxygen vacancies are generated after lattice oxygen combines with reactants and/or intermediates.42 Therefore, it is crucial to understand how oxygen vacancies affect the adsorption properties and catalytic activity of rutile oxide surfaces.
Using C–O and N–O bond scission in CO2, CH3OH, N2O and NH2OH as probe reactions, we show here that oxygen vacancy formation energy is a simple and robust descriptor for the bond-scission kinetics at oxygen vacancies of rutile-type MO2(110) (M = 3d metals from Ti to Ni) surfaces. The results are useful for catalytic reduction of greenhouse gases such as N2O43 and CO2,44,45 CH3OH photocatalytic oxidation,46 and NH2OH electrochemistry.47
Our results allow linking the adsorption energies of stationary and saddle points, which are difficult or currently impossible to measure48 and tedious to calculate, to a single, computable and experimentally available descriptor for numerous oxide materials, namely oxygen vacancy formation energies. This can potentially streamline the fundamental understanding and rational design of oxide catalysts.
2. Methods
Spin-unrestricted DFT calculations were performed using the VASP49 with PBE.50 The interaction between the ionic cores and electrons was described by the projector-augmented wave (PAW) method,51 and the Kohn–Sham valence electronic wave function was expanded in a plane-wave basis set with a kinetic energy cutoff of 400 eV. (2 × 1) 4-layer (110) slabs for MO2 rutile oxides were used, separated by 15 Å of vacuum. The two bottommost layers were fixed at the bulk distances, and the two topmost layers and the adsorbates were fully relaxed. The Brillouin zones were sampled with 6 × 4 × 1 Monkhorst–Pack grids.52 The calculated lattice constants of the MO2 oxides fall in the regions 4.31 Å ≤ a ≤ 4.67 Å and 2.80 Å ≤ c ≤ 2.97 Å, which agree well with the experimental values, as listed in Table S1.† The adsorption energy (ΔEAds) was calculated using the most stable configurations (EMO2−v+moiety) relative to the clean surfaces (EMO2−v) and the isolated molecules or their scission moieties (Emoiety):| ΔEAds = EMO2−v+moiety − EMO2−v − Emoiety | (1) |
We have also considered the effect of dispersion corrections for the particular case of ΔEAds(CO2).53 It can be seen from Table S2 and Fig. S1b† that the corrections only shift the adsorption energies downwards by 0.19 eV on average, without altering the overall trend.
Enthalpy changes (ΔH) are usually approximated as: ΔH ≈ ΔE + ΔZPE (ZPE: zero-point energy). For adsorbate *AB, one has: ZPEAB ≈ ZPEA + ZPEB, so that for dissociation reactions ΔZPE ≈ 0 and ΔHDiss ≈ ΔEDiss. For *CH3OH at NiO2(110), ZPECH3OH, ZPEOH and ZPECH3 are 1.42, 0.38 and 0.97 eV. Thus, ΔZPE = 0.07 eV, which is negligible considering the accuracy of DFT and BEP relations. Besides, the ZPEs do not appreciably change among rutile oxides: ZPECH3OH is 1.42 eV on both NiO2(110) and TiO2(110). Thus, including ZPEs will not sizably affect the BEP relations reported here. In this order of ideas, the reaction energy (ΔHDiss) of elementary reactions was approximated as:
| ΔHDiss ≈ ΔEDiss = EFS − EIS | (2) |
All transition states (TSs) were located by the force reversed method54 and the climbing-image nudged elastic band method (CI-NEB)55 and confirmed by vibrational frequency analysis. The relaxations stopped when the residual forces on each atom were smaller than 0.03 eV Å−1. The elementary activation barrier (ΔEAct) was calculated using the TS (ETS) with respect to the most stable configurations for the adsorption of species at the IS (EIS):
| ΔEAct = ETS − EIS | (3) |
The formation energy of a surface oxygen vacancy (ΔEVac) is:
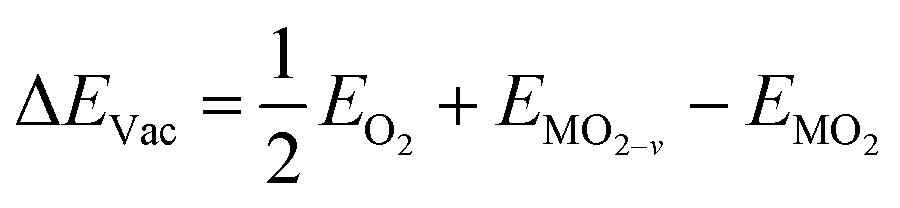 | (4) |
 , EMO2−v and EMO2 are half the energy of molecular oxygen and the energies of the defective and pristine rutile slabs, respectively. We calculated
 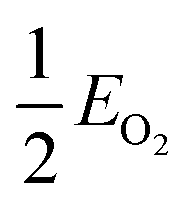 using the DFT-assessed free energies of H2 and H2O and the experimental free energy change of the reaction
 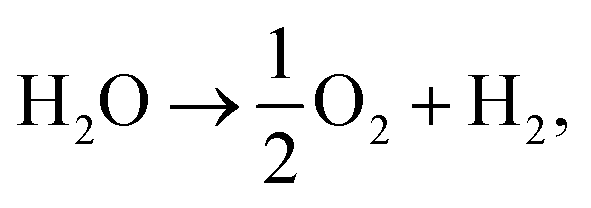 which is 2.46 eV. This is done to avoid the direct calculation of the total energy of O2,56,57 which is generally problematic within the DFT formalism.58 All the adsorption, reaction, activation, and vacancy formation energies are found in Tables S3–S5.†
We note that some oxides such as CoO2 and NiO2 may not exhibit the rutile phase under catalytic conditions. However, this does not affect the main purpose of this work, which is the identification and description of general reactivity trends for an important family of oxides.
3. Results and discussion
As shown in Fig. 1a, there is a linear Brønsted–Evans–Polanyi (BEP)-type relationship59 between activation energies (ΔEAct) and reaction energies (ΔEDiss) for CO2, CH3OH, N2O and NH2OH dissociation (see the reactions in Fig. 1a) at the bridge oxygen vacancy on the rutile (110) surfaces. This suggests that scission kinetics and thermodynamics are proportional and well correlated in this case.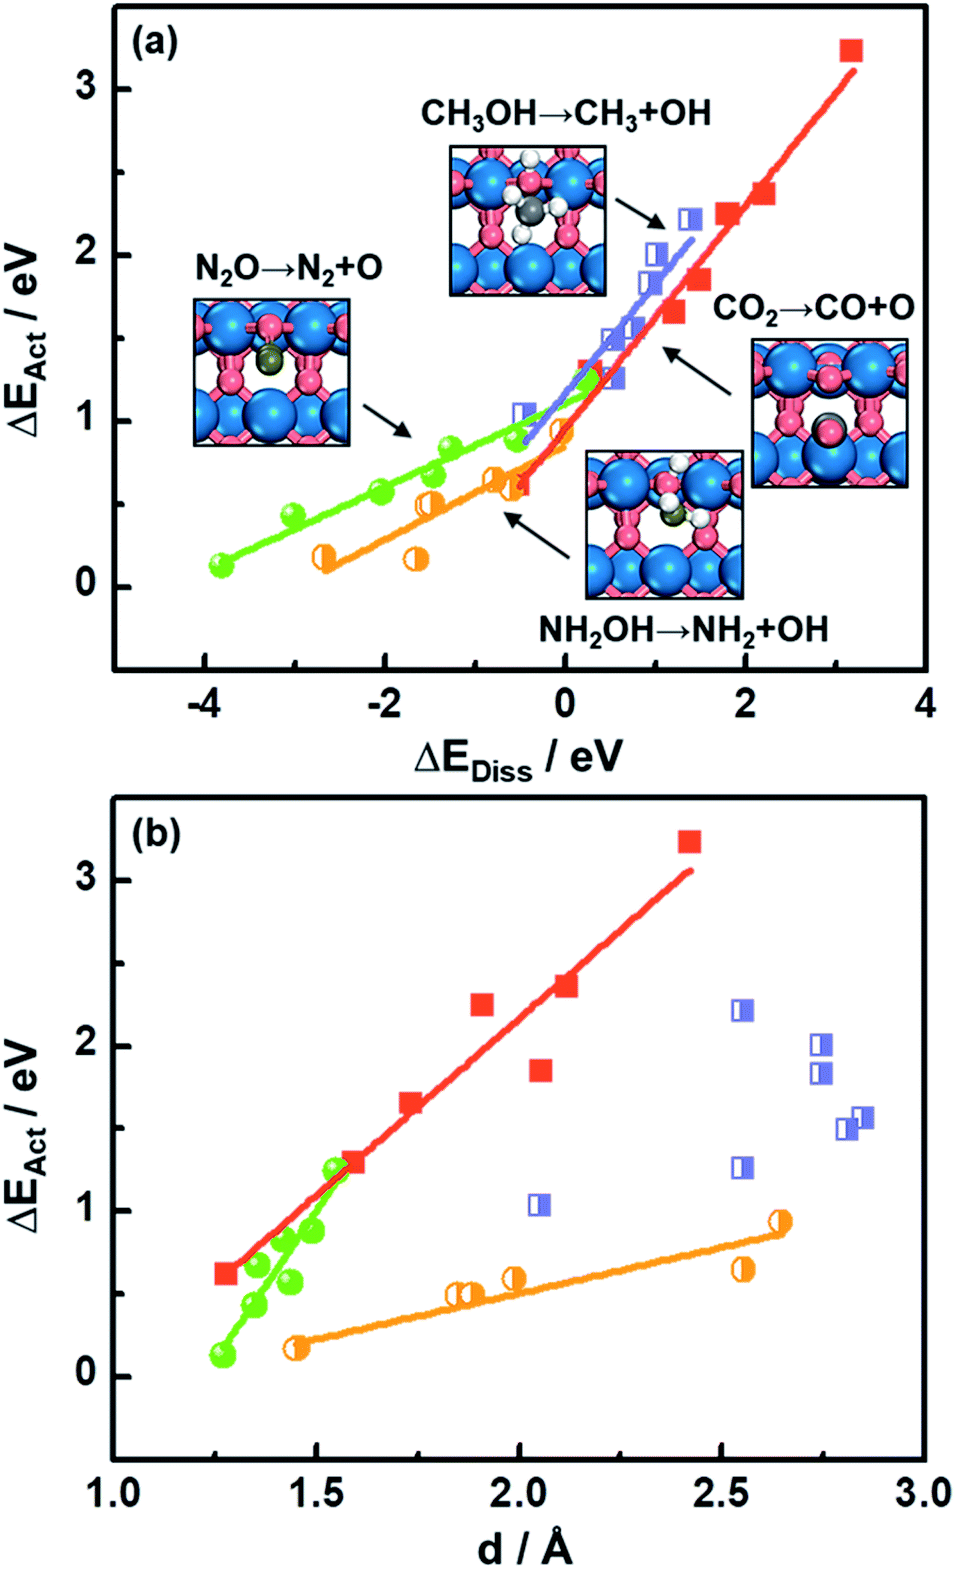 | ||
| Fig. 1 Activation energies (ΔEAct) for C–O and N–O bond scissions as a function of (a) reaction energies (ΔEDiss) and (b) the C–O or N–O distances (d) at the transition states on rutile MO2(110) surfaces. Insets: transition-state structures for C–O and N–O bond scission. Blue, vermilion, grey, ochre and white balls represent 3d metals (Ti–Ni) and O, C, N and H atoms, respectively. | ||
Compared to CO2 and CH3OH decomposition (−0.51 eV ≤ ΔEDiss ≤ 3.19 eV; 0.62 eV ≤ ΔEAct ≤ 3.23 eV), N2O and NH2OH decomposition is generally more exothermic (−3.80 eV ≤ ΔEDiss ≤ 0.23 eV), and the corresponding ΔEAct values are lower, falling in the range of 0.13–1.25 eV (see Table S3† for the specific values). A good relationship is also observed for CO2, N2O and NH2OH dissociation barriers and the transition-state geometries, represented by N–O or C–O bond lengths (d in Fig. 1b and Table S3†). Briefly, the shorter the N–O or C–O bond length at the TS, the lower the barrier, which agrees well with previous DFT study results for CO oxidation on metals and metal oxides.18,60
Identifying a BEP relationship enables relatively fast assessment of catalytic activities by using the reaction energy ΔEDiss as a descriptor for trends in transition-state (TS) barriers. Nevertheless, we note that calculating ΔEDiss, which involves both initial (IS) and final (FS) states (eqn (2)), is still a demanding task when dealing with a great number of systems and/or large unit cells. In the following, we will show that more affordable and experimentally available descriptors exist.
In Fig. 2 we plot the adsorption energies ΔEAds of CO2, CH3OH, N2O and NH2OH and their cleaved moieties against ΔEDiss. Fig. 2 and Table S4† show that the ISs for CO2, CH3OH, N2O and NH2OH decomposition are almost independent of the chemical nature of the element M in MO2. To illustrate this, consider the case of CO2: the adsorption energies (ΔEAds) vary only by ∼0.25 eV on the bridge oxygen vacancy of the analyzed rutile surfaces, but ΔEDiss changes by ∼3.7 eV (see the values in Tables S3 and S4† and the structures in Fig. S3†).
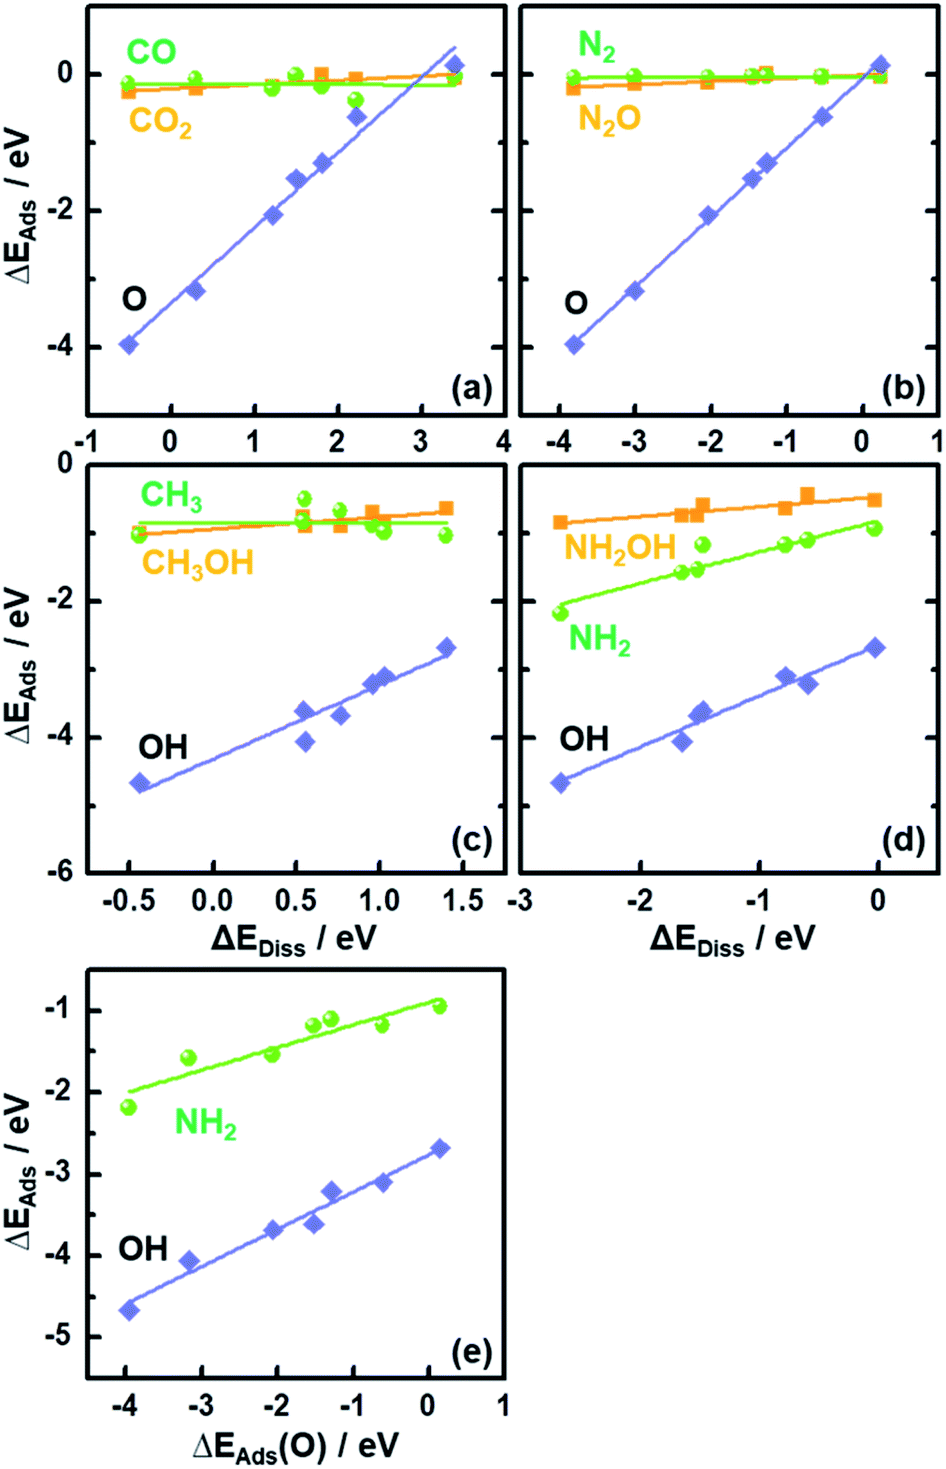 | ||
| Fig. 2 Adsorption energies (ΔEAds) of reactants and products of C–O bond scission for (a) CO2 and (c) CH3OH and N–O bond scission for (b) N2O and (d) NH2OH plotted as a function of the reaction energies (ΔEDiss) on MO2(110). (e) ΔEAds of NH2 and OH plotted against that of O. | ||
The results in Fig. 2 suggest that, as the adsorption energies of initial states (ISs) are nearly constant, the trends in ΔEDiss (eqn (2)) are mainly determined by the final states (FSs).
The downward shift of the FS curve can lead to more negative ΔEDiss and to the shift of the reaction coordinate of the transition state closer to the ISs.59 This explains the relationship between ΔEAct and N–O or C–O bond distance d at the TSs in Fig. 1b well. The deviation from the linear trend of ΔEActvs. d in the case of CH3OH dissociation is justified by the surface reconstruction of CoO2(110) and NiO2(110).
Compared to the trivial molecular adsorption at the ISs shown in Fig. 2 and Table S4,† the trends in dissociative adsorption, i.e. the FSs, are slightly more elaborate. We have identified two groups in the trends: (1) intermediates such as *CO, *N2 and *CH3 adsorbed at the coordinatively unsaturated 3d metals on the FSs do not exhibit strong dependence on the chemical nature of M (Fig. S3b, e and g†). (2) *O, *OH and *NH2 adsorption at the bridge oxygen vacancy and coordinatively unsaturated 3d metals on the FSs are oxide-dependent (Fig. S3c, h and j†), with the largest differences in ΔEAds being 4.10, 1.98 and 1.25 eV, respectively (see Table S4†).
Since ΔEAds(OH) and ΔEAds(NH2) scale linearly with ΔEAds(O), as shown in Fig. 2e, the trends in ΔEDiss for the C–O and N–O bond scission reactions are modulated by a single metal-dependent parameter, namely ΔEAds(O). Since creating an oxygen vacancy is the reverse process of oxygen adsorption at such a vacancy, we have: ΔEAds(O) = −ΔEVac, see eqn (1) and (4). This is important, as ΔEVac is a common parameter for oxide systems.
Recapitulating, transition-state energies and reaction energies are connected through a linear BEP relation (ΔEAct = γ + ϕΔEDiss, see Fig. 1a), and reaction energies and the O adsorption energies are in turn connected (ΔEDiss = ε + δΔEAds(O), see Fig. 2). Since ΔEAds(O) is the additive inverse of ΔEVac, one can expect the following, where α and β depend on the specific dissociation reaction:
| ΔEAct = α − βΔEVac | (5) |
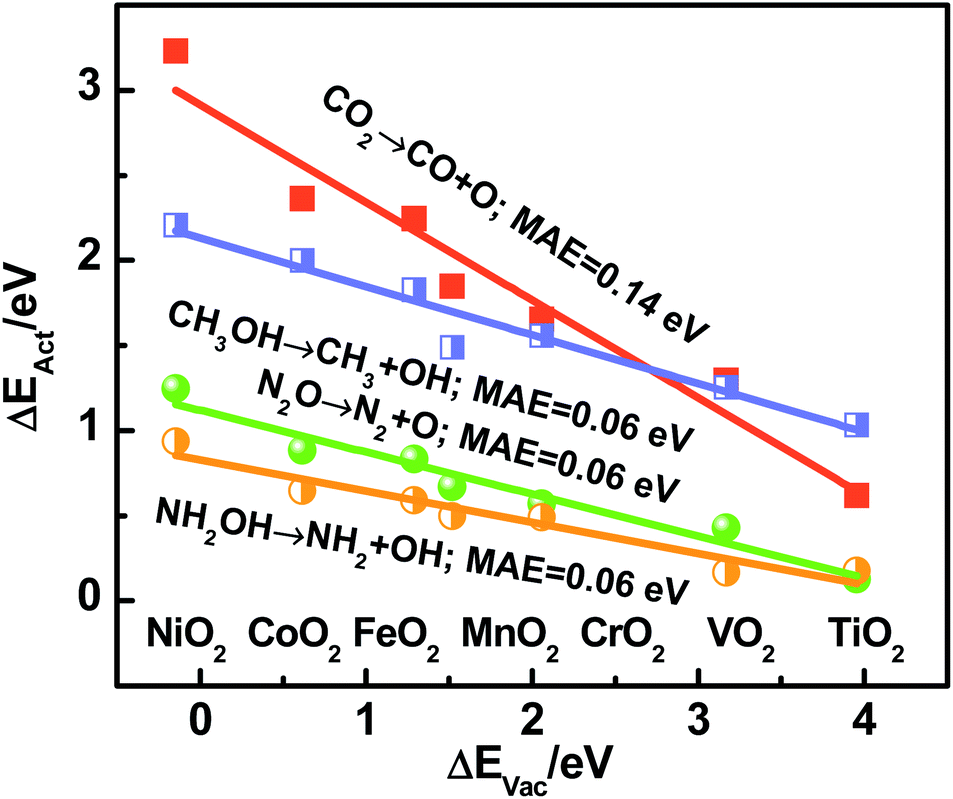 | ||
| Fig. 3 Activation energy (ΔEAct) for C–O and N–O bond scissions plotted as a function of the vacancy formation energy (ΔEVac) on MO2(110). The analyzed oxides are respectively marked in the trends. MAE: mean absolute error. | ||
To further understand the nature of the bond between bridge oxygen and metal ions in rutile oxides, we calculated in Fig. 4 the differential charge density maps. It can be seen from Fig. 4a that there is considerable charge withdrawal from Ti by O in TiO2, which is indicative of rather ionic bonds. Fig. 4b–d show sizeable charge depletion from both M (M = Cr, Fe and Ni) and O centers and accumulation between them, meaning that the bonds are covalent. Furthermore, the charge withdrawn from O (blue part) gradually increases when moving from CrO2 to NiO2, suggesting that more and more electrons contribute to the formation of the bond and lead to stronger covalent interactions. Therefore, these results show that the bridge oxygen–metal bond switches from ionic to covalent when moving from TiO2 to NiO2, which is in turn responsible for the decrease in ΔEVac.
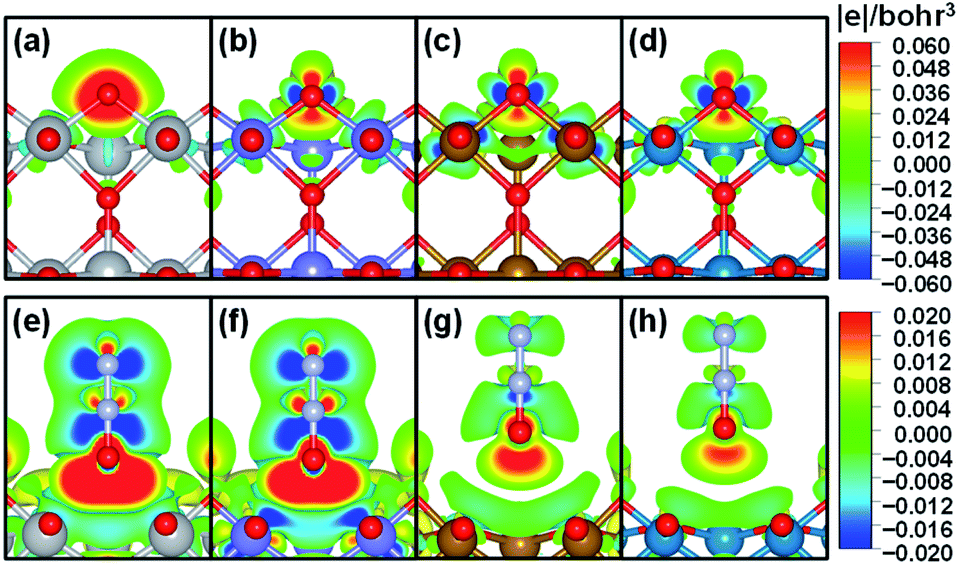 | ||
| Fig. 4 Differential charge density map for adsorption of O (upper panels) and N2O (lower panels) at the bridge O vacancy on MO2(110). (a and e) M = Ti; (b and f) M = Cr; (c and g) M = Fe; (d and h) M = Ni. Grey, purple, orange, green, red and light purple spheres represent Ti, Cr, Fe, Ni, O and N, respectively. Blue and yellow-red isosurfaces indicate charge depletion and accumulation, respectively. The 2D profile is a cut along two bridge O–M bonds. | ||
In contrast, for N2O adsorption at the bridge O vacancy, we find charge depletion from metal centers and O centers in N2O and accumulation between them for all the rutile oxides studied, as shown in Fig. 4e–h, indicating that the bonds are covalent. Interestingly, the distance between M and O in N2O is closely related to the charge transferred. As the M–O distance increases from TiO2 and CrO2 (∼2.5 Å) to FeO2 and NiO2 (∼3.0 Å), the charge transferred markedly decreases. The similar bond nature between M and N2O also leads to a small variation in adsorption energies of 0.22 eV only. We note that this explanation based on bond ionicity and covalency is similar to that in previous studies on metalloporphyrins61 and metals,7 which grants generality to the analysis.
In brief, Fig. 2–4 show that reaction energies (ΔEDiss), activation energies (ΔEAct), oxygen vacancy formation energies (ΔEVac), and electronic charges are all connected on rutile oxides, which holds promise for understanding and rationally capitalizing on the high activity of oxygen vacancies at rutile oxides observed experimentally.
We emphasize that ΔEVac is a more convenient descriptor than the others analyzed here in view of its straightforward calculation and experimental measurability.
4. Conclusions
By adsorbing and cleaving CO2, CH3OH, N2O, and NH2OH, we were able to construct linear BEP relationships for C–O and N–O bond scissions taking place at oxygen vacancies on rutile oxides. Interestingly, the analysis of the trends allowed us to identify the oxygen vacancy formation energy as a simple yet accurate descriptor for the transition-state energies of such scissions. This is important because oxygen vacancy formation energies are more easily calculated than transition-state energies and can be measured experimentally.The nature of the bond between bridge oxygen and 3d metals in rutile oxides changes from ionic to covalent when moving from the left to the right of the periodic table (Ti to Ni), in line with the trends in formation energies of surface oxygen vacancies. The insight gained from this study can be used to enrich the design principles for oxide catalysts and simplify their modelling, particularly for those where lattice oxygen and/or oxygen vacancies participate in the catalytic cycles.
Conflicts of interest
There are no conflicts to declare.Acknowledgements
We gratefully acknowledge the financial support from the Natural Science Foundation of China (21872136 and 21603146), the Ministry of Science and Technology of China (2017YFA0204800), the Guangdong Innovation Research Team for Higher Education (2017KCXTD030) and the High-level Talents Project of the Dongguan University of Technology (KCYKYQD2017017). We also received funding from the Engineering Research Center of None-food Biomass Efficient Pyrolysis and Utilization Technology of Guangdong Higher Education Institutes (grant 2016GCZX009). F. C. V. acknowledges funding from the Spanish MICIUN through a Ramón y Cajal research contract (RYC-2015-18996) and the program “Units of Excellence María de Maeztu” (grant MDM-2017-0767) and Generalitat de Catalunya (project 2017SGR13). We thank Red Española de Supercomputación (RES) for supercomputing time at SCAYLE (projects QS-2019-3-0018, QS-2019-2-0023, and QCM-2019-1-0034). The use of the supercomputing facilities at SURFsara was sponsored by NWO Physical Sciences, with financial support from the NWO.References
- B. Hammer and J. K. Nørskov, Adv. Catal., 2000, 45, 71–129 CAS.
- J. K. Nørskov, F. Abild-Pedersen, F. Studt and T. Bligaard, Proc. Natl. Acad. Sci. U. S. A., 2011, 108, 937–943 CrossRef PubMed.
- R. A. Van Santen, Acc. Chem. Res., 2009, 42, 57–66 CrossRef CAS PubMed.
- J. K. Nørskov, T. Bligaard, J. Rossmeisl and C. H. Christensen, Nat. Chem., 2009, 1, 37–46 CrossRef PubMed.
- F. Calle-Vallejo, J. I. Martinez, J. M. Garcia-Lastra, P. Sautet and D. Loffreda, Angew. Chem., Int. Ed., 2014, 53, 8316–8319 CrossRef CAS PubMed.
- X. Ma and H. Xin, Phys. Rev. Lett., 2017, 118, 036101 CrossRef PubMed.
- H.-Y. Su, K. Sun, W.-Q. Wang, Z. H. Zeng, F. Calle-Vallejo and W.-X. Li, J. Phys. Chem. Lett., 2016, 7, 5302–5306 CrossRef CAS PubMed.
- C. D. Gelatt, A. R. Williams and V. L. Moruzzi, Phys. Rev. B: Condens. Matter Mater. Phys., 1983, 27, 2005–2013 CrossRef CAS.
- J. F. Weaver, Chem. Rev., 2013, 113, 4164–4215 CrossRef CAS PubMed.
- J. Suntivich, K. J. May, H. A. Gasteiger, J. B. Goodenough and Y. Shao-Horn, Science, 2011, 334, 1383–1385 CrossRef CAS PubMed.
- F. Calle-Vallejo, N. G. Inoglu, H.-Y. Su, J. I. Martinez, I. C. Man, M. T. M. Koper, J. R. Kitchin and J. Rossmeisl, Chem. Sci., 2013, 4, 1245–1249 RSC.
- V. Fung, F. F. Tao and D.-e. Jiang, J. Phys. Chem. Lett., 2017, 8, 2206–2211 CrossRef CAS PubMed.
- Y. L. Lee, J. Kleis, J. Rossmeisl, Y. Shao-Horn and D. J. E. Morgan, Energy Environ. Sci., 2011, 4, 3966–3970 RSC.
- C. F. Dickens, J. H. Montoya, A. R. Kulkarni, M. Bajdich and J. K. Nørskov, Surf. Sci., 2019, 681, 122–129 CrossRef CAS.
- Y. Hinuma, T. Toyao, T. Kamachi, Z. Maeno, S. Takakusagi, S. Furukawa, I. Takigawa and K. Shimizu, J. Phys. Chem. C, 2018, 122, 29435–29444 CrossRef CAS.
- S. Wang, V. Petzold, V. Tripkovic, J. Kleis, J. G. Howalt, E. Skúlason, E. M. Fernández, B. Hvolbæk, G. Jones, A. Toftelund, H. Falsig, M. Björketun, F. Studt, F. Abild-Pedersen, J. Rossmeisl, J. K. Nørskov and T. Bligaard, Phys. Chem. Chem. Phys., 2011, 13, 20760–20765 RSC.
- S. Wang, B. Temel, J. Shen, G. Jones, L. C. Grabow, F. Studt, T. Bligaard, F. Abild-Pedersen, C. H. Christensen and J. K. Nørskov, Catal. Lett., 2011, 141, 370–373 CrossRef CAS.
- A. Vojvodic, F. Calle-Vallejo, W. Guo, S. Wang, A. Toftelund, F. Studt, J. I. Martinez, J. Shen, I. C. Man, J. Rossmeisl, T. Bligaard, J. K. Nørskov and F. Abild-Pedersen, J. Chem. Phys., 2011, 134, 244509 CrossRef CAS PubMed.
- A. L. Linsebigler, G. Lu and J. T. Yates, Chem. Rev., 1995, 95, 735–758 CrossRef CAS.
- A. Fujishima and K. Honda, Nature, 1972, 238, 37–38 CrossRef CAS PubMed.
- M. Haruta, Cattech, 2002, 6, 102–115 CrossRef CAS.
- J. Huusko, V. Lantto and H. Torvela, Sens. Actuators, B, 1993, 15, 245–248 CrossRef.
- G. Pacchioni, ChemPhysChem, 2003, 4, 1041–1047 CrossRef CAS PubMed.
- J. A. Rodriguez, S. Ma, P. Liu, J. Hrbek, J. Evans and M. Perez, Science, 2007, 318, 1757–1760 CrossRef CAS PubMed.
- R. Schaub, P. Thostrup, N. Lopez, E. Laegsgaard, I. Stensgaard, J. K. Nørskov and F. Besenbacher, Phys. Rev. Lett., 2001, 87, 266104 CrossRef CAS PubMed.
- Y. G. Wang, Y. Yoon, V. A. Glezakou, J. Li and R. Rousseau, J. Am. Chem. Soc., 2013, 135, 10673–10683 CrossRef CAS PubMed.
- X. Wu, A. Selloni and S. K. Nayak, J. Chem. Phys., 2004, 120, 4512–4516 CrossRef CAS PubMed.
- M. Al-Hashem, S. Akbar and P. Morris, Sens. Actuators, B, 2019, 301, 126845 CrossRef CAS.
- C. T. Campbell and C. H. F. Peden, Science, 2005, 309, 713–714 CrossRef CAS PubMed.
- Y. Matsumoto and E. Sato, Mater. Chem. Phys., 1986, 14, 397–426 CrossRef CAS.
- J. G. Vos, T. A. Wezendonk, A. W. Jeremiasse and M. T. M. Koper, J. Am. Chem. Soc., 2018, 140, 10270–10281 CrossRef CAS PubMed.
- H. Over, Science, 2000, 287, 1474–1476 CrossRef CAS PubMed.
- R. Mu, D. C. Cantu, X. Lin, V.-A. Glezakou, Z. Wang, I. Lyubinetsky, R. Rousseau and Z. Dohnalek, J. Phys. Chem. Lett., 2014, 5, 3445–3450 CrossRef CAS PubMed.
- Y. Bian, M. Kim, T. Li, A. Asthagiri and J. F. Weaver, J. Am. Chem. Soc., 2018, 140, 2665–2672 CrossRef CAS PubMed.
- C.-H. Yeh, P. Thong Minh Le, S. Nachimuthu and J.-C. Jiang, ACS Catal., 2019, 9, 8230–8242 CrossRef CAS.
- O. Diaz-Morales, F. Calle-Vallejo, C. de Munck and M. T. M. Koper, Chem. Sci., 2013, 4, 2334–2343 RSC.
- A. Grimaud, O. Diaz-Morales, B. Han, W. T. Hong, Y.-L. Lee, L. Giordano, K. A. Stoerzinger, M. T. M. Koper and Y. Shao-Horn, Nat. Chem., 2017, 9, 457–465 CrossRef CAS PubMed.
- N. B. Halck, V. Petrykin, P. Krtil and J. Rossmeisl, Phys. Chem. Chem. Phys., 2014, 16, 13682–13688 RSC.
- M. Retuerto, F. Calle-Vallejo, L. Pascual, P. Ferrer, A. Garcia, J. Torrero, D. Gianolio, J. L. G. Fierro, M. A. Pena, J. Antonio Alonso and S. Rojas, J. Power Sources, 2018, 404, 56–63 CrossRef CAS.
- F. Cheng, T. Zhang, Y. Zhang, J. Du, X. Han and J. Chen, Angew. Chem., Int. Ed., 2013, 52, 2474–2477 CrossRef CAS PubMed.
- D. A. Tompsett, S. C. Parker and M. S. Islam, J. Am. Chem. Soc., 2014, 136, 1418–1426 CrossRef CAS PubMed.
- C. Doornkamp and V. Ponec, J. Mol. Catal. A: Chem., 2000, 162, 19–32 CrossRef CAS.
- L. Xue, C. B. Zhang, H. He and Y. Teraok, Appl. Catal., B, 2007, 75, 167–174 CrossRef CAS.
- J. H. Wu, Y. Huang, W. Ye and Y. G. Li, Adv. Sci., 2017, 4, 1700194 CrossRef PubMed.
- Y. Y. Birdja, E. Pérez-Gallent, M. C. Figueiredo, A. J. Göttle, F. Calle-Vallejo and M. T. M. Koper, Nat. Energy, 2019, 4, 732–745 CrossRef CAS.
- K. Drew, G. Girishkumar, K. Vinodgopal and P. V. Kamat, J. Phys. Chem. B, 2005, 109, 11851–11857 CrossRef CAS PubMed.
- V. Rosca, G. L. Beltramo and M. T. M. Koper, J. Electroanal. Chem., 2004, 566, 53–62 CrossRef CAS.
- C. T. Campbell and J. R. V. Sellers, Chem. Rev., 2013, 113, 4106–4135 CrossRef CAS PubMed.
- G. Kresse and J. Furthmüller, Phys. Rev. B: Condens. Matter Mater. Phys., 1996, 54, 11169–11186 CrossRef CAS PubMed.
- J. P. Perdew, K. Burke and M. Ernzerhof, Phys. Rev. Lett., 1996, 77, 3865–3868 CrossRef CAS PubMed.
- P. E. Blöchl, Phys. Rev. B: Condens. Matter Mater. Phys., 1994, 50, 17953–17979 CrossRef PubMed.
- H. J. Monkhorst, Phys. Rev. B: Condens. Matter Mater. Phys., 1976, 16, 1748–1749 Search PubMed.
- S. Grimme, J. Antony, S. Ehrlich and H. Krieg, J. Chem. Phys., 2010, 132, 154104 CrossRef PubMed.
- K. J. Sun, Y. H. Zhao, H.-Y. Su and W.-X. Li, Theor. Chem. Acc., 2012, 131, 1118 Search PubMed.
- G. Henkelman, J. Chem. Phys., 2000, 113, 9978–9985 CrossRef CAS.
- J. I. Martinez, H. A. Hansen, J. Rossmeisl and J. K. Nørskov, Phys. Rev. B: Condens. Matter Mater. Phys., 2009, 79, 045120 CrossRef.
- F. Calle-Vallejo, J. I. Martinez, J. M. Garcia-Lastra, M. Mogensen and J. Rossmeisl, Angew. Chem., Int. Ed., 2010, 49, 7699–7701 CrossRef CAS PubMed.
- S. Kurth, J. P. Perdew and P. Blaha, Int. J. Quantum Chem., 1999, 75, 889–909 CrossRef CAS.
- M. G. Evans and M. Polanyi, Trans. Faraday Soc., 1938, 34, 11–24 RSC.
- X. Q. Gong, Z. P. Liu, R. Raval and P. Hu, J. Am. Chem. Soc., 2004, 126, 8–9 CrossRef CAS PubMed.
- F. Calle-Vallejo, A. Krabbe and J. M. Garcia-Lastra, Chem. Sci., 2017, 8, 124–130 RSC.
Footnote |
| † Electronic supplementary information (ESI) available: Lattice constants, adsorption energies and geometric data of intermediates, +U and dispersion tests, energetics and geometric configuration of C–O and N–O bond scission, and vacancy formation energies. See DOI: 10.1039/d0sc00534g |
| This journal is © The Royal Society of Chemistry 2020 |