A high-performance pH-sensitive electrode integrated with a multi-sensing probe for online water quality monitoring
Kiranmai
Uppuluri
 a,
Dorota
Szwagierczak
 *a,
Llewellyn
Fernandes
b,
Krzysztof
Zaraska
a,
Ilja
Lange
b,
Beata
Synkiewicz-Musialska
a and
Libu
Manjakkal
 *cd
*cd
aŁukasiewicz Research Network – Institute of Microelectronics and Photonics, Kraków Division, ul. Zabłocie 39, 30-701 Kraków, Poland. E-mail: dorota.szwagierczak@imif.lukasiewicz.gov.pl
bEvoLogics GmbH, Ackerstraße 76, 13355 Berlin, Germany
cJames Watt School of Engineering, University of Glasgow, Glasgow, G12 8LT, UK. E-mail: L.Manjakkal@napier.ac.uk
dSchool of Computing and Engineering & the built environment Edinburgh Napier University, Merchiston Campus, EH10 5DT, Edinburgh, UK
First published on 11th October 2023
Abstract
Water quality monitoring is an essential tool in effective environmental and public health protection. This study presents a new screen-printed Co2O3–RuO2-based electrode for electrochemical pH sensing and its comprehensive morphological, compositional, potentiometric, and thermal characterization. This novel electrode is used to measure the pH of different types of environmental water (river, lake, and sea) in Poland and the pH along the water column of a lake in Germany using an underwater multi-sensor probe, the development and demonstration of which are also described. The thick film pH electrode exhibits super-Nernstian sensitivity of 70.6 ± 2.2 mV pH−1, a short response time of 2–13 s, and a stable response in media with a conductivity of up to 118 mS cm−1 at temperatures ranging from −2 to 60 °C in the pH range 1–13. The electrodes have a high level of accuracy in comparison to the commercial glass electrodes, which they maintain over a period of 3 years. The superior potentiometric characteristics such as high sensitivity, selectivity, stability, and undisturbed sensing under extreme conditions are among the significant advantages of the developed miniaturized and low-cost pH-sensing electrode. The developed underwater probe is portable, rechargeable, submersible, autonomous, provides significant water data, and does not require scientific staff for operation.
Introduction
Indisputably an indispensable resource, water on Earth faces severe threats such as pollution, climate change, uneven distribution, and overconsumption. Without sufficient knowledge about the characteristics of water, one can expect negative effects on human health, the economy, and the environment. In 2022, hundreds of tons of fish and other animals were found dead due to unknown reasons in the Oder River on the border of Germany and Poland.1 In response to this environmental disaster, the improvement in knowledge, monitoring, and communication of water data was the most strongly emphasized recommendation by the European Environment Agency.1 Water quality monitoring (WQM) is therefore critical to ensure that chemical, physical, and biological parameters are under check with regard to public and environmental health safety standards. For monitoring these parameters, the standard method is sample collection from a site and transportation to the laboratory. However, laboratory testing requires a designated space, specific equipment, and particular skills. The absence of real-time data also causes a delay in results, which is a detriment to early warning systems (EWSs).2 Moreover, the time, money, and space-consuming processes of transportation and storage of water samples may also introduce human error and variations in quality causing unfair results.3 On-site and real-time testing overcomes these limitations and empowers responsible authorities to make prompt and effective decisions.4 The significance of water data from below the surface is revealed by the recent developments in intelligent communication systems dedicated to monitoring underwater environments under the umbrella of the term Internet of Underwater Things (IoUT).5Among the various parameters, pH is one of the cardinal indicators of water quality. However, since the commercially available glass electrode is bulky and fragile and requires wet storage, metal oxides, and mixed metal oxide-based pH electrodes are worthy alternatives due to the possibility for miniaturization, robustness, stability, and compatibility with integration into encapsulated circuitry.6 Smart solutions for WQM are being developed simultaneously with advancement in information and communication technologies. So, sensors that are small, low-maintenance, cheap, and easy to manufacture and embed into electronic systems are necessary. For these reasons, the proposition of replacing glass electrodes with thin or thick-film-based sensors is observable in recent literature6–11 and pH sensors including palladium-ink on polyimide substrates,7 silica on carbon12 and RuOx13 have been reported. However, the sensitivity achieved in these studies was not high enough for contamination-prone environments and was determined in a narrow range of pH from 4 to 10. In WQM, this is dangerous because the short range of pH measurement hinders EWSs from detecting contamination of the water with toxic waste. Portable water quality measurement systems with a wider range of pH achieved this by using commercial sensors14 and therefore do not impart any information about the properties of the sensing material. Additionally, in comparison to other methods, screen-printing is a simpler and cheaper technique with the potential for mass production, higher reproducibility, and better performance.6,7
This study addresses two practical key points. First, the reduction of the amount of ruthenium oxide (RuO2) in the sensitive layer causes an overall decrease in the economic and environmental cost of the pH sensor. Second, the application of screen-printed electrodes directly in the natural environment for underwater and real-time measurements, which overcomes the drawbacks prevailing in field-to-laboratory water quality testing such as time, logistics, technicalities, and alterations in sample quality. For this, we applied the developed electrodes to measure the pH of different types of environmental water (lake, river, and sea) in Poland, developed a new underwater multi-sensor probe, and analyzed the quality of water in a lake at different depth levels in Germany. The theoretical key point of the study is the elaborate characterization of the developed pH sensing material and electrode using advanced analytical techniques. In printed electrodes, RuO2 is a popular pH-sensing material because of its stability and near-Nernstian sensitivity.8 The benchmark status of RuO2 extends to the field of electro-catalytic systems, especially the oxygen evolution reaction (OER).15 However, researchers from both fields explore materials that contain lesser RuO2 because it is an expensive and scarcely available noble-metal-based material.13,22,23 Meanwhile, cobalt is more abundant and comparatively cheaper. Although it has relatively low electro-catalytic activity and low conductivity,15 particles of fine cobalt oxide adjoin new OH sites at the interface between metal oxide and solutions because they have large surface areas.9 Based on these properties of Co2O3 and RuO2, a novel pH-sensitive binary metal oxide composition is developed in this study. To the best of our knowledge, even though several combinations of RuO2 with other metal oxides such as TiO2,16 Ta2O5,17 SnO2,18etc. have been reported, no work so far has investigated the combination between Co2O3 and RuO2 for pH sensing and its integration with an underwater sensing probe.
Experimental
Paste preparation and sensor fabrication.
Co2O3 (Chempur, Poland) and RuO2 (Sigma Aldrich, USA) were used to prepare thick film pastes for the pH-sensing electrodes. The mixtures of Co2O3 and RuO2 in the ratio of 50![[thin space (1/6-em)]](https://www.rsc.org/images/entities/char_2009.gif) :
:![[thin space (1/6-em)]](https://www.rsc.org/images/entities/char_2009.gif) 50 mol% (55.5
50 mol% (55.5![[thin space (1/6-em)]](https://www.rsc.org/images/entities/char_2009.gif) :
:![[thin space (1/6-em)]](https://www.rsc.org/images/entities/char_2009.gif) 44.5 wt%), 60
44.5 wt%), 60![[thin space (1/6-em)]](https://www.rsc.org/images/entities/char_2009.gif) :
:![[thin space (1/6-em)]](https://www.rsc.org/images/entities/char_2009.gif) 40 mol% (65.1
40 mol% (65.1![[thin space (1/6-em)]](https://www.rsc.org/images/entities/char_2009.gif) :
:![[thin space (1/6-em)]](https://www.rsc.org/images/entities/char_2009.gif) 34.9 wt%) and 70
34.9 wt%) and 70![[thin space (1/6-em)]](https://www.rsc.org/images/entities/char_2009.gif) :
:![[thin space (1/6-em)]](https://www.rsc.org/images/entities/char_2009.gif) 30 mol% (77.4
30 mol% (77.4![[thin space (1/6-em)]](https://www.rsc.org/images/entities/char_2009.gif) :
:![[thin space (1/6-em)]](https://www.rsc.org/images/entities/char_2009.gif) 22.6 wt%) were used. Since the pH sensitivity (mV pH−1) decreases as the proportion of Co2O3 in the mixture increases, this study presents a broader analysis of one of the mixtures that exhibited the best results i.e., 50 mol% Co2O3–50 mol% RuO2. The mixtures were wet ball milled (Fritsch, Germany) in isopropanol using zirconia balls for 8 h. The resulting fine powders were converted into pastes for screen printing by grinding with 40 wt% of a binder (40 wt% solution of ethyl cellulose in terpineol) and a solvent (terpineol) in an agate mortar. The proportions of oxide powders, binders, and solvents were optimized to attain the paste viscosity suitable for screen printing.
22.6 wt%) were used. Since the pH sensitivity (mV pH−1) decreases as the proportion of Co2O3 in the mixture increases, this study presents a broader analysis of one of the mixtures that exhibited the best results i.e., 50 mol% Co2O3–50 mol% RuO2. The mixtures were wet ball milled (Fritsch, Germany) in isopropanol using zirconia balls for 8 h. The resulting fine powders were converted into pastes for screen printing by grinding with 40 wt% of a binder (40 wt% solution of ethyl cellulose in terpineol) and a solvent (terpineol) in an agate mortar. The proportions of oxide powders, binders, and solvents were optimized to attain the paste viscosity suitable for screen printing.
The electrodes were fabricated using a screen printer (ZUT, Poland). First, a conductive layer of Ag/Pd paste (Electro-Science Laboratories, USA) was screen-printed on inert Al2O3 (96%) substrates, dried for 15 min at 120 °C and sintered at 860 °C for 30 min. The Co2O3–RuO2 paste was screen-printed using a 150 mesh stainless screen at one end of the conducting layer and the electrodes were sintered at 900 °C for 1 h. There is a polydimethylsiloxane-coated (DOWSIL, USA) electrical contact at the other end of the conducting layer. For comparison, pure Co2O3-based electrodes were fabricated using the same procedure.
Characterization of the sensitive electrode
The phase composition of Co2O3–RuO2 films was examined by the X-ray diffraction method (XRD), using CuKα radiation (PANalytical, Netherlands). Measurements of the thickness and roughness of the sensing electrodes were performed in cooperation with Technolutions company (Poland) using an optical profilometer (Rtec Instrument, Switzerland). The microstructure and elemental analysis of the Co2O3–RuO2 sintered layers was performed using scanning electron microscopy (SEM) and X-ray energy dispersive spectroscopy (EDS) (FEI Nova Nano SEM 200 with EDAX Genesis system, USA). The changes in mass, temperature, and heat flow during heating from room temperature up to 900 °C were studied for a Co2O3–RuO2 powder sample using thermogravimetric measurements (TG) and differential scanning calorimetry (DSC) (STA 449 F3, Netzsch, Germany).The pH sensitivity, response time, drift, and hysteresis effect of the Co2O3–RuO2 electrode were investigated using potentiometric measurements in standard pH buffer solutions (Chempur, Poland). The electromotive force (emf) between the Co2O3–RuO2 electrodes and the Ag/AgCl/KCl reference electrode (Hydromet, Poland) was measured as a function of pH in each buffer solution and the sensitivity was determined from the slope of this relationship. The emf was measured using a multimeter (6.5-digit Series, Keithley Instruments, USA), and the data were analyzed using the LabView program (National Instruments, USA). A multi-parameter meter (Elmetron, Poland) was used for measuring the pH, conductivity, and temperature of the test solution. At the measuring temperature of 25 °C, the ideal pH sensitivity is calculated to be 59.1 mV pH−1 for a 1-electron reaction based on the Nernst equation. The interference effect was investigated by calculating the sensitivity in pH buffers containing 0.01 M concentration of KCl, KNO3, NH4NO3, (NH4)3PO4, Na2HPO4, and LiF salts. These chemical species are commonly found in polluted water. To observe the influence of conductivity on the stability of the response signal, emf measurements were made starting from deionized water and adding NaCl until reaching above twice the typical conductivity of seawater (50 mS cm−1). To measure the influence of temperature on the response signal, the sensors were immersed in partially frozen pH buffers of 1, 4, 7, 9, and 10. The buffers were then heated to 60 °C.
Measurement in real-life samples and development of underwater probe
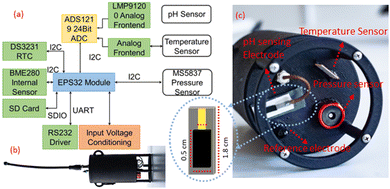
The accuracy of the sensors was investigated in samples from the Baltic Sea in Ustronie Morskie, Morskie Oko Lake in Tatra Mountains, and Vistula River in Krakow, Poland. To check the applicability directly on-site, an underwater multi-sensor probe (Fig. 1) was developed using the pH electrodes fabricated in this study and the temperature sensor reported previously.19The ESP32 Module (Espressif Systems, China) is a WIFI/Bluetooth module and a dual-core processor that handles the WIFI access point, FTP server, interfacing with all the sensors, and logging the data to the SD card. The SD card is interfaced over a 1Bit SDIO (secure digital input output) and it starts a new file for logging in comma-separated format whenever the probe is turned ON. These files are accessed from the module using WIFI and the running FTP server. Since the analog-to-digital converter of the ESP32 is nonlinear and not very accurate, it is interfaced via I2C bus to a high precision 24Bit ADS1219 (Texas Instruments, USA) analog-to-digital converter with 4 inputs which can be used as a single ended or differential inputs. In this application, they function as differential inputs for pH and temperature sensors. The sensor performs a conversion and indicates its application with a data-ready GPIO pin following which the microcontroller can read the conversion data using the I2C bus. To reference readings with the depth at which they were recorded, a high precision 30Bar MS5837 pressure sensor with a 0.2 cm resolution and readability up to a depth of 300 m is used. For debug purposes, the BME280 sensor measures the internal temperature and humidity to indicate whether there is a leakage in the sensor housing. The probe's housing was designed using SolidWorks (Dassault Systèmes, France). The 3D printing was done at Creabis GmbH (Munich, Germany) from PA12 on a Multi Jet Printer (HP, USA). Marine sealing SikaFlex 291i (Sika, Switzerland) was used to glue the parts together and secure the breakthrough. This multi-parameter probe was used to measure the vertical profile of the Großer Müggelsee Lake in Berlin, Germany, by being lowered into the lake from a boathouse (52°26′38.1′′N; 13°37′08.1′′E) to a depth of 3 m using a rope.
Results and discussion
Morphological, compositional and thermal analysis
Two crystalline phases were revealed for the sintered 50 mol% Co2O3–50 mol% RuO2 electrode which includes (i) nonstoichiometric ruthenium cobalt spinel oxide Co2.35Ru0.65O3.86 (75.6%) which crystallizes in the cubic space group I![[4 with combining macron]](https://www.rsc.org/images/entities/char_0034_0304.gif) 2d (Ref. code 98-016-2402) and (ii) ruthenium(IV) oxide RuO2 (24.4%) which crystallizes in the tetragonal space group P42/mnm (Ref. code: 98-001-5071), as shown in Fig. 2a. For all the prepared Co2O3–RuO2 compositions, containing 50, 60 and 70 mol% Co2O3, XRD analysis proved the formation of Co2.35Ru0.65O3.86 spinel phase. Interestingly, the RuO2 phase was present only for 50
2d (Ref. code 98-016-2402) and (ii) ruthenium(IV) oxide RuO2 (24.4%) which crystallizes in the tetragonal space group P42/mnm (Ref. code: 98-001-5071), as shown in Fig. 2a. For all the prepared Co2O3–RuO2 compositions, containing 50, 60 and 70 mol% Co2O3, XRD analysis proved the formation of Co2.35Ru0.65O3.86 spinel phase. Interestingly, the RuO2 phase was present only for 50![[thin space (1/6-em)]](https://www.rsc.org/images/entities/char_2009.gif) :
:![[thin space (1/6-em)]](https://www.rsc.org/images/entities/char_2009.gif) 50 mol% and 60
50 mol% and 60![[thin space (1/6-em)]](https://www.rsc.org/images/entities/char_2009.gif) :
:![[thin space (1/6-em)]](https://www.rsc.org/images/entities/char_2009.gif) 40 mol% ratios, whereas it was not found for the 70
40 mol% ratios, whereas it was not found for the 70![[thin space (1/6-em)]](https://www.rsc.org/images/entities/char_2009.gif) :
:![[thin space (1/6-em)]](https://www.rsc.org/images/entities/char_2009.gif) 30 mol% ratio.
30 mol% ratio.
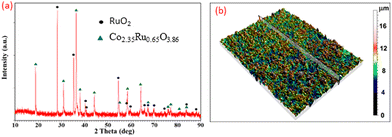 | ||
| Fig. 2 XRD pattern (a) and roughness profile (b) of the 50 mol% Co2O3–50 mol% RuO2 sensing electrode sintered at 900 °C. | ||
The roughness profile of the Co2O3–RuO2 composite (Fig. 2b) confirms that the average thickness of the electrodes is 11 μm, while the arithmetic average roughness (Ra parameter) is 1.1 μm. Relatively high surface roughness is advantageous for detection sensitivity due to an increase in the total number of surface sites according to the site-binding model.20
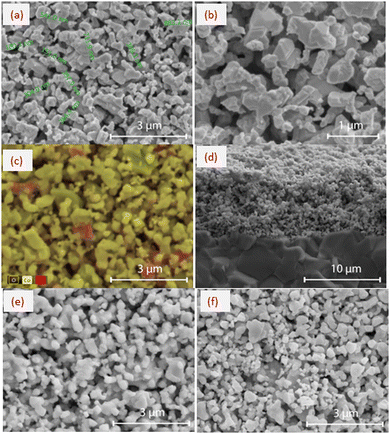
SEM images in Fig. 3a–c show the morphology of the surface of the 50 mol% Co2O3–50 mol% RuO2 thick film electrode screen-printed on the Al2O3 substrate and fired at 900 °C. The microstructure of the electrodes is fine-grained and exhibits high porosity which is a desired feature for electrode sensitivity. The grain sizes are not uniform and are ranging from 150 nm to 1 μm, as illustrated in Fig. 3a.
The results of EDS analysis presented in Fig. 3c and Table 1 confirm the two-phase composition of the sensing layers which was revealed by XRD analysis (Fig. 2a). Some of the bigger grains can be attributed to RuO2 (red regions in Fig. 3c) and the majority of grains of different grain sizes can be assigned to the Co–Ru spinel phase. It follows from the results of the EDS point analysis (Table 1) that Co/Ru at% ratio differs significantly in different points, and at some points (points 1, 2, and 3) is close to that corresponding to the nonstoichiometric spinel phase Co2.35Ru0.65O3.86 (Co/Ru at% ratio of 3.62). However, for the developed layers, due to very fine grains with submicron sizes, the applicability of the EDS method is limited, and the interpretation of EDS analysis is ambiguous because of a comparable or larger area of the analyzed spot than the grain size.
| Element | At% | ||||
|---|---|---|---|---|---|
| Point 1 | Point 2 | Point 3 | Point 4 | Point 5 | |
| Ru | 8.75 | 18.55 | 9.47 | 22.56 | 10.20 |
| Co | 33.85 | 26.60 | 32.45 | 24.45 | 33.77 |
| O | 57.40 | 54.85 | 9.47 | 52.99 | 56.03 |
| Co/Ru | 3.87 | 1.43 | 3.43 | 1.08 | 3.31 |
The SEM image in Fig. 3d shows a fractured cross-section of 50 mol% Co2O3–50 mol% RuO2 electrode with a thickness of about 8 μm which was screen printed on an Al2O3 substrate. This figure illustrates the good adhesion of the sensing thick film to the substrate. Fig. 3e and f show that the microstructure of 60 mol% Co2O3–40 mol% RuO2 and 70 mol% Co2O3–30 mol% RuO2 electrodes is similar to that of 50 mol% Co2O3–50 mol% RuO2 electrodes.
Fig. 4 displays the heat flow (DSC curve) and the mass changes (TG curve) for Co2O3–RuO2 powder during heating in the temperature range of 20–900 °C. In the DSC curve (Fig. 4a), a broad maximum occurs at 400 °C which can be attributed to the crystallization and reduction processes that lead to the formation of the nonstoichiometric Co2.35Ru0.65O3.86 spinel, which was identified by the XRD analysis as the main phase of the sensing layer. A small total mass decrease of 2.2% was observed in the temperature range 20–900 °C (Fig. 4b), related mainly to the adsorbed water loss below 100 °C. Furthermore, there occurs a small mass loss in the temperature range 400–900 °C, more pronounced above 860 °C. This effect can be attributed to the formation of the spinel phase with an oxygen deficit and a minor oxygen evaporation effect.
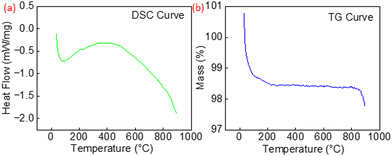 | ||
| Fig. 4 (a) Heat flow (DSC curve) and (b) mass change (TG curve) for Co2O3–RuO2 powder in the temperature range 20–900 °C. | ||
Potentiometric characteristics
The pH response of the sensitive electrode is influenced mainly by the sensitive electrode materials composition, electrode structure and porosity, and homogeneity of the film.6,10 When the sensitive electrode reacts with the electrolyte, its surface potential changes especially while varying the pH value of the solution. Here, the H+ and OH− ions from the solution attracted on the surface of this metal oxide-based sensitive electrode.6,10 Due to the reaction of metal oxide with solution both an electrochemical double layer and a redox reaction can occur on the electrode. This sensitive electrode surface can either donate or accept protons to form positive surface groups. In an acidic solution, due to H+ ions, the surface of the sensitive electrode film forms protonation, and hence, the emf is increasing. On the surface of the sensitive electrode diffusion of H+ ions, adsorption of ions, or a combined effect of both may occur.6,10 This is a reversible and cyclic process and depends on the pH value of the solution.Here, pure Co2O3-based electrodes exhibit poor pH sensitivity (33.7 mV pH−1), linearity (0.987), and adhesion strength to the substrate. In Fig. 5a, the emf versus pH plot is displayed for Co2O3–RuO2-based electrodes compared with such dependence obtained in the previous work21 for pure RuO2 electrodes. When the amount of RuO2 in the Co2O3–RuO2 mixture is reduced, the sensitivity (Fig. 5a) as well as the adhesion of the layers is weakened. The average sensitivity of 50 mol% Co2O3–50 mol% RuO2, 60 mol% Co2O3–40 mol% RuO2 and 70 mol% Co2O3–30 mol% RuO2 is 70.6 ± 2.2 mV pH−1, 62.9 ± 0.2 mV pH−1 and 52.5 ± 2.1 mV pH−1, respectively. In our previous study,21 the sensitivity of pure RuO2-based electrodes was 61.8 ± 1.0 mV pH−1. Therefore, the higher sensitivity achieved for 50 mol% Co2O3–50 mol% RuO2 and 60 mol% Co2O3–40 mol% RuO2 electrodes can be related to the multiphase composition and formation of nonstoichiometric complex Co–Ru oxide. As revealed by the XRD analysis for 50 mol% Co2O3–50 mol% RuO2 electrode (Fig. 2a) and 60 mol% Co2O3–40 mol% RuO2 electrode (not shown), the sintered sensing layers contain the Co2.35Ru0.65O3.86 phase and RuO2 phase. Oxygen deficiency in the spinel Co–Ru phase, a tendency to different oxidation states of both ruthenium and cobalt and, in consequence, different numbers of electrons participating in the redox reaction and different ratios of the activities of the reduced and oxidized species (as compared to the assumed values) can be responsible for a higher than theoretical pH sensitivity. The transfer of less than one electron per one proton has been indicated previously22 as a reason for super-Nernstian behavior. For the 50 mol% Co2O3–50 mol% RuO2 electrode, the XRD analysis indicated 75.6 wt% of the cobalt ruthenium oxide phase and 24.4 wt% of the RuO2 phase in the sintered layer. This means that while the entire amount of Co2O3 participated in the transition to the Co–Ru spinel, RuO2 was only partially involved in the reaction and the remaining amount was left unchanged. A similar observation was made previously upon doping a RuO2 sensitive electrode with 20 mol% Cu2O, where the two major phases in the film were a Cu–Ru–O complex oxide and RuO2.11 However, the development of a complex oxide is not observable in all cases. For example, when RuO2 was mixed with 30 wt% SnO218 and TiO2,16 there was no additional phase reported from the reaction between the oxides.
 | ||
| Fig. 5 (a) Comparison of the emf versus pH plots for the Co2O3 (A)–RuO2 (B) electrodes with 50, 60 and 70 mol% Co2O3 (this work) and RuO2 (B) electrodes (previous work,28 (b) hysteresis effect for 3 cycles of 7 → 4 → 7 → 10 → 7 loop and (c) stability of the emf response of 50 mol% Co2O3–50 mol% RuO2 electrodes in pH buffers for 24 h. | ||
The electrode based on 70 mol% Co2O3–30 mol% RuO2, which according to XRD analysis contains exclusively spinel phase, exhibits a little worse, although still good sensitivity (Fig. 5a). In conclusion, the results of XRD analysis combined with the potentiometric characteristics imply that both ruthenium cobalt spinel oxide Co2.35Ru0.65O3.86 and ruthenium oxide RuO2 contribute to good pH sensitivity of the fabricated electrodes.
In the literature, studies discuss the catalytic properties of both RuO223 and the Co–Ru complex oxide.24 RuO2 is a mixed ionic-electronic conductor10 which means that due to its ability to conduct both ions and electronic charge carriers, the water molecules in the testing solution saturates the free valences in their rutile structure. Thus, as an effect on its defect structure, there is a change in the stoichiometry of RuO2 when the electrons are transferred into its layer due to the protonation and deprotonation at the surface.18 On the other hand, the Co–Ru complex oxide displays a mutually beneficial cooperation between ruthenium and cobalt which is described in the literature mostly from the perspective of the Fischer–Tropsch synthesis. A study25 used the XPS method to investigate element valence in RuO2/Co3O4 nanocubes destined for an electrocatalyst for oxygen evolution and found the dominance of Ru4+ ions and the presence of Co3+ and Co2+ ions in the composite. Cobalt is less likely to be deactivated after being mixed with ruthenium24 and this results in a higher number of active sites and faster surface reactions.26 Additionally, there is an oxygen deficiency in the Co–Ru complex oxide which alters the charge transport properties, supports the creation of secondary active surface phases, regulates the bulk electronic properties of the sensitive layer15 and therefore improves the total electro-catalytic properties of the pH sensitive thick-film. This advantages the oxygen vacancy formation and diminishes the number of rate-determining steps and kinetic barriers.15
Compared to pure RuO2-based electrodes in our previous study,21 the response time for the mixed oxide Co2O3–RuO2 electrodes was lower in this study (2–13 s). This fast response of the sensor could be due to the appearance of the additional OH− sites at the metal oxide-solution interface caused by the introduction of the particles of the fine Co2O3 powder with a high specific surface area.9 The response in the basic media is almost instantaneous, whereas, it is a little slower in the acidic medium even though H+ atoms are present in a higher concentration in the acidic media and are smaller in size than OH− ions, which should make them diffuse more easily. It was reported that acidic conditions lead to lower overpotentials and poor stability in the case of oxygen evolution reaction catalysts such as the Co–Ru complex oxide and RuO2,15 which could be the reason for the slightly slower response in the acidic media. This overcomes the issue of longer response time in the basic media which has been reported previously,6 while at the same time preserving a good response time (8–13 s) in the acidic media.
The hysteresis effect in the three loops of pH 7 → 4 → 7 → 10 → 7 is shown in Fig. 5b. After the first loop, the shift in the emf at pH 7 in comparison to that in the initial emf is 0.8 mV. The hysteresis effect becomes more prominent with each passing loop and increases by 1% and 3% after the second and third loops, respectively. During a longer acid–base–acid loop (pH 1 → 3 → 7 → 10 → 14 → 10 → 7 → 3 → 1), the hysteresis effect is higher and it increases as the pH decreases from 14 to 1. These hysteresis values are consistent with the pH sensing performance of metal oxide-based pH sensors previously reported in other studies which also observed that shorter loops in the pH range of 4 to 10 exhibit lower hysteresis than those in the longer loops with a wider range of pH.22,27 The presence of the unreacted RuO2 in the sensing layer may contribute to the hysteresis effect in this study. Additionally, one previous work27 has indicated that rapid changes in pH lead to slower changes in the ratio of RuIII and RuIV which are responsible for the shifts in the emf response.
The pH in environmental waters is unstable due to factors such as dissolution of atmospheric CO2, acid rain, erosion of minerals, industrial and municipal pollutants, agricultural runoff, photosynthesis, and respiration by aquatic plants and organisms.28 Therefore, it is important to check the response in solutions with pH such as buffers to demonstrate the stability of the sensor during long and continuous measurements. The fabricated sensors maintain a stable response throughout the 24 h immersion period in pH 1, 4, 7, 10 and 13 buffers (Fig. 5c).
The impact of temperature, conductivity, and interference effect
Fig. 6a illustrates the influence of temperature on the emf of the fabricated sensors. There is a slight decrease in emf when rising from −2 to 60 °C for pH 4, 7, and 9, while it remains almost unchanged for pH 1 and 13. It follows from the Nernst equation that the emf decreases with temperature. The pH value and conductivity of the solution are also affected by temperature. In general, the pH values (−log[H+]) slightly decrease with increasing temperature due to the enhanced dissociation process and in consequence higher concentrations of H+ and OH− ions participating in the electrochemical reactions. This is valid for the dilute solutions, but for strong acids and bases (very low and very high pH values), the impact of temperature on pH is very small because these solutions are fully dissociated. At an elevated temperature of 60 °C, the sensors retained their potentiometric characteristics even after repeated exposure to continuous environmental changes such as rising temperature followed by the temperature shock at sub-zero temperatures. To evaluate the influence of the electrical conductivity of the solution on the emf values, the conductivity of the pH buffers 1, 2, 7, 9, and 13 was measured and found to be 60, 19, 1, 3, and 118 mS cm−1, respectively. Fig. 6b presents the changes in the emf during the initial measurement period (drift) in solutions with various electrical conductivities. The drift rate is plotted as a function of the electrical conductivity of the solution in Fig. 6c.It was observed that the higher the conductivity of the testing solution, the lower its impact on the response of the pH sensors in terms of stability and drift. There is a systematic decrease in the drift rate of the response signal with increasing conductivity. This implies that the fabricated Co2O3–RuO2 sensors have better stability in media with high conductivity and this explains their good accuracy of the pH measurement in seawater as well as the lower accuracy in comparison to all other water samples when measured in deionized water. During the measurement of temperature stability (Fig. 6a), the conductivity of pH 13 buffer was 118 mS cm−1, and the sensors exhibited a stable response at 60 °C as well. It was thus experimentally shown that the fabricated sensors present stable response in media with a conductivity up to 118 mS cm−1 and at temperatures ranging from −2 to 60 °C in the pH range of 1–13.
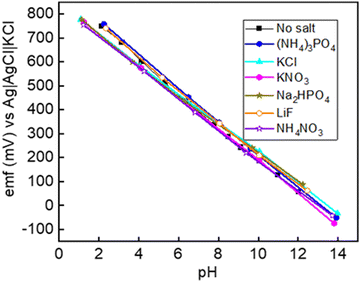
The selectivity of the Co2O3–RuO2 layer can be predicted thermodynamically using the measured emf response. The fixed interference method (FIM) is recommended by the International Union of Pure and Applied Chemistry (IUPAC) as a standard approach to evaluate the selectivity coefficient KpotA,B described under the assumptions of the Nikolsky–Eisenman equation29 and is followed in this work:
 | (1) |
| Interfering salts | Sensitivity (mV pH−1) | E 0 (mV) | Linearity R2 | Calculated selectivity coefficient kH+/ion |
|---|---|---|---|---|
| No salts added | 70.5 | 891 | 0.998 | — |
| KCl | 67.2 | 869 | 0.996 | 10−12 |
| KNO3 | 66.8 | 850 | 0.999 | 10−11 |
| NH4NO3 | 69.8 | 865 | 0.997 | 10−11 |
| (NH4)3PO4 | 68.6 | 884 | 0.996 | 10−11 |
| Na2HPO4 | 65.8 | 870 | 0.999 | 10−12 |
| LiF | 69.0 | 902 | 0.998 | 10−11 |
Applications and long-term stability
The performance of the fabricated sensors is compared to that of a commercial pH sensor in real-life water samples in Table 3. The very minute deviation encourages the implementation of the developed Co2O3–RuO2-based sensor for commercial applications. The deviation is in increasing order from the most conductive (seawater) to the least conductive sample (deionized water). As discussed earlier, the fabricated sensors have better stability in solutions with higher conductivity, probably due to the oxygen deficiency and increased concentration of oxygen vacancies in the Co–Ru oxide, which is the main component of the sensing layer. In addition to this to check the applications of the fabricated sensors in food technology, they were also tested in 3 common and commercially available energy drinks, Red Bull, Tiger and Black (purchased in Krakow, Poland). Energy drinks have low pH and they are weak organic acids. The comparison between the pH measurements using a commercial glass pH electrode and the fabricated electrodes for the tested energy drinks is given in Table 3. The behavior of the sensors is very accurate and stable in the energy drinks.| Water sample | pH | pH deviation | |
|---|---|---|---|
| Glass electrode | Fabricated electrodes | ||
| Deionized | 6.78 | 6.67 ± 0.02 | 0.11 |
| Tap | 8.10 | 8.08 ± 0.05 | 0.02 |
| Mineral | 5.58 | 5.56 ± 0.02 | 0.02 |
| Sea | 7.52 | 7.52 ± 0.00 | 0.00 |
| Lake | 6.42 | 6.38 ± 0.04 | 0.04 |
| River | 8.26 | 8.26 ± 0.01 | 0.00 |
| Red Bull | 3.45 | 3.47 ± 0.00 | 0.02 |
| Tiger | 3.31 | 3.34 ± 0.00 | 0.03 |
| Black | 3.53 | 3.53 ± 0.03 | 0.00 |
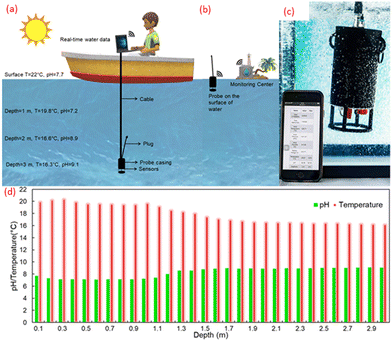
The demonstration of the submergibility of the underwater probe and the measurement of the water quality through the web server on a phone is presented in Fig. 8a and b. During the field test, the pH value, temperature, air pressure and the conductivity of the surface water in Großer Müggelsee Lake using commercial tools were 7.7, 22 °C, 1026.5 hPa and 862 μS cm−1, respectively. The change in pH and temperature at an interval of every 1 m and every 0.1 m from the surface of the lake water is shown in Fig. 8c and d, respectively. Großer Müggelsee is a shallow, polymictic lake with an average depth of 7.9 m, high alkalinity, and exposure to wind which does not allow the thermal stratification process to stabilize due to the frequent mixing.28 On the other hand, the water just 10 cm beneath the surface was colder by 2 °C which means that during the time of measurement, a cold layer had formed momentarily due to thermal stratification. Therefore, pH and temperature do not change uniformly between the surface and 3m deep water. However overall, the pH increases by 18% and the temperature decreases by 26% at 3 m deep in comparison to the surface water (Fig. 8b). The probe can also be deployed on the surface of the water and provide water quality data for a distance of up to 300 m (Fig. 8b). The developed sensing technology can also be integrated with buoys or unmanned aerial (UAV) and underwater vehicles (UUV) which can travel to different parts of a water body without human-assistance. Similarly, the applications can be extended into the fields of WQM in agriculture, wastewater treatment, and industry. Apart from the advantage of spatial underwater data, portability, and real-time measurement, the developed system is overall much smaller, lighter, economical, ecological, and easier to handle than the bulkier laboratory set-up.
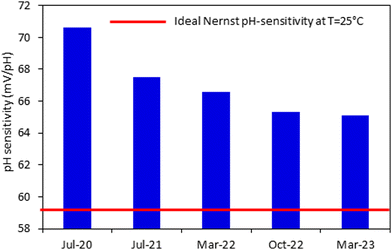
This study has been conducted over a period of 3 years which was imperative in investigating the repeatability, reproducibility, and long-term stability of the fabricated sensors. Even after 32 months from their first measurement and the exposure to multiple conditions (high temperatures and salinity, prolonged immersion in strong acids, bases and naturally polluted environmental samples), the sensors exhibit super-Nernstian sensitivity, close to 1 R2 value and fast response. Therefore, 50–50 mol% Co2O3–RuO2 sensors are chemically resilient, accurate, stable, repeatable and reproducible. There is however a slight decrease in the sensitivity at an average rate of 0.2 to 0.3 mV pH−1 per month but linearity and sensitivity remain close to 1 and the theoretical Nernst sensitivity (Fig. 9), respectively. To maintain the precision of the measurements, sensors fabricated using the material developed in this study are recommended to be calibrated every 5 to 6 months to compensate for this small drop in sensitivity. These results show that the fabricated electrodes have a shelf life of at least 5 years in which they can maintain their super-Nernstian pH sensing behavior.
Conclusions
Currently prevalent practices in environmental water quality testing involve the collection of samples and transportation to laboratories, which affects the quality of water and produces unfair results. This study presents miniaturized and portable thick-film pH sensors fabricated using a novel combination of Co2O3 and RuO2 along with an underwater multi-sensor probe to measure the pH and temperature of the water with a vertical profile in real-time. These sensors exhibit a super-Nernstian sensitivity (70.6 ± 2.2 mV pH−1), fast response (2 to 13 s), high selectivity, stability, and accuracy (error rate < 0.03%) comparable to the commercial glass electrode both in the laboratory and on the field. The developed sensing system has a lower environmental impact due to the reduction of platinum-group-based materials in the sensing layer and the lack of necessity for storage, transportation, space, and equipment, which are required in laboratory-based water quality testing. Overall, the preservation of RuO2, formation of a hybrid composition, the oxygen deficiency in the crystal structure, the well-adjusted method of fabrication and appropriate testing conditions are the determining factors of the excellent potentiometric characteristics demonstrated by the Co2O3–RuO2-based pH electrode in this study.Author contributions
Conceptualization: Kiranmai Uppuluri and Dorota Szwagierczak; data curation: Kiranmai Uppuluri and Llewellyn Fernandes; formal analysis: Kiranmai Uppuluri and Llewellyn Fernandes; funding acquisition: Krzysztof Zaraska, Ilja Lange, Beata Synkiewicz-Musialska, and Libu Manjakkal; investigation: Kiranmai Uppuluri, Dorota Szwagierczak, Llewellyn Fernandes; methodology: Kiranmai Uppuluri, and Krzysztof Zaraska; project administration: Krzysztof Zaraska, Ilja Lange, Beata Synkiewicz-Musialska, and Libu Manjakkal; resources: Kiranmai Uppuluri, Dorota Szwagierczak; software: Krzysztof Zaraska, and Llewellyn Fernandes; supervision: Dorota Szwagierczak and Libu Manjakkal; validation: Kiranmai Uppuluri; visualization: Kiranmai Uppuluri and Beata Synkiewicz-Musialska; roles/writing – original draft: Kiranmai Uppuluri; writing – review & editing: Dorota Szwagierczak and Libu Manjakkal.Conflicts of interest
There are no conflicts to declare.Acknowledgements
This work was supported by the European Commission through the AQUASENSE (H2020-MSCA-ITN-2018-813680) project and the National Science Centre (Poland) through the TESLA (CHIST-ERA IV-857925) project. Libu Manjakkal acknowledges the support from NERC discipline hopping activities to tackle environmental challenges project (SEED-2022-317475) and Edinburg Napier University SCEBE starter grant.References
- R. J. Hoeve, H. Stielstra, G. Free, W. Van de Bund, B. Gawlik, L. Van Wijk, M. Wood, E. Guagnini, K. Koutelos, A. Annunziato, B. Grizzetti, O. Vigiak, M. Gnecchi, S. Poikane, T. Christiansen, C. Whalley, F. Antognazza and B. Zerger, An EU analysis of the ecological disaster in Oder River of 2022, European Commission, 2023 Search PubMed.
- F. Jan, N. Min-Allah and D. Düştegör, Water, 2021, 13, 1–37 CrossRef.
- K. Acharya, A. Blackburn, J. Mohammed, A. T. Haile, A. M. Hiruy and D. Werner, Water Res., 2020, 184, 116112 CrossRef CAS PubMed.
- F. M. Aarestrup and M. E. J. Woolhouse, Science, 2020, 367, 630–632 CrossRef CAS PubMed.
- M. Jahanbakht, W. Xiang, L. Hanzo and M. R. Azghadi, IEEE Commun. Surv. Tutor., 2021, 23, 904–956 Search PubMed.
- L. Manjakkal, D. Szwagierczak and R. Dahiya, Prog. Mater. Sci., 2020, 109, 100635 CrossRef CAS.
- D. Clyne and M. J. Deen, Sensors, 2021, 21, 3775 CrossRef PubMed.
- A. Sardarinejad, D. K. Maurya, M. Khaled and K. Alameh, Sens. Actuators, A, 2015, 233, 414–421 CrossRef CAS.
- L. Qingwen, L. Guoan and S. Youqin, Anal. Chim. Acta, 2000, 409, 137–142 CrossRef CAS.
- P. Kurzweil, Sensors, 2009, 9, 4955–4985 CrossRef CAS PubMed.
- S. Zhuiykov, E. Kats, D. Marney and K. Kalantar-Zadeh, Prog. Org. Coat., 2011, 70, 67–73 CrossRef CAS.
- V. Kasi, S. Sedaghat, A. M. Alcaraz, M. K. Maruthamuthu, U. Heredia-Rivera, S. Nejati, J. Nguyen and R. Rahimi, ACS Appl. Mater. Interfaces, 2022, 14, 9697–9710 CrossRef CAS PubMed.
- Z. Wu, J. Wang, C. Bian, J. Tong and S. Xia, Micromachines, 2020, 11, 63 CrossRef PubMed.
- I. Hasan, M. Mukherjee, R. Halder, F. Y. Rubina and A. Razzak, Development of an IoT-Based Low-Cost Multi-Sensor Buoy for Real-Time Monitoring of Dhaka Canal Water Condition, IEMTRONIC, Canada, 2022, pp. 1–6 Search PubMed.
- A. Badreldin, A. E. Abusrafa and A. Abdel-Wahab, ChemSusChem, 2021, 14, 10–32 CrossRef CAS PubMed.
- L. Manjakkal, K. Cvejin, J. Kulawik, K. Zaraska, D. Szwagierczak and R. P. Socha, Sens. Actuators, B, 2014, 204, 57–67 CrossRef CAS.
- L. Manjakkal, K. Zaraska, K. Cvejin, J. Kulawik and D. Szwagierczak, Talanta, 2016, 147, 233–240 CrossRef CAS PubMed.
- L. Manjakkal, K. Cvejin, J. Kulawik, K. Zaraska, D. Szwagierczak and G. Stojanovic, J. Electroanal. Chem., 2015, 759, 82–90 CrossRef CAS.
- K. Uppuluri and D. Szwagierczak, Sens. Rev., 2022, 42, 177–186 CrossRef.
- M. H. Wu, C. H. Cheng, C. S. Lai and T. M. Pan, Sens. Actuators, B, 2009, 138, 221–227 CrossRef CAS.
- K. Uppuluri, M. Lazouskaya, D. Szwagierczak, K. Zaraska and M. Tamm, Sensors, 2021, 21, 5399 CrossRef CAS PubMed.
- K. Singh, B. S. Lou, J. L. Her, S. T. Pang and T. M. Pan, Sens. Actuators, B, 2019, 298, 126837 CrossRef CAS.
- C. F. Dickens and J. K. Nørskov, J. Phys. Chem. C, 2017, 121, 18516–18524 CrossRef CAS.
- E. Iglesia, S. L. Soled, R. A. Fiato and G. H. Via, J. Catal., 1993, 143, 345–368 CrossRef CAS.
- B. Y. Guo, X. Y. Zhang, X. Ma, T. S. Chen, Y. Chen, M. L. Wen, J. F. Qin, J. Nan, Y. M. Chai and B. Dong, Int. J. Hydrogen Energy, 2020, 45, 9575–9582 CrossRef CAS.
- F. Diehl and A. Y. Khodakov, Oil Gas Sci. Technol., 2008, 63, 9–19 CrossRef.
- W. Lonsdale, M. Wajrak and K. Alameh, Sens. Actuators, B, 2017, 252, 251–256 CrossRef CAS.
- S. R. Schmidt, G. Lischeid, T. Hintze and R. Adrian, Limnol. Oceanogr., 2019, 64, 423–440 CrossRef CAS.
- R. P. Buck and E. Lindner, Pure Appl. Chem., 1994, 66, 2527–2536 CAS.
| This journal is © The Royal Society of Chemistry 2023 |

