 Open Access Article
Cu-functionalised porous boron nitride derived from a metal–organic framework†
Tian
Tian
 *a,
Jiamin
Xu
b,
Ying
Xiong
ac,
Nitya
Ramanan
d,
Mary
Ryan
b,
Fang
Xie
 b and
Camille
Petit
 *a
*a
aBarrer Centre, Department of Chemical Engineering, Imperial College London, South Kensington Campus, London SW7 2AZ, UK. E-mail: tian.tian11@imperial.ac.uk; camille.petit@imperial.ac.uk
bDepartment of Materials, Imperial College London, South Kensington Campus, London SW7 2AZ, UK
cDepartamento de Química Inorgánica, Facultad de Ciencias, Universidad Autónoma de Madrid, Campus de Cantoblanco, Madrid 28049, Spain
dDiamond Light Source Ltd., Diamond House, Harwell Science and Innovation Campus, Didcot OX11 0DE, UK
First published on 6th September 2022
Abstract
Porous boron nitride (BN) displays promising properties for interfacial and bulk processes, e.g. molecular separation and storage, or (photo)catalysis. To maximise porous BN's potential in such applications, tuning and controlling its chemical and structural features is key. Functionalisation of porous BN with metal nanoparticle represents one possible route, albeit a hardly explored one. Metal–organic frameworks (MOFs) have been widely used as precursors to synthesise metal functionalised porous carbon-based materials, yet MOF-derived metal functionalised inorganic porous materials remain unexplored. Here, we hypothesise that MOFs could also serve as a platform to produce metal-functionalised porous BN. We have used a Cu-containing MOF, i.e. Cu/ZIF-8, as a precursor and successfully obtained porous BN functionalised with Cu nanoparticles (i.e. Cu/BN). While we have shown control of the Cu content, we have not yet demonstrated it for the nanoparticle size. The functionalisation has led to improved light harvesting and enhanced electron–hole separation, which have had a direct positive impact on the CO2 photoreduction activity (production formation rate 1.5 times higher than pristine BN and 12.5 times higher than g-C3N4). In addition, we have found that the metal in the MOF precursor impacts porous BN's purity. Unlike Cu/ZIF-8, a Co-containing ZIF-8 precursor led to porous C-BN (i.e. BN with a large amount of C in the structure). Overall, given the diversity of metals in MOFs, one could envision our approach as a method to produce a library of different metal functionalised porous BN samples.
1. Introduction
Porous boron nitride (BN) is a recent addition to the porous materials family.1–3 With alternating boron and nitrogen atoms linked via strong B–N covalent bonds arranged in an hexagonal pattern, the porous BN structure resembles that of activated carbon but its chemical properties differ. Benefiting from features such as a high surface area, a priori tunable chemistry and porosity, and high thermal stability, porous BN has recently attracted interests for various applications such as molecular storage and separation,4–9 catalysis (incl. photocatalysis),10–13 and drug delivery.14Chemical functionalisation can help tune the adsorptive, catalytic and optoelectronic properties of porous BN, all of which are relevant to the applications mentioned above. The functionalisation of BN-based materials using non-metal heteroatoms (e.g. C, O, P, S and Si) has been reported. Alongside this functionalisation route, the addition of metal atoms to porous BN provides an extra dimension to modulate the properties of the material. Metal functionalisation has been investigated in the case of non-porous hBN (SBET < 150 m2 g−1) for Ni,15,16 Pt,17,18 Cu,19 Pd,20,21 Au.22 Fewer studies exist in the case of porous BN and low surface area is often observed.23–27 Today, the challenge with metal functionalisation of porous BN remains to ensure distributed functionalisation while maintaining porosity.
We hypothesise that metal–organic frameworks (MOFs), i.e. porous crystalline materials obtained via self-assembly of metal clusters and organic linkers, could address the above challenge.28 Their typically high surface area, ordered arrangement of metal nodes, and carbon-rich nature, have made them attractive precursors to design porous materials, especially carbon-based porous materials.29–31 The use of MOFs as templates means that one could possibly embed well-dispersed metals in the final material.30 Yet, examples of MOF-derived inorganic porous materials, particularly BN, remain limited. We attribute this to the difficulty in removing carbon atoms while maintaining a high porosity. Recently though, Cao et al.32 used a low porosity boron-containing MOF as a precursor to synthesise porous BN. However, metal atoms in the MOF structure (i.e. Zn) were not present in the derived porous BN due to the high synthesis temperature.
Inspired by the work of Cao et al.32 and with the goal to decorate porous BN with metallic nanoparticles, we have developed a route to produce MOF-derived porous BN samples functionalised with Cu nanoparticles. More specifically, we have used a boric acid impregnated bimetallic MOF, Cu/ZIF-8, as a precursor to directly synthesise Cu functionalised porous BN with varying Cu contents. We selected ZIF-8 as a template for three reasons: (i) ZIF-8 is simple to synthesise and commercially available, facilitating any upscaling process; (ii) ZIF-8 can be easily functionalised with other metal clusters, e.g. Cu33 and Co;34 (iii) ZIF-8 acts as an additional N source for BN synthesis. We selected Cu nanoparticles to functionalise porous BN for three reasons as well: (i) Cu has been proved to act as a CO2 photoreduction co-catalyst;35–39 (ii) Cu presents excellent plasmonic properties and can be an alternative to noble plasmonic metals (e.g. Au, Ag);40,41 (iii) Cu-based MOFs are easy to synthesis and upscale.42–44 Employing analytical, spectroscopic, and imaging tools, we have evaluated the chemical, textural, morphological and optoelectronic properties of the resulting samples. Considering the chemical and physical features of the materials obtained along with the potential of porous BN for CO2 photoreduction,45 we have assessed the photocatalytic activity of the samples for CO2 reduction. The 5% Cu/BN sample presents 1.5 and 12.5 times higher product formation rate compared to pristine BN and a common photocatalyst, g-C3N4, respectively. Overall, the Cu/BN samples show enhanced CO2 photoreduction performance compared to pristine BN and we attribute this finding to two factors: (i) improved light harvesting due to the plasmonic properties of Cu nanoparticles; (ii) enhanced electron–hole separation capacity owing to the Cu–BN heterojunction. Due to the high surface area of porous BN and the additional surface functionalities from Cu nanoparticles, Cu/BN could be envisaged for other applications such as heterogeneous catalysis, molecular separation and gas storage. Finally, we have evaluated the impact of metal selection on the resulting material, using Co/ZIF-8 as a precursor.
2. Experimental section
2.1 Materials
Zinc nitrate hexahydrate (99%, CAS# 10196-18-6), copper nitrate trihydrate (99%, CAS# 10031-43-3), cobalt nitrate hexahydrate (99% CAS# 10026-22-9), 2-methylimidazole (99%, CAS# 693-98-1), boric acid (≥99.5%, CAS# 10043-35-3), ethanol (≥99.8%, CAS# 64-17-5), and melamine (99%, CAS# 108-78-1) were purchased from Fisher Scientific. All chemicals were used as received. The gases used in this study, NH3 (99.98%), N2 (99.9995%), and CO2 (99.999%) were purchased from BOC. H2 (99.9995%) was generated locally from deionized water using a Peak Scientific PH200 hydrogen generator.2.2 Synthesis of Cu/ZIF-8
Cu/ZIF-8 was synthesised following a method adapted from Schejn et al. work.33 A methanol solution of Zn(NO3)2·6H2O and Cu(NO3)2·3H2O (4 mmol in total with different molar ratios, 45 mL) was mixed with a methanol solution of 2-methylimidazole (2.62 g, 45 mL), and stirred at room temperature under N2 flow for 1 h. After centrifugation, the collected solid was washed in ethanol (150 mL, 3 times) and dried at 80 °C overnight. The solid was then transferred to a glass vial and was further dried at 120 °C under vacuum overnight. The derived samples are labelled as X% Cu/ZIF-8, where X indicates the nominal molar percentage of Cu(NO3)2·3H2O to total metal precursors (i.e. Cu(NO3)2·3H2O + Zn(NO3)2·6H2O). In this work, 0% (i.e. pure ZIF-8), 1%, 5%, and 10% Cu/ZIF-8 were synthesised.2.3 Synthesis of Cu functionalised porous BN
Boric acid (BA) was loaded into Cu/ZIF-8 following a wet impregnation method: 0.5 g of Cu/ZIF-8 powder was added to 20 mL of ethanol solution of BA (1 g) and stirred at room temperature for 24 h. The solution was then heated to 70 °C and the temperature was maintained until ethanol was completed evaporated. The solid was ground in a mortar and further dried at 120 °C under vacuum. The finely ground powder was then placed in an alumina boat crucible and transferred to a tubular furnace. The sample was initially degassed at room temperature under Ar flow (250 mL min−1) for 30 min, then heated to 1000 °C (5 °C min−1) under pure NH3 gas flow (100 mL min−1) and held isothermally for 3 h. The furnace was cooled naturally under NH3 down to 600 °C and then to room temperature under Ar. The derived samples are labelled as X% Cu/BN, where X is the same as that of the initial Cu/ZIF-8 sample. The sample obtained from pure ZIF-8 is referred to as BN. Overall the control of the Cu content in the Cu/BN samples results from the Cu content in the initial ZIF-8 structure and thus the ratio between Cu and B-containing species when forming BN. This is because both Cu and B remain during the thermal process.2.4 Synthesis of g-C3N4
Graphitic carbon nitride, g-C3N4, was synthesised by following the method reported by Dias et al.46 Melamine (4 g) was added to an alumina crucible. The crucible was covered with a lid and transferred to a muffle furnace. The sample was heated to 560 °C (5 °C min−1) and held isothermally for 4 h. The sample was then cooled naturally to room temperature and a yellow solid was collected.2.5 Synthesis of Co/ZIF-8
10% Co/ZIF-8 was synthesised as another MOF precursor. Zn(NO3)2·6H2O (1.07 g) and Co(NO3)2·6H2O (0.12 g) was dissolved in 45 mL of methanol. The solution was mixed with a methanol solution of 2-methylimidazole (2.62 g, 45 mL), and stirred at room temperature for 1 h. After centrifugation, the collected solid was washed in ethanol (150 mL, 3 times) and dried at 80 °C overnight. The solid was then transferred to a glass vial and further dried at 120 °C under vacuum overnight. The content of Co in ZIF-8 was selected solely to reflect one of the contents selected for Cu/ZIF-8 and allow direct comparison.2.6 Synthesis of Co functionalised C-BN
Co/C–BN was synthesised following the same method as that used to synthesise Cu/BN, except for using 0.5 g of Co/ZIF-8 rather than 0.5 g of Cu/ZIF-8.2.7 Material characterisation
Inductively coupled plasma mass spectrometry (ICP-MS) was performed on an Agilent 7900 ICP-MS. Prior to analysis, 0.01 g of sample was dispersed in 20 mL of 2% HNO3 and then diluted 200 times using 2% HNO3.
Cu K edge (8979 eV) X-ray absorption spectroscopy (XAS) measurements were performed at room temperature at the core X-ray absorption beamline B18 at Diamond Light Source.47 The samples were pressed into pellets for the measurement. A Si (111) double crystal monochromator was used for energy selection. A set of Pt coated mirrors were used to reject higher harmonics from the X-ray beam. The data were collected in transmission mode for all samples using a set of three ionization chambers placed in series and filled with appropriate mixtures of He and Ar. This allowed to simultaneously measure data on the sample and a reference Cu foil, with an energy resolution of 0.3 eV. Before the test, Cu/BN samples were kept at ambient environment for 20 days.
The relative chemical composition and the valence state of the elements were measured using X-ray photoelectron spectroscopy (XPS) on a Thermo Scientific K-Alpha+ X-ray photoelectron spectrometer equipped with a MXR3 Al Kα monochromated X-ray source (hν = 1486.6 eV). The samples were initially ground using an agate mortar and mounted on to a XPS sample holder using a small piece of conductive carbon tape. The X-ray gun power was set to 72 W (6 mA and 12 kV). The high-resolution spectra were obtained using 20 eV pass energy and 0.1 eV step size. We also conducted depth profiling by applying ion gun with energy of 1500 eV. The etch rate was 0.71 nm s−1 and the etch time was maintained at 70 s per etch cycle. XPS scans were taken at the etching depths of 0, 50, 100, 150 and 200 nm. The adventitious carbon (C–C) peak set at 284.8 eV was used for binding energy calibration. Thermo Avantage software was used to analyse the data.
N2 and CO2 adsorption isotherms were collected at 77 K and 298 K, respectively, using a Micromeritics 3Flex volumetric sorption analyser. The samples were initially degassed overnight at 120 °C at 0.2 mbar, followed by degas in situ at 120 °C for 4 h at around 0.003 mbar. The equivalent specific surface areas of the samples were determined using Brunauer–Emmett–Teller (BET) method.48 The micropore volume was determined using the Dubinin–Radushkevich model.49 The pore size distribution was derived from the build-in software from Micromeritics, using DFT model for carbon slit shape pores.
Scanning electron microscope (SEM) images were taken using a Zeiss Auriga microscope with an accelerating voltage of 5 kV. The samples were ground using an agate mortar, deposited on carbon tape and sputter-coated with 10 nm of chromium. To calculate the particle size distribution, 100 particles were randomly selected and measured by using ImageJ. Transmission electron microscope (TEM) images were taken using a FEI Titan 80-300 Cs image-corrected microscope. The samples were dispersed in ethanol and then drop-deposited on to a holey carbon film on 300 mesh copper grids.
Valence band X-ray photoelectron spectroscopy (XPS) and work function measurements were carried out on a Thermo Scientific K-Alpha+ X-ray photoelectron spectrometer equipped with a MXR3 Al Kα monochromated X-ray source (hν = 1486.6 eV). Samples were ground and mounted on the XPS holder using a conductive carbon tape. The spectra were obtained by using 15 eV pass energy and 0.05 eV step size. The work function was determined by measuring the secondary electron cut-off in the low kinetic energy region. A clean gold standard sample was used as a reference material for calibration. A sample bias of −29.47 eV was applied to the sample using an ion gun and 10 eV pass energy was used to obtain the cut-off spectra. To account for potential variations across the surface of the material, the work function was measured at four different locations and the average was taken.
![[thin space (1/6-em)]](https://www.rsc.org/images/entities/char_2009.gif) :
:![[thin space (1/6-em)]](https://www.rsc.org/images/entities/char_2009.gif) H2 mixture (2
H2 mixture (2![[thin space (1/6-em)]](https://www.rsc.org/images/entities/char_2009.gif) :
:![[thin space (1/6-em)]](https://www.rsc.org/images/entities/char_2009.gif) 1 v/v ratio) and irradiated for 5 h. A Xenon arc lamp (100 W, LCS-100 solar simulator, Newport) was used as the irradiation source with the distance from the lamp to the sample being 15 cm, providing the intensity at the catalyst surface to be 1000 W m−2. A long pass UV filter (λ < 400 nm) and a long pass visible filter (λ < 550 nm) were used to conduct the test under visible light irradiation. The evolved gases were detected and analysed using a Shimadzu GCMS-QP2020 NX equipped with Q-Bond (Shimadzu Rt-Q-Bond Plot Column 30 m, 0.32 mm ID, 10 μm) and molecular sieve columns (Shimadzu SH-Msieve 5A plot, 30 m, 0.32 mm ID, 30 μm) in series. The tests were repeated twice on new samples obtained from different synthesis batches. We also conducted control experiments to confirm the origin of the products, namely: (i) without irradiation, (ii) under N2/H2 atmosphere and (iii) under 13CO2/H2 atmosphere (13CO2 from BOC, 99 at% 13C). During the recyclability tests, the aforementioned process was repeated after each 5 h UV-vis irradiation cycle without opening the photoreactor. Between each cycle, the sample was activated under vacuum for 30 min at room temperature.
1 v/v ratio) and irradiated for 5 h. A Xenon arc lamp (100 W, LCS-100 solar simulator, Newport) was used as the irradiation source with the distance from the lamp to the sample being 15 cm, providing the intensity at the catalyst surface to be 1000 W m−2. A long pass UV filter (λ < 400 nm) and a long pass visible filter (λ < 550 nm) were used to conduct the test under visible light irradiation. The evolved gases were detected and analysed using a Shimadzu GCMS-QP2020 NX equipped with Q-Bond (Shimadzu Rt-Q-Bond Plot Column 30 m, 0.32 mm ID, 10 μm) and molecular sieve columns (Shimadzu SH-Msieve 5A plot, 30 m, 0.32 mm ID, 30 μm) in series. The tests were repeated twice on new samples obtained from different synthesis batches. We also conducted control experiments to confirm the origin of the products, namely: (i) without irradiation, (ii) under N2/H2 atmosphere and (iii) under 13CO2/H2 atmosphere (13CO2 from BOC, 99 at% 13C). During the recyclability tests, the aforementioned process was repeated after each 5 h UV-vis irradiation cycle without opening the photoreactor. Between each cycle, the sample was activated under vacuum for 30 min at room temperature.
3. Results and discussion
3.1 Characterisation of Cu/ZIF-8
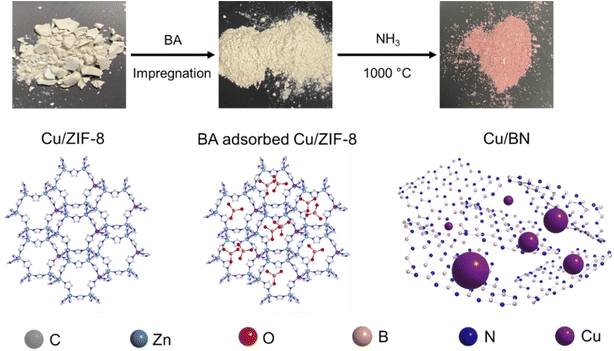
In this study, we synthesised porous Cu/BN samples using Cu/ZIF-8 samples as precursors (Scheme 1). We first analysed the composition, structure, and morphology of the precursors, i.e. ZIF-8, 1% Cu/ZIF-8, 5% Cu/ZIF-8, and 10% Cu/ZIF-8. The percentage refers to the molar percentage of Cu(NO3)2·3H2O to total metal precursors (i.e. Cu(NO3)2·3H2O + Zn(NO3)2·6H2O) of used to synthesise Cu/ZIF-8.Fig. 1a presents the optical images of the Cu/ZIF-8 samples which progressively changed colour from white to darker yellow with increasing Cu content. The PXRD patterns (Fig. 1b) indicate that both pure ZIF-8 and Cu/ZIF-8 samples exhibit the expected crystalline structure of ZIF-8. Upon adsorbing boric acid (BA), the PXRD patterns of BA-impregnated Cu/ZIF-8 did not change (Fig. 1c), confirming the MOF crystalline structure was maintained. This result differs from that reported by Cao et al.32 who instead observed the formation of a new phase.32 We attribute this difference to the milder soaking conditions used in this project (i.e. room temperature and ambient pressure). Despite their similar crystalline structures, ZIF-8 showed smaller particle size compared to Cu/ZIF-8 (Fig. S1†). We speculate that this difference relates to a change in nucleation rate in the presence of Cu2+.50 The porosity of the prepared samples was assessed using N2 sorption at 77 K (Fig. S2†). All samples showed a type I isotherm, indicating a predominantly microporous character. As shown in Table S1,† we did not observe differences in surface area and pore volume between each sample, suggesting the characteristic porosity of ZIF-8 was retained after the incorporation of Cu2+.
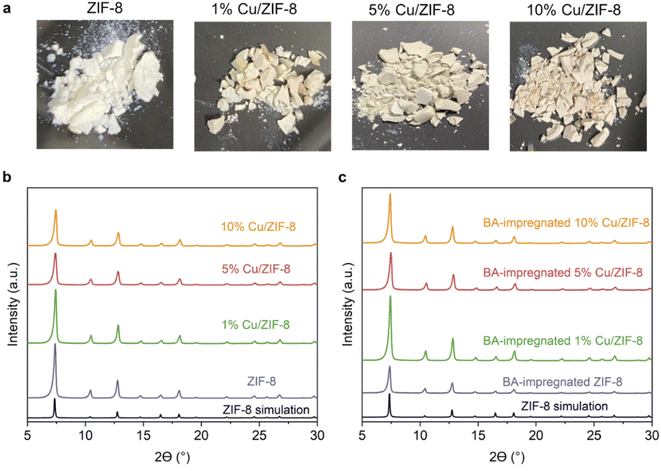 | ||
| Fig. 1 Appearance and structural features of ZIF-8 and Cu/ZIF-8 samples: (a) optical images; (b) XRD patterns; (c) XRD patterns of BA-impregnated Cu/ZIF-8 samples. | ||
3.2 Characterisation of Cu/BN
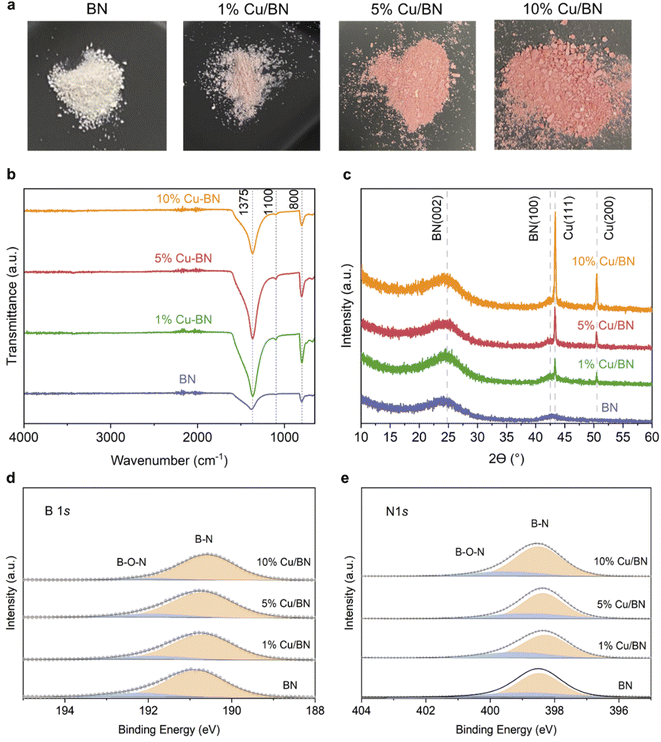
We used BA-impregnated Cu/ZIF-8 samples as self-sacrificial templates to form Cu/BN samples upon pyrolysis at 1000 °C under an NH3 atmosphere (Scheme 1). The ZIF-8 linker, along with NH3, provided the N source while BA provided the B source to form BN. We hypothesized that NH3 would also reduce Cu2+ inducing in situ Cu nanoparticles growth, while Zn (Tboiling = 907 °C) from ZIF-8 would be removed at high temperature.Fig. 2a shows the optical images of the Cu/BN samples and highlights the change of colour with different Cu contents: we observed a more pronounced pink/red colour with increasing Cu content (Cu content measured by ICP-MS analyses, Table 1). To gain further insight into the composition and structure of Cu/BN, we collected FTIR spectra. As shown in Fig. 2b, all samples displayed two main IR bands at ∼1375 cm−1 (B–N stretching) and ∼800 cm−1 (B–N–B bending),45 confirming the formation of BN. We noted an additional peak at ∼1100 cm−1, which we attribute to B–O bending, an impurity commonly found in porous BN.51,52Fig. 2c shows the PXRD patterns. All samples displayed two broad peaks corresponding to BN (002) and (100) planes, indicating the presence of turbostratic/amorphous BN.9 Cu/BN samples exhibited two additional sharp peaks at 43.5° and 50.5°, corresponding to Cu (111) and (200) planes, respectively.53 We did not observe any peak from copper oxide suggesting that Cu2+ from the template was reduced to metallic Cu, as hypothesised. To provide further support and evidence on the chemical nature and structure of the samples, we conducted high resolution XPS (Fig. 2d and e). The analysis of the core level spectra of B 1s and N 1s confirmed the formation of BN, evidenced by the peaks at ∼190.8 and ∼398.4 eV, respectively.9 The additional peaks at 192.2 eV on the B 1s spectrum and 399.5 eV on N 1s spectrum belong to the B–O–N bonds.9,54 Oxygen is a known and unavoidable impurity of porous BN due to surface oxidation. We noticed a low carbon content in all samples (Table S2†), most or part of which we attribute to adventitious impurities. The absence of Zn (Fig. S3 and S4†) together with the ICP-MS results suggest that all Zn atoms were removed during the high-temperature synthesis, due to the lower boiling point of Zn (907 °C) compared to the synthesis temperature (1000 °C). In addition, we did not observe any Cu peak on the XPS spectra of the Cu/BN samples (Fig. S3 and S4†). We speculate that this is because Cu particles are located within the bulk of the samples rather than their surface and/or because of the low Cu content in the samples.
| Sample | Cu content [wt%] | S BET [m2 g−1] | V mic [cm3 g−1] | V tot [cm3 g−1] |
|---|---|---|---|---|
| BN | 0 | 508 | 0.68 | 1.02 |
| 1% Cu/BN | 0.5 | 478 | 0.68 | 1.07 |
| 5% Cu/BN | 2.5 | 493 | 0.68 | 0.93 |
| 10% Cu/BN | 4.4 | 471 | 0.67 | 0.74 |
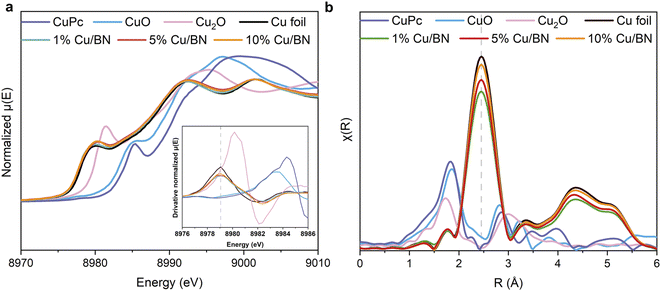
As we could not identify the chemical state of Cu using XPS, we instead performed X-ray absorption spectroscopy (XAS) measurements at Cu K edge on samples. Cu foil, CuO, Cu2O and CuPc (copper phthalocyanine) were used as reference samples. From the normalised Cu K-edge X-ray absorption near-edge (XANES) spectra in Fig. 3a, all the Cu/BN samples show the characteristic absorption edge and shape of metallic Cu (Cu0).55,56 The Fourier-transformed extended X-ray absorption fine structure (EXAFS) spectra (Fig. 3b) of all Cu/BN samples featured a peak at 2.45 Å, similar to that in Cu foil, and can be attributed to Cu–Cu bonds in the first coordination sphere.56 Both results indicated that the metallic Cu was the major component in Cu/BN and no oxidized Cu was observed, thereby supporting the XRD analyses. Here, our analyses indicated that Cu nanoparticles were sufficiently stabilized (i.e. surface oxidation remained below the detection limit of XAS) over a period of weeks under the protection of porous BN, suggesting the composite is likely to be useful for practical applications.
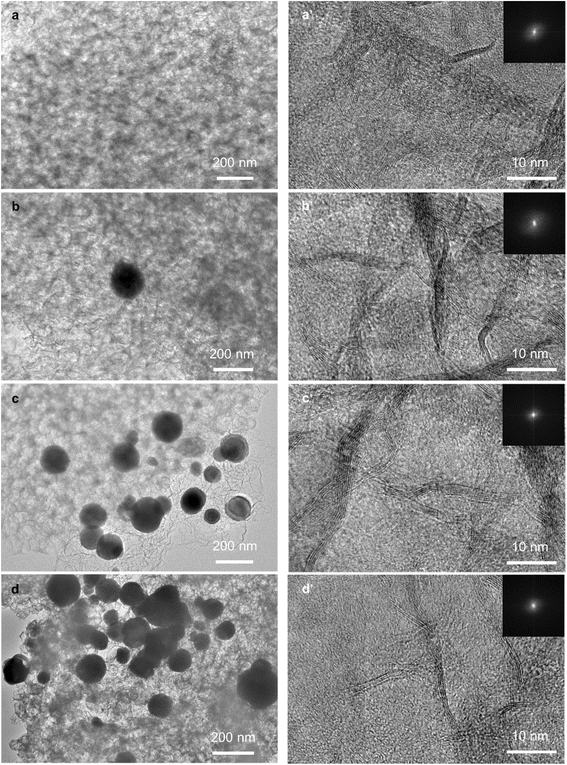
We characterised the morphology of BN and Cu/BN samples using SEM and TEM. The SEM images in Fig. S6† show that all samples presented a similar morphology: a densely packed flake structure, which is different from that of the template (i.e. MOF nanoparticles, Fig. S1†). Interestingly, we observed many pores ranging from 50–100 nm on the surface of the Cu/BN samples, possibly obtained upon removal of the MOF template. These macropores could facilitate mass transfer. TEM images with the fast Fourier transform (FFT) are shown in Fig. 4. All samples exhibited the disordered structure of BN, confirming the XRD analyses (Fig. 2c). The concentration of Cu particles on BN increased with increasing Cu content, while the particle size did not change noticeably. The particle sizes ranged from 30 to 300 nm, with an average diameter of ∼130 nm, as shown in Fig. S7.† The wide particle size distribution might result from the diffusion of Cu atoms across the BN surface, leading to heterogeneous Cu particle growth (or agglomeration).
We evaluated the porosity of the samples using N2 sorption isotherms at 77 K. All samples displayed a type IV isotherm with H3 hysteresis loop (Fig. 5), indicating the presence of slit-shaped micro- and mesopores. Doping with Cu particles did not significantly change the BET surface area (∼500 m2 g−1) and the micropore volume (∼0.7 cm3 g−1) of the derived BN. However, the total pore volume reduced upon doping, possibly due to Cu particles occupying the larger pores of BN (Table 1). The porosity in BN is linked to the formation and release of N- and C-containing porogens derived from the precursors.9,52,57
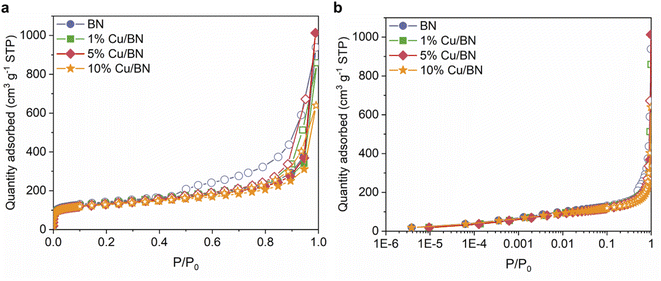 | ||
| Fig. 5 N2 sorption isotherms at 77 K for BN samples in (a) linear scale; (b) semi-log scale. Filled symbols: adsorption. Empty symbols: desorption. | ||
Finally, we investigated the optoelectronic properties of the Cu/BN samples using UV/vis diffuse reflectance spectroscopy (UV/vis DRS). The samples displayed two main absorption peaks at ∼210 and ∼250 nm, respectively, and these peaks remained almost unchanged upon addition of Cu particles (Fig. 6a). We link the first peak to residual hBN, the 2D non-porous analogue to porous BN, as a small portion of BN might be crystalline (Fig. 4a′–d′). This is supported by the moderate surface area of porous BN in the current work. The second peak with an absorption edge at 295 nm resembled that previously observed in highly porous (and amorphous) BN.45 Overall, the BN samples exhibited an estimated optical gap of 4.2 eV based on the band edge from the optical spectra. In addition, the spectra of the Cu/BN samples featured a broad band between 450 and 600 nm (Fig. 6b), attributed to the local surface plasmon resonance (LSPR) of Cu nanoparticles.58–60
3.3 CO2 photoreduction
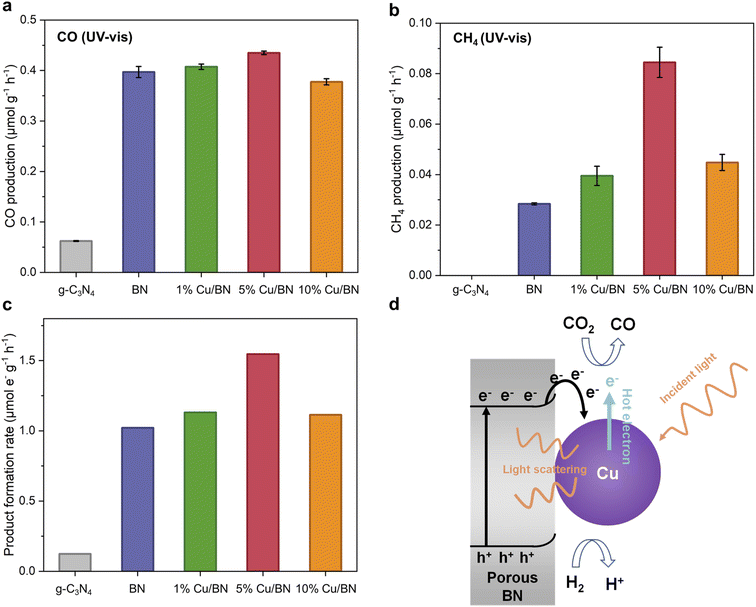
We tested the BN and Cu/BN samples for CO2 photoreduction gas phase without adding any co-catalyst or photosensitizer. We used graphitic carbon nitride (g-C3N4) as a reference sample due to its well-known visible light photocatalytic properties as well as its chemical and structural similarity to porous BN. Under UV-vis irradiation for 5 h, all BN samples led to both CO and CH4 formation, with CO as the primary product (Fig. 7). The CO production rate of Cu/BN samples increased by a factor of 6 or more compared to the reference sample. Although 5% Cu/BN had the highest CO production rate among all BN samples, its performance was only 10% higher than that of pure BN, indicating the limited impact of Cu particles on CO production. On the other hand, all Cu/BN presented a much higher CH4 production rate compared to pristine BN, particularly 5% Cu/BN (3 times higher performance, Fig. 7b). We link the higher CH4 production to the interactions between Cu(111) surface and CO and/or reaction intermediates, which can facilitate the formation of products like CH4 and limit the direct desorption of CO from the catalyst surface.39,61,62 The normalised total product formation rate (i.e. both CO and CH4) is shown in Fig. 7c. 5% Cu/BN performed the best among all samples, with a production rate 12.5 times and 1.5 times higher than those of g-C3N4 and pristine BN, respectively. We further tested the recyclability of 5% Cu/BN sample over 5 cycles (Fig. S9†). We observed a 12% decrease in product formation rate, which may be due to the degradation of the porous BN.45 We confirmed the origin of CO via a series of control tests: (i) test under dark, (ii) test under a N2/H2 atmosphere and (iii) test under a 13CO2/H2 atmosphere. We did not observe CO formation in the absence of light or CO2, while we detected 13CO when using 13CO2 (Fig. S10†). These results provide direct evidence that CO resulted from the reduction of CO2.We attribute the enhanced CO2 photoreduction efficiency of 5% Cu/BN compared to pristine BN to two aspects, namely, the plasmonic effect of the Cu nanoparticles and electron–hole separation through Cu–BN heterojunction. We focus first on the plasmonic effect. Plasmonic effect induced by metal nanoparticles, incorporated into semiconductors nanostructures, can modulate photocatalysis through three mechanistic pathways: light scattering, hot electron transfer, and plasmonic resonance induced energy transfer (PRIET).63,64 We here hypothesise that both light scattering and hot electron transfer contributed to the Cu/BN system. Light scattering is dominant in the LSPR band for large particles (typically larger than 50 nm in diameter).65–67 The Cu particles in 5% Cu/BN (123 ± 49 nm) are able to scatter the incident light, resulting in increased photon flux and thus enhanced light absorption. Hot electron transfer, a two-step energy transfer process is another mechanistic pathway due to the surface plasmon from Cu nanoparticles (step 1: hot electrons produced by Cu nanoparticle; step 2: hot electrons injected into other species).68 PRIET, which includes transferring plasmonic energy non-radiatively from plasmonic particles to semiconductor through dipole–dipole interactions in the near-field, is negligible in the Cu/BN system because we do not observe any characteristic plasmonic response from Cu particles above the bandgap of porous BN. We now look at the second aspect enhancing CO2 photoreduction efficiency electron, i.e. electron–hole separation. Indeed, the formation of Cu–BN heterojunction improves electron–hole separation compared to pristine BN as suggested by the PL emission spectrum of BN samples (Fig. 6c). Cu/BN samples displayed lower PL intensities compared to BN, suggesting a lower electron–hole recombination rate.69 This phenomenon is mainly attributed to the electron transfer from the conduction band of porous BN to Cu nanoparticles due to the lower work function of porous BN compared to Cu nanoparticles (3 eV vs. 4.65 eV). The higher work function of 5% Cu/BN compared to pristine BN (Fig. S11†) further suggests the electron transfer from BN to Cu, agreeing well with other Cu/semiconductor composites.39,70 The band structures of both pristine BN and 5% Cu/BN are displayed in Fig. S13.† Overall, the above discussion demonstrates the proposed mechanism of CO2 photoreduction using Cu/BN, which is illustrated in Fig. 7d. We provide further details on the photocatalytic activity of the materials in the ESI (Fig. S14–S16†).
3.4 Use of a different metal
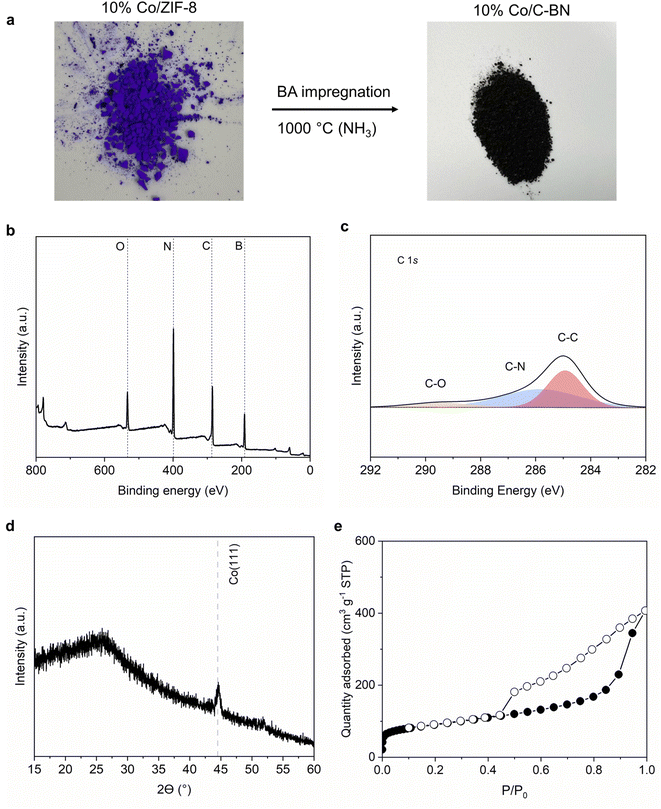
To further study how our synthesis approach would extend to other MOFs, we used 10% Co/ZIF-8 as a precursor while keeping the rest of the procedure unchanged. Fig. 8a shows a black sample was obtained after the heat treatment. The high carbon content (i.e. 29 at%) observed from XPS measurement (Table S3† and Fig. 8b and c) indicates C–BN rather than BN formed when using Co/ZIF-8 as precursor. 10% Co/C–BN displayed a broad peak at ∼26°, indicating the presence of amorphous C-BN (Fig. 8d). The sharp peak at ∼44.5° corresponds to Co (111).71 N2 adsorption isotherms indicates a type IV isotherm of 10% Co/C–BN (Fig. 8e) and BET surface area of 332 m2 g−1 (Table S4†). We attribute the formation of porous C–BN to the catalytic effects of cobalt. As reported by Esconjauregui et al.,72 cobalt catalysed the reaction of carbon-based gases into carbonaceous deposit at hight temperature. Given the high content of carbon in the MOF precursor, we hypothesise that a significant portion of carbon was deposited on BN rather than vaporized with the exposure of Co at elevated temperature. Esconjauregui et al. also suggested that only metals with fully filled d-orbitals (i.e. Zn and Cu) were inert enough to avoid catalysing such reactions, which agrees with our results. We conclude that the metal species in the MOF play an important role in the purity of the resulting BN.4. Conclusions
In this work, we provide the first synthesis route to metal-functionalised porous BN using MOF templates. We have synthesised Cu functionalised porous BN using a bimetallic MOF, Cu/ZIF-8, as a precursor and sacrificial template. We have found the metallic Cu particles remained stable (i.e. no significant surface oxidation) on the surface of porous BN. The Cu content in porous BN could be well controlled by varying the Cu concentration in the precursor (i.e. Cu/ZIF-8). As porous BN is a potential photocatalyst, we have also tested the CO2 photoreduction performance of Cu functionalised BN. The best-performing sample, 5% Cu/BN, presented improved CO2 photocatalytic performance by a factor of 12.5 in terms of product formation rate compared to the reference material g-C3N4 and by a factor of 1.5 compared to pristine BN. Finally, we have found that the metal species in the MOF precursor impacts the purity porous BN. Using a metal without fully filled d-orbitals (i.e. Co), we formed C-BN rather than BN. Overall, our synthetic approach resulted in the formation of a new metal-doped porous BN and can inspire further research on MOF-derived inorganic porous materials.Author contributions
Tian Tian: conceptualization, methodology, formal analysis, data curation, writing – original draft, writing – review & editing; Jiamin Xu: data curation, writing – review & editing; Ying Xiong: data curation, writing – review & editing; Nitya Ramanan: data curation, writing – review & editing; Mary Ryan: resource, writing – review & editing; Fang Xie: resource, writing – review & editing; Camille Petit: conceptualization, supervision, funding acquisition, writing – review & editing.Conflicts of interest
The authors declare no competing financial interests.Acknowledgements
The authors would like to thank Professor Stephen Skinner for providing the lab space to conduct the synthesis. The authors would also like to acknowledge funding from the European Research Council for the ERC Starting Grant THEIA (Project Number: 850624). M. R. acknowledges the funding support from Armourers and Brasiers Company. We acknowledge Diamond Light Source for beamtime on B18 (proposal sp27440).References
- R. Han, F. Liu, X. Wang, M. Huang, W. Li, Y. Yamauchi, X. Sun and Z. Huang, J. Mater. Chem. A, 2020, 8, 14384–14399 RSC.
- D. Gonzalez-Ortiz, C. Salameh, M. Bechelany and P. Miele, Mater. Today Adv., 2020, 8, 100107 CrossRef.
- J. Xiong, W. Zhu, H. Li, L. Yang, Y. Chao, P. Wu, S. Xun, W. Jiang, M. Zhang and H. Li, J. Mater. Chem. A, 2015, 3, 12738–12747 RSC.
- S. Marchesini, X. Wang and C. Petit, Front. Chem., 2019, 7, 1–9 Search PubMed.
- I. Ihsanullah, Chemosphere, 2021, 263, 127970 CrossRef CAS PubMed.
- S. Yu, X. Wang, H. Pang, R. Zhang, W. Song, D. Fu, T. Hayat and X. Wang, Chem. Eng. J., 2018, 333, 343–360 CrossRef CAS.
- D. Saha, G. Orkoulas, S. Yohannan, H. C. Ho, E. Cakmak, J. Chen and S. Ozcan, ACS Appl. Mater. Interfaces, 2017, 9, 14506–14517 CrossRef CAS PubMed.
- Y. Chao, B. Tang, J. Luo, P. Wu, D. Tao, H. Chang, X. Chu, Y. Huang, H. Li and W. Zhu, J. Colloid Interface Sci., 2021, 584, 154–163 CrossRef CAS PubMed.
- T. Tian, J. Hou, H. Ansari, Y. Xiong, A. L'Hermitte, D. Danaci, R. Pini and C. Petit, J. Mater. Chem. A, 2021, 9, 13366–13373 RSC.
- Y. Cao, R. Zhang, T. Zhou, S. Jin, J. Huang, L. Ye, Z. Huang, F. Wang and Y. Zhou, ACS Appl. Mater. Interfaces, 2020, 12, 9935–9943 CrossRef CAS PubMed.
- S. Nakamura, A. Takagaki, M. Watanabe, K. Yamada, M. Yoshida and T. Ishihara, ChemCatChem, 2020, 12, 6033–6039 CrossRef CAS.
- S. Büchele, Z. Chen, E. Fako, F. Krumeich, R. Hauert, O. V. Safonova, N. López, S. Mitchell and J. Pérez-Ramírez, Angew. Chem., 2020, 132, 19807–19812 CrossRef.
- X. Li, J. Zhang, S. Zhang, S. Xu, X. Wu, J. Chang and Z. He, J. Alloys Compd., 2021, 864, 158153 CrossRef CAS.
- Q. Weng, B. Wang, X. Wang, N. Hanagata, X. Li, D. Liu, X. Wang, X. Jiang, Y. Bando and D. Golberg, ACS Nano, 2014, 8, 6123–6130 CrossRef CAS.
- Z. Zhang, J. Su, A. S. Matias, M. Gordan, Y. S. Liu, J. Guo, C. Song, C. Dun, D. Prendergast, G. A. Somorjai and J. J. Urban, Proc. Natl. Acad. Sci., 2020, 117, 29442–29452 CrossRef CAS.
- K. Bu, J. Deng, X. Zhang, S. Kuboon, T. Yan, H. Li, L. Shi and D. Zhang, Appl. Catal., B, 2020, 267, 118692 CrossRef CAS.
- Y. Zhang, X. Weng, H. Li, H. Li, M. Wei, J. Xiao, Z. Liu, M. Chen, Q. Fu and X. Bao, Nano Lett., 2015, 15, 3616–3623 CrossRef CAS PubMed.
- C.-A. Lin, J. C. S. Wu, J.-W. Pan and C.-T. Yeh, J. Catal., 2002, 210, 39–45 CrossRef CAS.
- J. Liang, Q. Song, J. Wu, Q. Lei, J. Li, W. Zhang, Z. Huang, T. Kang, H. Xu, P. Wang, X. Zhou, P. K. Wong, H. Li, X. Meng, Z. Jiang and C.-S. Lee, ACS Nano, 2022, 16, 4152–4161 CrossRef CAS.
- Y. Chen, J. Cai, P. Li, G. Zhao, G. Wang, Y. Jiang, J. Chen, S. X. Dou, H. Pan and W. Sun, Nano Lett., 2020, 20, 6807–6814 CrossRef CAS.
- N. Meyer, K. Bekaert, D. Pirson, M. Devillers and S. Hermans, Catal. Commun., 2012, 29, 170–174 CrossRef CAS.
- T.-M. Tran-Thuy, C.-C. Chen and S. D. Lin, ACS Catal., 2017, 7, 4304–4312 CrossRef CAS.
- J. Liang, Q. Song, J. Lin, G. Li, Y. Fang, Z. Guo, Y. Huang, C. S. Lee and C. Tang, ACS Sustainable Chem. Eng., 2020, 8, 7454–7462 CrossRef CAS.
- M. Fan, J. D. Jimenez, S. N. Shirodkar, J. Wu, S. Chen, L. Song, M. M. Royko, J. Zhang, H. Guo, J. Cui, K. Zuo, W. Wang, C. Zhang, F. Yuan, R. Vajtai, J. Qian, J. Yang, B. I. Yakobson, J. M. Tour, J. Lauterbach, D. Sun and P. M. Ajayan, ACS Catal., 2019, 9, 10077–10086 CrossRef CAS.
- J. Wu, L. Wang, X. Yang, B. Lv and J. Chen, Ind. Eng. Chem. Res., 2018, 57, 2805–2810 CrossRef CAS.
- X. J. Yang, L. L. Li, W. L. Sang, J. L. Zhao, X. X. Wang, C. Yu, X. H. Zhang and C. C. Tang, J. Alloys Compd., 2017, 693, 642–649 CrossRef CAS.
- J. Wu, L. Qin, C. Wang, B. Lv, L. Wang, J. Chen and Y. Xu, RSC Adv., 2016, 6, 38356–38364 RSC.
- H. Furukawa, K. E. Cordova, M. O'Keeffe and O. M. Yaghi, Science, 2013, 341, 1230444 CrossRef PubMed.
- W. Yang, X. Li, Y. Li, R. Zhu and H. Pang, Adv. Mater., 2018, 31, 1804740 CrossRef PubMed.
- C. Wang, J. Kim, J. Tang, M. Kim, H. Lim, V. Malgras, J. You, Q. Xu, J. Li and Y. Yamauchi, Chem, 2020, 6, 19–40 CAS.
- J. Wang, Y. Wang, H. Hu, Q. Yang and J. Cai, Nanoscale, 2020, 12, 4238–4268 RSC.
- L. Cao, P. Dai, J. Tang, D. Li, R. Chen, D. Liu, X. Gu, L. Li, Y. Bando, Y. S. Ok, X. Zhao and Y. Yamauchi, J. Am. Chem. Soc., 2020, 142, 8755–8762 CrossRef PubMed.
- A. Schejn, A. Aboulaich, L. Balan, V. Falk, J. Lalevée, G. Medjahdi, L. Aranda, K. Mozet and R. Schneider, Catal. Sci. Technol., 2015, 5, 1829–1839 RSC.
- D. Saliba, M. Ammar, M. Rammal, M. Al-Ghoul and M. Hmadeh, J. Am. Chem. Soc., 2018, 140, 1812–1823 CrossRef CAS PubMed.
- J. Núñez, V. A. de la Peña O'Shea, P. Jana, J. M. Coronado and D. P. Serrano, Catal. Today, 2013, 209, 21–27 CrossRef.
- G. Shi, L. Yang, Z. Liu, X. Chen, J. Zhou and Y. Yu, Appl. Surf. Sci., 2018, 427, 1165–1173 CrossRef CAS.
- J. Zhao, Y. Li, Y. Zhu, Y. Wang and C. Wang, Appl. Catal., A, 2016, 510, 34–41 CrossRef CAS.
- T. Zhang, J. Low, X. Huang, J. F. Al-Sharab, J. Yu and T. Asefa, ChemCatChem, 2017, 9, 3054–3062 CrossRef CAS.
- I. Shown, H. C. Hsu, Y. C. Chang, C. H. Lin, P. K. Roy, A. Ganguly, C. H. Wang, J. K. Chang, C. I. Wu, L. C. Chen and K. H. Chen, Nano Lett., 2014, 14, 6097–6103 CrossRef CAS PubMed.
- Y. Xin, K. Yu, L. Zhang, Y. Yang, H. Yuan, H. Li, L. Wang and J. Zeng, Adv. Mater., 2021, 33, 2008145 CrossRef CAS PubMed.
- L. S. Jhuang, G. Kumar and F. C. Chen, Dyes Pigm., 2021, 188, 109204 CrossRef CAS.
- T. Tian, Z. Zeng, D. Vulpe, M. E. Casco, G. Divitini, P. A. Midgley, J. Silvestre-Albero, J.-C. Tan, P. Z. Moghadam and D. Fairen-Jimenez, Nat. Mater., 2018, 17, 174–179 CrossRef CAS PubMed.
- M. Rubio-Martinez, C. Avci-Camur, A. W. Thornton, I. Imaz, D. Maspoch and M. R. Hill, Chem. Soc. Rev., 2017, 46, 3453–3480 RSC.
- P. Silva, S. M. F. Vilela, J. P. C. Tomé and F. A. Almeida Paz, Chem. Soc. Rev., 2015, 44, 6774–6803 RSC.
- R. Shankar, M. Sachs, L. Francàs, D. Lubert-Perquel, G. Kerherve, A. Regoutz and C. Petit, J. Mater. Chem. A, 2019, 7, 23931–23940 RSC.
- E. M. Dias, K. C. Christoforidis, L. Francàs and C. Petit, ACS Appl. Energy Mater., 2018, 1, 6524–6534 CrossRef.
- A. J. Dent, G. Cibin, S. Ramos, A. D. Smith, S. M. Scott, L. Varandas, M. R. Pearson, N. A. Krumpa, C. P. Jones and P. E. Robbins, J. Phys. Conf. Ser., 2009, 190, 1–5 CrossRef.
- S. Brunauer, P. H. Emmett and E. Teller, J. Am. Chem. Soc., 1938, 60, 309–319 CrossRef CAS.
- S. G. Chen and R. T. Yang, Langmuir, 1994, 10, 4244–4249 CrossRef CAS.
- J. Cravillon, R. Nayuk, S. Springer, A. Feldhoff, K. Huber and M. Wiebcke, Chem. Mater., 2011, 23, 2130–2141 CrossRef CAS.
- S. Marchesini, A. Regoutz, D. Payne and C. Petit, Microporous Mesoporous Mater., 2017, 243, 154–163 CrossRef CAS.
- S. Marchesini, C. M. McGilvery, J. Bailey and C. Petit, ACS Nano, 2017, 11, 10003–10011 CrossRef CAS.
- M. Eslami, F. Golestani-fard, H. Saghafian and A. Robin, Mater. Des., 2014, 58, 557–569 CrossRef CAS.
- S. Marchesini, A. Regoutz, D. Payne and C. Petit, Microporous Mesoporous Mater., 2017, 243, 154–163 CrossRef CAS.
- J. Boita, L. Nicolao, M. C. M. Alves and J. Morais, New J. Chem., 2017, 41, 14478–14485 RSC.
- L. Yuan, S. F. Hung, Z. R. Tang, H. M. Chen, Y. Xiong and Y. J. Xu, ACS Catal., 2019, 9, 4824–4833 CrossRef CAS.
- A. L'Hermitte, D. M. Dawson, P. Ferrer, K. Roy, G. Held, T. Tian, S. E. Ashbrook and C. Petit, J. Phys. Chem. C, 2021, 125, 27429–27439 CrossRef.
- P. A. Desario, J. J. Pietron, T. H. Brintlinger, M. McEntee, J. F. Parker, O. Baturina, R. M. Stroud and D. R. Rolison, Nanoscale, 2017, 9, 11720–11729 RSC.
- Y. Huang, Z. Liu, G. Gao, G. Xiao, A. Du, S. Bottle, S. Sarina and H. Zhu, ACS Catal., 2017, 7, 4975–4985 CrossRef CAS.
- A. A. Mujeeb, N. A. Khan, F. Jamal, K. F. Badre Alam, H. Saeed, S. Kazmi, A. W. F. Alshameri, M. Kashif, I. Ghazi and M. Owais, Front. Chem., 2020, 8, 1–12 CrossRef PubMed.
- H. Yang, Y. Wu, G. Li, Q. Lin, Q. Hu, Q. Zhang, J. Liu and C. He, J. Am. Chem. Soc., 2019, 141, 12717–12723 CrossRef CAS PubMed.
- C. Shi, H. A. Hansen, A. C. Lausche and J. K. Nørskov, Phys. Chem. Chem. Phys., 2014, 16, 4720–4727 RSC.
- W. Hou and S. B. Cronin, Adv. Funct. Mater., 2013, 23, 1612–1619 CrossRef CAS.
- Q. Jiang, C. Ji, D. J. Riley and F. Xie, Nanomater, 2019, 9(1), 1 Search PubMed.
- N. Wu, Nanoscale, 2018, 10, 2679–2696 RSC.
- T. G. U. Ghobadi, A. Ghobadi, E. Ozbay and F. Karadas, ChemPhotoChem, 2018, 2, 161–182 CrossRef CAS.
- S. K. Cushing, A. D. Bristow and N. Wu, Phys. Chem. Chem. Phys., 2015, 17, 30013–30022 RSC.
- M. Kim, M. Lin, J. Son, H. Xu and J.-M. Nam, Adv. Opt. Mater., 2017, 5, 1700004 CrossRef.
- L. Xiao, Q. Zhang, P. Chen, L. Chen, F. Ding, J. Tang, Y. J. Li, C. T. Au and S. F. Yin, Appl. Catal., B, 2019, 248, 380–387 CrossRef CAS.
- C. De Melo, M. Jullien, Y. Battie, A. En Naciri, J. Ghanbaja, F. Montaigne, J. F. Pierson, F. Rigoni, N. Almqvist, A. Vomiero, S. Migot, F. Mücklich and D. Horwat, ACS Appl. Mater. Interfaces, 2018, 10, 40958–40965 CrossRef CAS.
- X. Yuan, X.-X. Hu, X.-L. Ding, H.-C. Kong, H.-D. Sha, H. Lin, W. Wen, G. Shen, Z. Guo, Z.-F. Ma and Y. Yang, Nanoscale Res. Lett., 2013, 8, 478 CrossRef PubMed.
- S. Esconjauregui, C. M. Whelan and K. Maex, Carbon, 2009, 47, 659–669 CrossRef CAS.
Footnote |
| † Electronic supplementary information (ESI) available. See https://doi.org/10.1039/d2ta05515e |
| This journal is © The Royal Society of Chemistry 2022 |

