 Open Access Article
Selected pharmaceutical analysis in a wastewater treatment plant during COVID-19 infection waves in South Africa†
Nikitha
Inarmal
 and
Brenda
Moodley
 *
*
School of Chemistry and Physics, University of KwaZulu-Natal, Westville Campus, 4000, South Africa. E-mail: 215001342@stu.ukzn.ac.za; moodleyb3@ukzn.ac.za
First published on 28th March 2023
Abstract
Globally, an extensive range of pharmaceuticals are consumed daily to treat a variety of illnesses and diseases. Since the occurrence of the SARS-CoV-2 virus (COVID-19) outbreak, the use of pharmaceuticals has increased drastically in order to treat and prevent infection. Studies have shown that pharmaceutical usage is largely dependent on seasonal temperatures. This was explored in the present study and was verified by the results obtained. Versatile solid phase extraction (SPE) and liquid chromatography–mass spectrometry (LC–MS) methods were developed and validated for the accurate detection of target pharmaceuticals. Method percentage recoveries ranged from 73.53–100.70%, while the limit of detection (LOD) and limit of quantification (LOQ) ranged from 0.0330–0.886 mg L−1 and 0.0990–2.68 mg L−1, respectively. Resulting concentrations of pharmaceuticals used to treat chronic ailments such as diabetes, hypertension, tuberculosis and HIV/AIDS showed consistent daily usage while pharmaceuticals used for the treatment of COVID-19 and influenza showed distinct seasonal trends. Concentrations obtained for sulfamethoxazole hydroxylamine and sulfamethoxazole ranged from 0.05215–0.3438 mg L−1 and 0.009818–0.3002 mg L−1, respectively, while concentrations quantified for prednisolone and ivermectin ranged from 0.008775–0.4482 mg L−1 and 0.008520–0.979 mg L−1, respectively. Trends also directly correlated with the total number of active COVID-19 cases experienced in South Africa during sampling periods and this was confirmed using a one-way ANOVA test. P-values obtained for sulfamethoxazole hydroxylamine, sulfamethoxazole and ivermectin were below 0.05.
Water impactThe presence of selected pharmaceuticals used to treat COVID-19 infections was determined in a wastewater treatment plant and shows how the COVID-19 pandemic may have affected the concentration levels of these emerging contaminants in the environment. This study presents for the first time, to the best of our knowledge, the concentrations of ivermectin in a wastewater treatment plant during the infection waves experienced in South Africa. |
1. Introduction
Over the past century, the field of medicine has made significant progress in the lengthening of life expectancy and reduction of morbidity.1 Presently, more than 3000 chemical compounds have been approved by various regulatory bodies as constituents of pharmaceutical products.2 Pharmaceuticals are not entirely metabolised by the human body and are excreted either unchanged or as metabolites.3Wastewater refers to used water that encompasses any combination of industrial, commercial, medical, domestic, and agricultural activities, stormwater, and sewer inflow.4 Pharmaceutical contaminants are not sufficiently removed during conventional processes operated at most WWTPs. Therefore, their occurrence in environmental media, such as water bodies, implies possible danger to overall public health, biota, and the environment.4 There is increasing indication that a wide variety of pharmaceuticals persist in natural water resources.5 These organic pollutants are classed within the emerging contaminants (EC) group and enter various water systems through sewage, leeching, industrial waste and improper disposal. The detection of pharmaceuticals in South African water systems has increased sporadically over the last few years. Adverse effects associated with this phenomenon includes bacterial resistance to numerous antibiotics, feminisation and infertility amongst aquatic animals and unnecessary exposure of these animals to pharmaceuticals that they simply do not need. The desired characteristic when it comes to medication is persistence within the human body to aid in the healing of various ailments however, this often leads to the same persistence observed within the environment.6
The SARS-CoV-2 (COVID-19) outbreak affected the world in 2020. The World Health Organisation (WHO) classified this outbreak as a global pandemic. COVID-19 is a highly contagious respiratory virus that has resulted in the loss of millions of lives globally.7 The occurrence of the global pandemic gave rise to a substantial increase in the use of pharmaceuticals to prevent and treat infections. Pharmacies and medical facilities reported an increased demand for pharmaceuticals such as antibiotics, antivirals and immunosuppressants during this period.7 Although interactions between humans play a vital role in transmission of the virus, temperature and humidity were found to affect virus survival as well as human immune functioning and response.8 During the period of time in which COVID-19 was discovered and became classified as a global pandemic, geographical regions that experienced higher ambient temperatures (being >20 °C), were found to have reported lower number of COVID-19 cases compared to regions that experienced lower temperatures apart from other meteorological conditions such as precipitation, wind speed and solar radiation that were also found to have had effects on transmission.8 The consumption of certain pharmaceuticals, inclusive of antimicrobials and antibiotics, has a distinct seasonal trend of increased usage during the winter months and decreased usage in the summer months, both of which ran parallel with influenza and COVID-19 cases.9 Epidemiologists in South Africa predicted the end of the fourth COVID-19 infection wave to occur at the end of January 2022. The start of the potential fifth wave was forecasted for April 2022. The peak of the fifth wave was experienced around June 2022, during the cold, winter month. Using this information, sampling trips were centred around these periods of time in order to compare pharmaceutical concentrations during the high and low infection periods. In South Africa, ivermectin has been used as a treatment for COVID-19 infection. Initially, the use of ivermectin to treat the virus was prohibited as there were limited available studies on the effectiveness of this drug in the treatment of COVID-19. In January 2021, the South African Health Products Regulatory Authority (SAHPRA) approved the use of ivermectin in the treatment of COVID-19, but only under controlled, compassionate usage under Section 21 of the Medicines and Related Substances Act.10 Despite the initial prohibition of widespread use of ivermectin, the drug was largely available on the black market. In May 2022 SAHPRA had terminated the compassionate usage of ivermectin programme on the basis that additional large scale clinical studies had shown little to no improvement in COVID-19 cases with the use of ivermectin. Additionally, the regulatory body had expressed a rapid decline in the number of patients and medical facilities applying for usage and dispensing of the drug.11
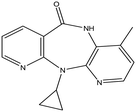
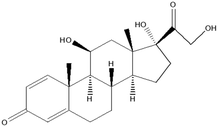
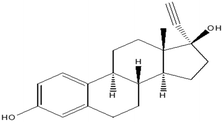
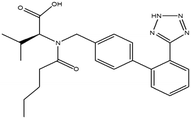
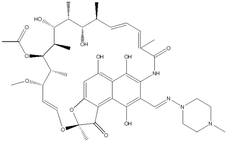
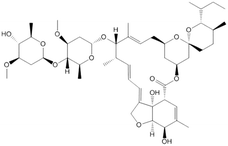
This research study aims to identify and quantify the concentrations of selected pharmaceuticals and metabolites present in the influent stream at a Wastewater Treatment plant situated in KwaZulu-Natal. Pharmaceuticals of interest were selected due to them being used for medical conditions that are prevalent in South Africa as well as being commonly prescribed to treat and prevent COVID-19 and influenza. These analytes of interest are outlined in Table 1. Additionally, the study aimed to show trends that exist between pharmaceutical usage and seasonal changes.
2. Methods and materials
2.1. Chemicals and reagents
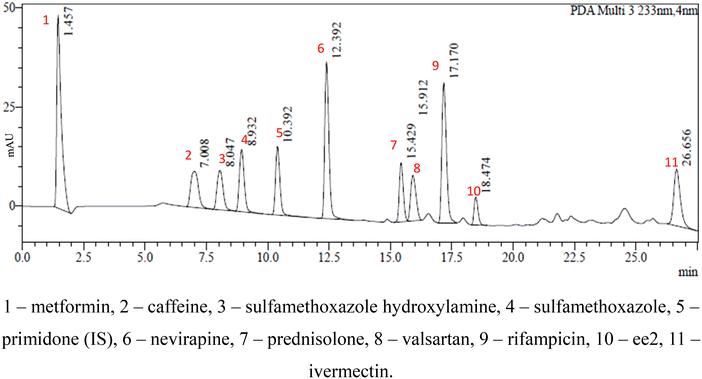
This study involved the analysis of ten pharmaceutical standards and one internal standard (IS). Certified reference standards used for analysis included metformin, caffeine, sulfamethoxazole hydroxylamine, sulfamethoxazole, primidone (IS), nevirapine, prednisolone, valsartan, rifampicin, EE2 and ivermectin, all of which were purchased from Sigma Aldrich (South Africa) and DLD Scientific. HPLC grade methanol was purchased from Sigma Aldrich, South Africa. Oasis® HLB cartridges (60 mg, 3 cc) were purchased from Microsep (Pty). Millipore water used for experimental analysis was obtained from a Synergy® UV water purification system.2.2. Study site and sampling procedure
The study site for this research project was a WWTP situated in Pietermaritzburg, KwaZulu-Natal. Fig. 1(A) depicts a map of South Africa with the province KwaZulu-Natal highlighted. An expansion of KwaZulu-Natal, shown in Fig. 1(B), highlights the location of Pietermaritzburg in relation to the province. Treated wastewater effluent from the WWTP flows directly into a nearby receiving river which serves as a source of water for domestic and agricultural use.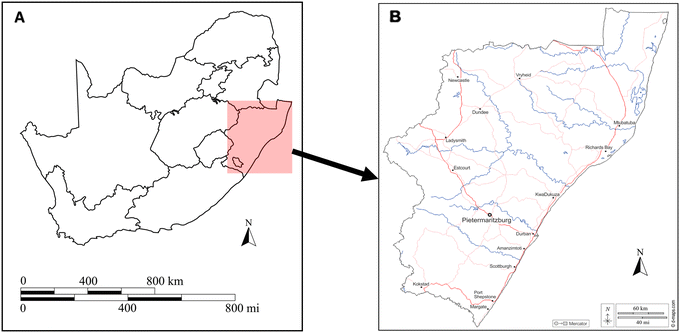 | ||
| Fig. 1 Geographical location of A) South Africa as a country and B) Pietermaritzburg study area within KwaZulu-Natal.12 | ||
Wastewater samples were collected from four sampling sites within the WWTP, which services the Pietermaritzburg population. Sampling points include the inlet, balancing tank, secondary effluent and maturation river. Samples were collected for seven consecutive days (Monday to Sunday) over three sampling periods, February 2022, April 2022 and June 2022. Wastewater samples were collected in glass amber bottles and sample pH was recorded immediately after collection, prior to being acidified with acetic acid for preservation. These pH values are included in the ESI† (S1). The samples were kept on ice during transportation to the laboratory. At the laboratory, samples were stored in the fridge at 4 °C. Filtration and extraction of all samples were performed within two weeks of collection.
| Parameter | ||
|---|---|---|
| Column | Shimadzu, Shim-pack GIST reversed phase C18 column, 2.1 × 100 mm, 3 μm | |
| Flow rate | 0.22 mL min−1 | |
| Injection volume | 5.00 μL | |
| Mobile phases | A: millipore water + 5 mM ammonium acetate + 3 mM acetic acid | |
| B: 100% MeOH | ||
| Gradient | Time/min | %B |
| 0.01 | 20 | |
| 1.00 | 20 | |
| 18.50 | 90 | |
| 22.50 | 90 | |
| 25.00 | 20 | |
| 27.50 | 20 | |
| Mass spectrometer | Single quadrupole, electrospray ionisation (ESI) | |
| Ionisation chamber/interface bias voltage: −3.50 kV | ||
| Ion source temperature: 200 °C | ||
| Detector voltage: −1.45 kV | ||
2.3. Response factors
Response factors (RF) were obtained for each analyte over each of the three sampling periods and show fairly consistent results confirming the stability of the instrument during analysis. The response factors were calculated by means of eqn (1). The internal standard (IS) used for this study was primidone. Table 3 below outlines RFs obtained for the study. | (1) |
| Analyte | Seasonal response factors | ||
|---|---|---|---|
| Feb 2022 | April 2022 | Jun 2022 | |
| Metformin | 1.62 | 1.59 | 1.65 |
| Caffeine | 0.96 | 1.01 | 0.93 |
| Sulfamethoxazole hydroxylamine | 0.89 | 0.85 | 0.92 |
| Sulfamethoxazole | 0.97 | 0.98 | 1.01 |
| Nevirapine | 1.23 | 1.19 | 1.22 |
| Prednisolone | 0.89 | 0.93 | 0.91 |
| Valsartan | 0.91 | 0.90 | 0.92 |
| Rifampicin | 1.09 | 1.12 | 1.06 |
| EE2 | 0.72 | 0.73 | 0.79 |
| Ivermectin | 1.02 | 0.99 | 0.98 |
2.4. Statistical analysis
Statistical analysis for this study was performed using Microsoft Excel Analysis ToolPak. The analysis is expressed by means of a one-way ANOVA. The concentrations of selected pharmaceuticals were compared against the various sampling campaigns to determine whether there were statistically significant differences between sampling campaigns. Significant differences are recorded as a factor of p < 0.05.3. Results and discussion
3.1. Method development and validation
Parameters that were investigated to validate the extraction method includes linearity, limit of detection (LOD), limit of quantification (LOQ), percentage recovery, interday and intraday analyses – all of which are described in Table 4.| Pharmaceutical | LOD/mg L−1 | LOQ/mg L−1 | Recovery/% | Interday/%RSD | Intraday/%RSD | R 2 |
|---|---|---|---|---|---|---|
| Metformin | 0.322 | 0.974 | 83.17 | 3.75 | 2.63 | 0.9909 |
| Caffeine | 0.033 | 0.099 | 86.42 | 2.32 | 1.47 | 0.9936 |
| Sulfamethoxazole hydroxylamine | 0.071 | 0.214 | 79.65 | 4.52 | 3.22 | 0.9957 |
| Sulfamethoxazole | 0.072 | 0.219 | 73.53 | 0.96 | 1.58 | 0.9942 |
| Nevirapine | 0.066 | 0.200 | 100.7 | 1.36 | 1.61 | 0.9971 |
| Prednisolone | 0.886 | 2.684 | 95.56 | 1.05 | 1.89 | 0.9970 |
| Valsartan | 0.220 | 0.667 | 89.61 | 1.84 | 1.91 | 0.9950 |
| Rifampicin | 0.062 | 0.187 | 82.33 | 0.56 | 1.31 | 0.9933 |
| EE2 | 0.215 | 0.653 | 105.8 | 1.21 | 1.07 | 0.9938 |
| Ivermectin | 0.589 | 1.784 | 88.35 | 1.54 | 1.63 | 0.9952 |
The determination of LOD and LOQ values is necessary to identify the lowest analyte concentrations that can be detected and quantified by the instrument, respectively. In this study, LOD values ranged from 0.033 to 0.886 mg L−1, while LOQ values ranged from 0.099 to 2.684 mg L−1. The purpose of conducting recovery tests is to ensure the efficiency of the methods used for the extraction of selected analytes. Recoveries of analytes ranged from 73.53 to 105.8% analyte recovered which fell within the accepted recovery range of 70 to 120%. The importance of interday and intraday analyses relates to its ability to indicate the instrument's ability to reproduce consistent data output and is expressed as percentage relative standard deviation (%RSD). To ensure reliable reproducibility, %RSD values for the interday and intraday analyses should be below 10%.14 The results obtained are all below 5% which is indicative of consistency in the instrument's ability for the analysis performed in this study. R2 values corresponding to linearity of calibration curves for each analyte were all 0.9909 and above. A value of 1.000 for linearity is ideal. The method validation parameters shown in Table 3 are suggestive that the methods used for the extraction and analysis of analytes were suitable for the study.
3.2. Concentrations of pharmaceuticals and metabolites
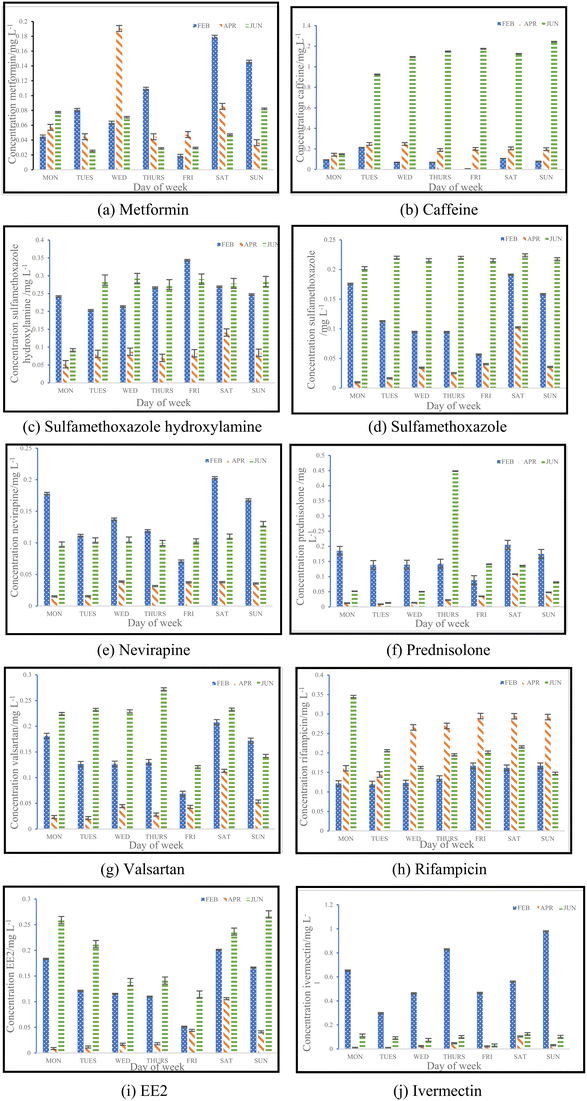
For this study, a total of ten pharmaceuticals were quantified in wastewater influent samples which represented eight different pharmaceutical classes. The results obtained are shown in Fig. 3(a) to (j), which outlines the various influent concentrations quantified. Detailed results outlining tables of concentrations are included in ESI† (S2). Major variations observed between inlet concentrations can be linked to numerous factors, some of which includes daily variations in the human consumption of these pharmaceuticals or pollution events between the three sampling periods.![[thin space (1/6-em)]](https://www.rsc.org/images/entities/char_2009.gif) 435 babies were born and registered for the year 2016.15 From the data set, it was found that the months of March and September had the highest births compared to other months of the year. This implies that increased conception was found in June, which is winter, and December, which is the festive season.14 The data obtained in this study verifies the information given by Stats SA, indicating that more babies are conceived in June. This would explain the significant increase in the use of contraceptives observed, as there would be a rise in sexual activity during this time of the year. The results from an ANOVA test performed for caffeine and EE2 indicated that each pharmaceutical showed significant seasonal differences in concentrations, by means of p < 0.05. Caffeine had a p-value of 9.65 × 10⁻⁷, while EE2 had a p-value of 5.98× 10⁻⁵.
435 babies were born and registered for the year 2016.15 From the data set, it was found that the months of March and September had the highest births compared to other months of the year. This implies that increased conception was found in June, which is winter, and December, which is the festive season.14 The data obtained in this study verifies the information given by Stats SA, indicating that more babies are conceived in June. This would explain the significant increase in the use of contraceptives observed, as there would be a rise in sexual activity during this time of the year. The results from an ANOVA test performed for caffeine and EE2 indicated that each pharmaceutical showed significant seasonal differences in concentrations, by means of p < 0.05. Caffeine had a p-value of 9.65 × 10⁻⁷, while EE2 had a p-value of 5.98× 10⁻⁵.
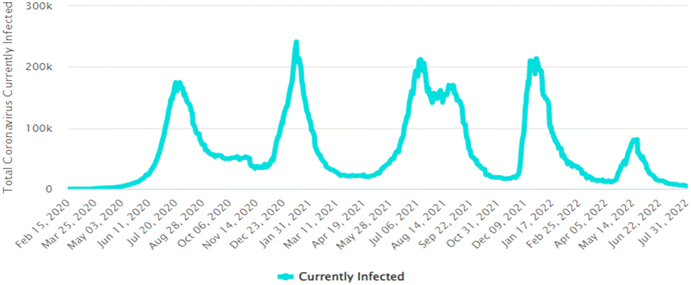 | ||
| Fig. 4 Graphical representation of total active COVID-19 cases in South Africa.16 | ||
| Sampling period | Average number of active cases |
|---|---|
| 31 January–6 February 2022 | 52![[thin space (1/6-em)]](https://www.rsc.org/images/entities/char_2009.gif) 393 393 |
| 18–24 April 2022 | 20![[thin space (1/6-em)]](https://www.rsc.org/images/entities/char_2009.gif) 048 048 |
| 6–12 June 2022 | 23![[thin space (1/6-em)]](https://www.rsc.org/images/entities/char_2009.gif) 847 847 |
| Analyte | Concentration range/μg L−1 | Source | Region | Ref. |
|---|---|---|---|---|
| a Average concentration. | ||||
| Sulfamethoxazole hydroxylamine | 52.15–343.8 | Wastewater influent | KwaZulu-Natal | Present study |
| Sulfamethoxazole | <LOD – 0.3011 | Wastewater influent | Pennsylvania | 17 |
| <LOD – 0.4869 | Wastewater effluent | Pennsylvania | 17 | |
| 9.818–300.2 | Wastewater influent | KwaZulu-Natal | Present study | |
| Prednisolone | 8.775–448.2 | Wastewater influent | KwaZulu-Natal | Present study |
| Ivermectin | 1.500a | Wastewater effluent | Spain | 18 |
| 8.520–979.4 | Wastewater influent | KwaZulu-Natal | Present study | |
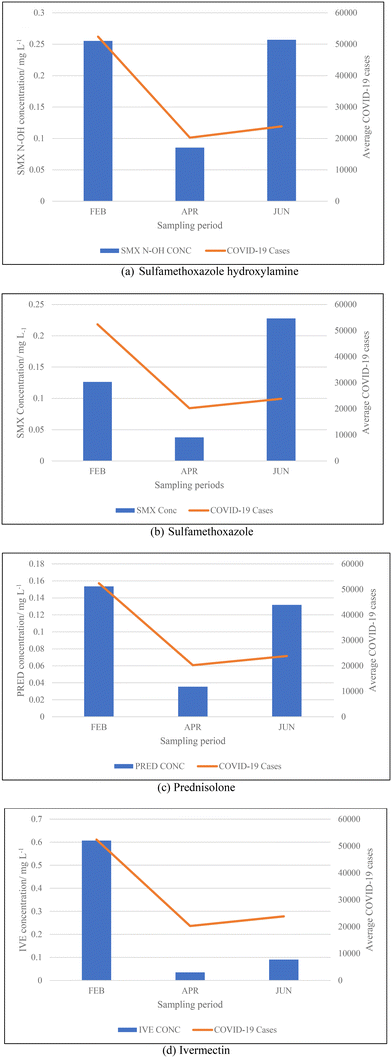
Collating the data obtained from Fig. 3(c), (d), (f) and (j) with the data shown in Table 5, Fig. 5 depicts the relationship that exists between weekly average pharmaceutical concentration and weekly average COVID-19 cases experienced during sampling periods.
From the data illustrated in Fig. 5(a) and (b), the samples taken in February 2022 were found to have had substantially high concentrations of antibiotics – sulfamethoxazole hydroxylamine and sulfamethoxazole, which are metabolite and parent compound, respectively. Concentrations during this period of time for sulfamethoxazole hydroxylamine and sulfamethoxazole ranged from 0.2035 to 0.3438 mg L−1 and 0.05661 to 0.1912 mg L−1, respectively. This correlates to the data shown in Table 5, which indicates that the higher number of active COVID-19 cases were during February, when compared to the other two sampling months. The concentrations of hydroxylamine sulfamethoxazole and sulfamethoxazole quantified in June 2022 were comparable to that found in February 2022, as shown in Fig. 5(a) and (b), albeit the total number of active COVID-19 cases were substantially lower. Concentrations found for the parent compound ranged from 0.2023 to 0.3061 mg L−1 and metabolite concentrations were between 0.09136 and 0.2921 mg L−1. This can be attributed to June being a colder month and the start of the influenza season experienced in South Africa. An increase in the prescription of sulfamethoxazole containing antibiotics used to treat influenza would have contributed to the high concentrations found in wastewater samples. Prednisolone concentrations, depicted in Fig. 5(c), follows a similar usage trend when comparing results to the curve shown in Fig. 4. Prednisone was predominantly used for the treatment of COVID-19, this was confirmed as the highest concentrations of its major metabolite, prednisolone, were found in February 2022 (0.0883 to 0.2052 mg L−1), corresponding to the highest number of active cases recorded. A rapid decline in usage is observed in April 2022, which directly corresponds to the lowest number of active cases recorded for this period of time. Thereafter, a slight rise in concentration is observed as the COVID-19 cases start to pick up again in June 2022 (0.01343 to 0.4482 mg L−1). This is illustrated in Fig. 5(c). The 0.4482 mg L−1 prednisolone outlier observed within Fig. 3(f) could be resultant of irregular usage, as prednisone tablets will have to be internally metabolised by the human body in order to become prednisolone, which was detected. Concentrations of ivermectin found during sampling trips, illustrated in Fig. 3(j), shows direct correlation to the data shown in Fig. 4 and Table 5. As shown in Fig. 5(d), the highest observed concentrations were found in February 2022, ranging from 0.2979 to 0.9794 mg L−1. A major decrease in ivermectin usage is observed as the COVID-19 fifth wave approached. Concentrations quantified for April ranged from 0.00818 to 0.1043 mg L−1, while June concentrations ranged from 0.07600 to 0.1246 mg L−1. This could be due to the fewer number of active cases recorded for this period as well as the prohibition of the use of ivermectin as per SAHPRA. Furthermore, the low concentrations observed could be due to the fact that most people were now vaccinated against COVID-19 as well as milder COVID-19 cases were being experienced as the virus continued to mutate. The ANOVA test was performed for each pharmaceutical within this category. Sulfamethoxazole hydroxylamine, sulfamethoxazole and ivermectin all showed significant differences between seasons as p < 0.05. P-values obtained were as follows, sulfamethoxazole hydroxylamine, p = 6.85 × 10⁻⁶; sulfamethoxazole, p = 1.47 × 10⁻⁷ and ivermectin, p = 4.37 × 10⁻⁷. Prednisolone showed no significant difference as p = 0.05579, which is greater than the significance level of 0.05. This is resultant of the single outlier obtained during the Thursday sample from the June sampling campaign. If the Thursday outlier was instead a result within the concentration range for the sampling campaign, then the ANOVA test would indicate a significant difference between the different sampling campaigns, i.e., p < 0.05.
3.2.3.1. Comparison of concentrations for pharmaceuticals used for the treatment of COVID-19 and influenza. Table 6 outlined below shows concentrations of pharmaceuticals used for the treatment of COVID-19 and influenza from various geographical regions.
From the data shown in Table 6, it is observed that the concentrations obtained from South Africa, within the present study, were substantially high. The concentrations obtained from this study were also significantly higher than other South African studies that investigated the same analytes prior to the occurrence of the COVID-19 pandemic.19,20 This indicated increased usage of this medication during the pandemic. Concentrations obtained for sulfamethoxazole from Pennsylvania were the lowest obtained for the pharmaceutical. This could be due to the wastewater treatment plant sampled for this study exclusively treating wastewater and stormwater from the Penn State University Park campus and not a specific catchment where residential, industrial and medicinal activities are occurring. The low concentrations would be due to a smaller population size within the campus. Additionally, samples were taken once a week over the one-year sampling period, and sampling during the winter months (COVID-19 peaks) were not obtained. Literature concentrations obtained for ivermectin were taken from wastewater effluent. The concentrations would therefore be lower than the influent concentrations obtained for this study as the wastewater would have already gone through the treatment process. Furthermore, samples from this study were taken between the months of April 2020 and January 2021, while the use of ivermectin for the treatment of COVID-19 was still under investigation.
4. Conclusion
This study aimed to quantify targeted pharmaceuticals and metabolites present in wastewater influent and to provide a link between pharmaceutical usage, COVID-19 infections, and the change in seasonal weather temperatures. Results obtained show that concentrations of these pharmaceuticals were substantially higher than those observed from literature during the COVID-19 pandemic. The data did however show direct correlation between the consumption of pharmaceuticals and the total number of COVID-19 cases reported within South Africa. Pharmaceuticals prescribed to treat chronic ailments were found to have consistent daily usage, as required with this class of compounds.Author contributions
Nikitha Inarmal – student who carried out the research for her Masters qualification. She did the experimental work, sampling and analysis of data as well as writing up the manuscript. Brenda Moodley – sole supervisor of the student who carried out the research. She obtained the funding and collaboration with the industry partner, conceptualised the idea, provided guidance with carrying out the experimental work and analysis of data and provided feedback on the writing of the manuscript.Conflicts of interest
There are no conflicts to declare.Acknowledgements
We acknowledge Umgeni Water for their financial assistance for this research.References
- C. Y. Chen and K. M. Lin, Health consequences of illegal drug use, Curr. Opin. Psychiatry, 2009, 22, 287–292 CrossRef PubMed.
- D. Löffler and T. A. Ternes, Determination of acidic pharmaceuticals, antibiotics and ivermectin in river sediment using liquid chromatography-tandem mass spectrometry, J. Chromatogr. A, 2003, 1021(1–2), 133–144 CrossRef PubMed.
- K. Li, P. Du, Z. Xu, T. Gao and X. Li, Occurrence of illicit drugs in surface waters in China, Environ. Pollut., 2016, 213, 395–402 CrossRef CAS PubMed.
- K. M. Kanama, A. P. Daso, L. Mpenyana-Monyatsi and M. A. A. Coetzee, Assessment of pharmaceuticals, personal care products, and hormones in wastewater treatment plants receiving inflows from health facilities in North-West Province, South Africa, J. Toxicol., 2018, 2018, 1–16 CrossRef PubMed.
- E. Archer, Interaction of pharmaceutical and personal care products (PPCPs) and endocrine disrupting contaminants (EDCs) with microbial communities in South African wastewater treatment works and environmental waters, PhD thesis, Stellenbosch University, 2018 Search PubMed.
- M. Mastrup, A. I. Schäfer and S. J. Khan, Predicting the fate of the contraceptive pill in wastewater treatment and discharge, Water Sci. Technol., 2005, 52(8), 279–286 CrossRef CAS PubMed.
- M. Ciotti, M. Ciccozzi, A. Terrinoni, W. C. Jiang, C. B. Wang and S. Bernardini, The COVID-19 pandemic, Crit. Rev. Clin. Lab. Sci., 2020, 57(6), 365–388 CrossRef CAS PubMed.
- W. S. Byun, S. W. Heo, G. Jo, J. W. Kim, S. Kim, S. Lee, H. E. Park and J. H. Baek, Is coronavirus disease (COVID-19) seasonal? A critical analysis of empirical and epidemiological studies at global and local scales, Environ. Res., 2021, 196, 1–10 CrossRef PubMed.
- D. O'Flynn, J. Lawler, A. Yusuf, A. Parle-McDermott, D. Harold, T. McCloughlin, L. Holland, F. Regan and B. White, A review of pharmaceutical occurrence and pathways in the aquatic environment in the context of a changing climate and the COVID-19 pandemic, Anal. Methods, 2021, 13, 575–594 RSC.
- SAHPRA, Update on the use of ivermectin in the prevention or treatment of COVID-19. 2021 [Online], Available: https://www.sahpra.org.za/press-releases/update-on-the-use-of-ivermectin-in-the-prevention-or-treatment-of-covid-19/, [Accessed: 11 August 2022].
- SAHPRA, SAHPRA statement on the termination of the “ivermectin controlled compassionate use access programme”. 2022 [Online], Available: https://www.sahpra.org.za/press-releases/sahpra-statement-on-the-termination-of-the-ivermectin-controlled-compassionate-use-access-programme/, [Accessed: 11 August 2022].
- iStock by Getty Images. Online. Available: https://www.istockphoto.com/search/more-like-this/507567722?assettype=image&istockcollection=main%2Cvalue&phrase=kwazulu%20natal%20map%20with%20scale, [Accessed: 30 March 2023].
- E. Archer, B. Petrie, B. Kasprzyk-Hordern and G. M. Wolfaardt, The fate of pharmaceuticals and personal care products (PPCPs), endocrine disrupting contaminants (EDCs), metabolites and illicit drugs in a WWTW and environmental waters, Chemosphere, 2017, 174, 437–446 CrossRef CAS PubMed.
- UNODC, Guidance for the validation of analytical methodology and calibration of equipment used for testing of illicit drugs in seized materials and biological specimens, 2009 Search PubMed.
- Stats SA, Recorded live births, 2016, 2017 [Online], Available: https://www.statssa.gov.za/?p=10524, [Accessed: 2 August 2022].
- World-O-Meter, South Africa, 2022 [Online], Available: https://www.worldometers.info/coronavirus/country/south-africa/, [Accessed: 2 August 2022].
- K. R. Hayden, M. Jones, K. R. Elkin, M. J. Shreve, W. I. Clees, S. Clark, M. L. Mashtare, T. L. Veith, H. A. Elliott, J. E. Watson, J. Silverman, T. L. Richard, A. F. Read and H. E. Preisendanz, Impact of the COVID-19 pandemic on pharmaceuticals in wastewater treated for beneficial reuse: Two case studies in central Pennsylvania, J. Environ. Qual., 2022, 51, 1066–1082 CrossRef CAS PubMed.
- J. F. Tarazona, M. Martinez, M. A. Martinez and A. Anadon, Environmental impact assessment of COVID-19 therapeutic solutions. A prospective analysis, Sci. Total Environ., 2021, 778, 1–9 CrossRef PubMed.
- S. Matongo, G. Birungi, B. Moodley and P. Ndungu, Occurrence of selected pharmaceuticals in water and sediment of Umgeni River, KwaZulu-Natal, South Africa, Environ. Sci. Pollut. Res., 2015, 22(13), 10298–10308 CrossRef CAS PubMed.
- F. O. Agunbiade and B. Moodley, Pharmaceuticals as emerging organic contaminants in Umgeni River water system, KwaZulu-Natal, South Africa, Environ. Monit. Assess., 2014, 186, 7273–7291 CrossRef CAS PubMed.
Footnote |
| † Electronic supplementary information (ESI) available. See DOI: https://doi.org/10.1039/d3ew00059a |
| This journal is © The Royal Society of Chemistry 2023 |


