
 Open Access Article
 This Open Access Article is licensed under a Creative Commons Attribution-Non Commercial 3.0 Unported Licence
Facile production of chitin from shrimp shells using a deep eutectic solvent and acetic acid
Jie Zhangac,
Wen-Rong Xu†
 *a and
Yu-Cang Zhang†*b
*a and
Yu-Cang Zhang†*b
aKey Laboratory of Advanced Materials of Tropical Island Resources of Ministry of Education, Key Laboratory of Solid Waste Resource Utilization and Environmental Protection, School of Science, School of Chemical Engineering and Technology, Hainan University, Haikou 570228, PR China. E-mail: xuwr2016@hainanu.edu.cn
bCollege of Food and Biological Engineering, Jimei University, Xiamen, 361021, China. E-mail: yczhang@jmu.edu.cn
cHainan Health Management College, Haikou, 570228, China
First published on 12th August 2022
Abstract
High purity chitin was extracted from shrimp shells by a green, sustainable, and efficient one-pot approach using a deep eutectic solvent consisting of choline chloride and glycerol (ChCl–Gl) combined with a small amount of acetic acid. Under the conditions of an acetic acid concentration of 7.5 wt% and reaction temperature of 120 °C, the purity of isolated chitin was up to 96.1%, which was superior to that of 87.7% obtained by conventional chemical method. In addition, the viscosity-average molecular weight and crystallinity of the extracted chitin were revealed to be larger than for the latter. Moreover, the deep eutectic solvent could be recycled at least three times without losing the quality of the extracted chitin. This facile approach combining recyclable DES with a small amount of acetic acid was expected to be used for the green and sustainable production of chitin from shrimp shells.
1 Introduction
Chitin, a linear polysaccharide composed of β-1,4-N-acetyl-D-glucosamine units, is the second most abundant polymer in nature after cellulose.1,2 It is widely found in the shells of arthropods (e.g., crustaceans), the cuticles of insects, the envelopes of some mushrooms, and the cell walls of many fungi.3,4 Chitin and its derivative chitosan are nontoxic and display outstanding biodegradability, biocompatibility, sustainability, and biorenewability.5–7 Owing to these desirable characteristics, chitin has recently attracted substantial research attention and has been widely used in numerous application areas, including food, medicine, agriculture, and other related fields.8–10 In particular, chitin has been processed into a number of organo-nitrogen containing chemicals.11,12Every year, approximately 6–8 million tons of crustacean shell waste are discarded by the seafood industry, thus simultaneously wasting resources and polluting the environment.13 In fact, the shells of crustaceans are mainly composed of chitin, proteins, and mineral salts,14 so these wastes can serve as a cheap source of chitin. The extraction of chitin is traditionally carried out by two different methods, namely, biological separation and chemical separation, both of which involve two major steps of demineralization and deproteinization.15,16 Although the biological method has several advantages over the chemical approach in terms of environmental friendliness and sustainability, the latter is still widely applied for the commercial-scale production of chitin due to its high efficiency and low cost. However, the traditional chemical method involves the use of strong acid and alkali to remove the minerals and proteins, respectively, and these processes generate large amounts of corrosive wastewater, causing serious environmental problems.17,18
With the increasing concern for environmental issues, the concept of “green chemistry” is gaining wider attention. Many new methods have been developed for the extraction of chitin, such as enzyme-catalyzed extraction and ionic liquid (IL) extraction.19–21 Compared with chemically extracted chitin, the enzyme-catalyzed extraction tends to afford chitin with higher molecular weight and crystallinity, and is non-flammable, but does not adequately remove minerals and proteins from the crustacean shells. Moreover, their widespread adoption is hampered by the high cost of some enzymes.22 As a more sustainable alternative to volatile organic solvents, ILs are considered promising solvents for chitin production with several advantages, including low vapor pressure, non-flammability, and excellent dissolving ability.23–25 Nevertheless, ILs also present some disadvantages such as high cost, high toxicity, and lack of biodegradability, which significantly limit their various applications.26,27
Deep eutectic solvents (DESs), a good alternative to ILs, are eutectic mixtures for which the eutectic point temperature is below that of an ideal liquid mixture.28 They are commonly formed by mixing a halide salt of a quaternary ammonium or a phosphonium cation that acts as a hydrogen bond acceptor (HBA), along with a hydrogen bond donor (HBD), such as polyols, urea, carboxylic acids and metal salts.7,29 They have several advantages over conventional organic solvents, such as biodegradability, low toxicity, good availability, high dissolving ability, low melting point, and tunability.30–32 Therefore, DESs are considered green solvents and have been widely employed in organic synthesis, separation, catalysis, biomass processing, and carbon dioxide absorption. As reported, DESs have been applied to the extraction of lignocellulosic biomass and various polysaccharides, including lignin and cellulose.33–35 In particular, the extraction of chitin has also been described.36–39 However, most high-efficiency extraction DESs contain acids such as malonic acid, malic acid, and citric acid as a hydrogen bond donor with a high acid concentration of not less than 50% molar ratio, which leads to high demands on the equipment.
In the current work, we present a green and sustainable method for the production of high-purity chitin from shrimp shells based on a one-pot method for the removal of proteins and minerals using a DES consisting of choline chloride–glycerol (1![[thin space (1/6-em)]](https://www.rsc.org/images/entities/char_2009.gif) :2) and small amounts of acetic acid (CGA) at moderate temperatures. The chemical composition and viscosity-average molecular weight of the obtained chitin samples were determined. In addition, the physicochemical structure of the isolated chitin was analyzed by Fourier transform infrared (FTIR) spectroscopy, X-ray diffraction (XRD), solid-state nuclear magnetic resonance (SS-NMR) spectroscopy, scanning electron microscopy (SEM), and thermogravimetric analysis (TGA).
:2) and small amounts of acetic acid (CGA) at moderate temperatures. The chemical composition and viscosity-average molecular weight of the obtained chitin samples were determined. In addition, the physicochemical structure of the isolated chitin was analyzed by Fourier transform infrared (FTIR) spectroscopy, X-ray diffraction (XRD), solid-state nuclear magnetic resonance (SS-NMR) spectroscopy, scanning electron microscopy (SEM), and thermogravimetric analysis (TGA).
2 Materials and methods
2.1 Materials
Shrimp shells were collected from a seafood processing factory and washed thoroughly with tap water to remove residual shrimp meat, then dried in a vacuum oven at 60 °C for 24 h. The dried material was crushed in a pulverizer and subsequently ball-milled to produce shrimp shell powder.40 Choline chloride (ChCl) and glycerol (Gl) were purchased from Shanghai Macklin Biochemical Co., Ltd Acetic acid and ethanol were procured from Xilong Chemical Co., Ltd Dimethylacetamide (DMAc), lithium chloride (LiCl) and sodium hypochlorite (NaClO) solution were obtained from Aladdin Co., Ltd The remaining reagents were analytical-grade and used without additional purification.2.2 Synthesis of DES
ChCl and Gl were mixed in a 1:2 molar ratio and heated in an oil bath with continuous magnetic stirring at 90 °C for 0.5 h to produce a transparent and homogeneous DES.
2.3 Chitin extraction
The ball-milled shrimp shell powder (BMS, 5.0 g) was added to the prepared DES (ChCl–Gl, 145.0 g) and the mixture was stirred magnetically at 100 °C for 3 h. Various concentrations of acetic acid were then added, and the mixtures were further stirred for 1 h at defined temperatures, as presented in Table 1. After the reaction mixture was cooled, distilled water was added and the suspension was filtered through a Büchner funnel. The residue was washed with distilled water until the filtrate was neutral. The residue obtained was then decolorized by treatment with 0.5 wt% NaClO solution at room temperature for 0.5 h, and then washed with distilled water and dried at 60 °C for 24 h to obtain the chitin product. All experiments were performed in triplicate.| Sample code | Temperature (°C) | Acetic acid concentration (%) | Number of DES cycles | Chitin yield (%) | |
|---|---|---|---|---|---|
| Before decolorization | After decolorization | ||||
| CGA1 | 80 | 7.5 | 0 | 32.7 ± 1.1 | 25.8 ± 1.4 |
| CGA2 | 100 | 7.5 | 0 | 29.8 ± 1.0 | 25.8 ± 0.4 |
| CGA3 | 120 | 7.5 | 0 | 27.4 ± 1.1 | 21.4 ± 1.2 |
| CGA4 | 140 | 7.5 | 0 | 25.3 ± 0.6 | 21.5 ± 0.7 |
| CGA5 | 120 | 2.5 | 0 | 33.8 ± 1.0 | 28.5 ± 0.9 |
| CGA6 | 120 | 5.0 | 0 | 28.9 ± 0.5 | 24.3 ± 1.1 |
| CGA7 | 120 | 10.0 | 0 | 27.8 ± 1.0 | 21.0 ± 1.6 |
| RD1 | 120 | 7.5 | 1 | 27.1 ± 1.1 | 21.2 ± 1.1 |
| RD2 | 120 | 7.5 | 2 | 26.9 ± 1.0 | 21.3 ± 1.4 |
| RD3 | 120 | 7.5 | 3 | 26.2 ± 0.9 | 20.2 ± 0.8 |
For comparison with the samples prepared using the DES and acetic acid, chitin was also extracted from shrimp shells via the traditional chemical treatment. Briefly, BMS (5.0 g) was demineralized by treatment with a 6 wt% HCl solution (50 mL) at room temperature for 2.5 h. The resulting solid fraction was centrifuged with distilled water to neutrality. The deproteinization was then accomplished by alkaline treatment with a 10 wt% NaOH solution (50 mL) at 90 °C for 3 h, followed by centrifugation with distilled water until the pH was neutral. Finally, the sample was decolorized by a 0.5 wt% NaClO solution at room temperature for 0.5 h. The distilled water-washed residue was dried in an oven at 60 °C to afford the purified chitin product (namely AA, obtained by acid-alkaline treatment).
2.4 Recovery of the DES
After the reaction, the used DES was recovered by the following steps: first, the water in the filtrate was removed on a rotary evaporator to afford the liquid fraction. Then ethanol was added to precipitate organic mineral salts, which were removed by suction filtration to give the filtrate. The ethanol in the filtrate was then removed on a rotary evaporator to recover the DES. The recovered DES was reused for chitin extraction to evaluate its reusability. The samples named RD1, RD2 and RD3 represent chitin extracted with DES obtained from the first, second and third recoveries, respectively.2.5 Chemical composition analysis
Shrimp shells are mainly composed of chitin, protein, ash, water, and negligible lipids. In this paper, only the contents of chitin, protein, ash, and water were considered, and the quantitative methods for non-chitin substances are described below. After removing the non-chitin, the remaining weight was accounted as chitin.41The water content of the chitin sample was determined by drying the sample at 105 °C for 24 h and immediately transferring the sample to a desiccator for 30 min and allowing the sample to cool to ambient temperature. The weight loss rate before and after drying was considered as the water content of the sample.
The ash content was determined by the weighing method.42 The moisture-free sample was placed in a muffle furnace at 600 °C for 240 min and then immediately transferred to a desiccator for 30 min to cool to ambient temperature. The ash content was calculated from the percentage of ash residue to the initial weight of the sample.
The residual protein content was measured by the Bradford method.43 The chitin sample (0.05 g) was treated with a 5 wt% NaOH solution (10 mL) and the resulting mixture was heated at 95 °C for 150 min under stirring to extract the soluble proteins. The protein content was determined by measuring the absorbance at 595 nm.44
2.6 Characterization
The viscosity-average molecular weight (Mv) of the chitin was determined by dissolving 0.3 mg of sample in 1 mL of 5 wt% LiCl in DMAc. The intrinsic viscosity [η] of the solution was measured on a microviscometer (RheoSense, USA) at 25 °C. The obtained viscosity was applied to the Mark–Houwink–Sakurada eqn (1) to calculate the Mv.| [η] = KMva | (1) |
Solid-state 13C NMR spectra were acquired on an AVANCE III 600 M spectrometer (Bruker, Germany). The typical conditions were as follows: 4.0 μs pulse, 50 ms acquisition time, 0.5 ms contact time, 5 kHz magic angle spinning rate, 2 s recycle delay and 2048 scans.
The functional groups in the chitin samples were characterized by FTIR spectroscopy and the surface morphology was examined by SEM. The SEM observations were recorded on a Phenom ProX system (Holland) operating at 10 kV. The chitin samples were coated with gold prior to the SEM observations. The FTIR spectra were recorded on a Nicolet IS10 spectrometer (Thermo Fisher Scientific, USA) with the KBr tablet method. The acetylation degree (AD) of chitin samples was calculated by FTIR spectra45 following eqn (2), where Ai is the area of the peak at wavenumber i.
| AD (%) = A1655/A3450 × 115% | (2) |
The XRD patterns were recorded on a Bruker D8 Advance X-ray diffractometer (Germany) at 40 kV. The measurements were carried out in the 2θ range from 5° to 55° at a scanning rate of 4° per min. The crystallinity index (CrI) was calculated using the Segal formula expressed in eqn (3), where I110 and Iam are the maximum intensity at 2θ ≈ 19.2° and the intensity of amorphous diffraction at 2θ ≈ 16°, respectively.
| CrI (%) = [(I110 − Iam)/I110] × 100% | (3) |
The thermal decomposition behavior of the chitin samples was examined on a TGA system (NETZSCH STA 449F3) over the temperature range of 40 °C to 800 °C at a heating rate of 10 °C min−1 under a nitrogen flow.
3 Results and discussion
3.1 Influence of reaction conditions on chitin extraction yield and properties
The effects of reaction conditions including temperature, catalyst concentration, and DES cycle number on the yield and properties of the extracted chitin were investigated. It can be seen from Table 1 that the chitin yield before decolorization decreased with increasing temperature. At reaction temperatures of 80 °C (CGA1) and 100 °C (CGA2), the chitin yields were 32.7% and 29.8%, respectively. When the reaction temperature was increased to 120 °C (CGA3) or 140 °C (CGA4), the yields decreased to 27.4% and 25.3%, respectively. This was ascribed to the elimination of more protein and calcium carbonate content, as well as the hydrolysis of chitin at higher temperatures. After decolorization, the yields were diminished to 25.8%, 25.8%, 21.4%, and 21.5%, respectively, due to the removal of pigments and partial chitin loss during the bleaching process. In addition, the chitin yields after decolorization decreased with increasing the acetic acid concentration. When the acetic acid concentration raised from 2.5 wt% (CGA5) to 10.0 wt% (CGA7), the chitin yields decreased gradually from 28.5% to 21.0%. These yield changes were ascribed to the acidic hydrolysis of residual protein and the decomposition of calcium carbonate. Furthermore, the influence of the number of DES cycles on the chitin yield before and after decolorization was also evaluated, as summarized in Table 1. The DES could be reused three times without a notable decrease in the chitin yield. After three cycles, the DES became more viscous, which might be related to the accumulation of proteins.37The changes of acetylation degree (AD) and the Mv of the chitin extracted at different acetic acid concentrations were investigated and compared with the data of chitin AA extracted by the conventional acid-alkaline method. As shown in Fig. 1, the AD remained essentially stable above 80% as the acid concentration varied, and similar results were observed for the AA and RD3 samples. As expected, acid treatment plays an important role in the depolymerization of chitin. The Mv of the extracted chitin gradually decreased from 270 to 190 kDa upon increasing the acetic acid concentration from 2.5 wt% (CGA5) to 10.0 wt% (CGA7), demonstrating that CGA7 was depolymerized to a lower molecular weight. In particular, when the acetic acid concentration was 7.5 wt% (CGA3), the Mv was measured to be 228 kDa, which was slightly higher than the value of 218 kDa for chitin (AA) obtained by the conventional chemical treatment and significantly higher than the previously reported Mv of 74 kDa for chitin gained by treatment with 2 wt% hydrochloride acid.41 Therefore, the current system involving ChCl–Gl and acetic acid could effectively reduce chitin degradation, while also allowing efficient demineralization and deproteinization.
 | ||
| Fig. 1 The molecular weight and acetylation degree of chitin obtained under different reaction conditions (AA, obtained by acid-alkaline treatment). | ||
3.2 Chemical composition analysis of the extracted chitin
As shown in Table 2, the BMS contained 5.4% water, 43.8% ash, 13.9% protein, and 36.9% chitin. First, the influence of reaction temperature on the chemical composition was evaluated. At reaction temperatures of 80 °C (CGA1) and 100 °C (CGA2), the protein content was 3.1% and 2.1%, respectively. When the reaction temperature was increased to 120 °C (CGA3), the protein content decreased to 1.1%. Further increasing the temperature to 140 °C resulted in essentially no change in protein content. Therefore, taking into account the deproteinization effect and energy consumption, the optimal reaction temperature was selected as 120 °C.| Samples | Water (%) | Ash (%) | Protein (%) | Chitin purity (%) |
|---|---|---|---|---|
| BMS | 5.4 ± 0.5 | 43.8 ± 1.4 | 13.9 ± 0.9 | 36.9 ± 1.9 |
| AA | 7.4 ± 0.2 | 2.2 ± 0.1 | 2.6 ± 0.1 | 87.7 ± 0.3 |
| CGA1 | 3.0 ± 0.2 | 0.6 ± 0.1 | 3.1 ± 0.1 | 93.3 ± 0.3 |
| CGA2 | 2.6 ± 0.1 | 0.5 ± 0.1 | 2.1 ± 0.1 | 94.7 ± 0.2 |
| CGA3 | 2.3 ± 0.2 | 0.4 ± 0.1 | 1.1 ± 0.1 | 96.1 ± 0.2 |
| CGA4 | 2.6 ± 0.1 | 0.4 ± 0.1 | 1.1 ± 0.1 | 95.9 ± 0.2 |
| CGA5 | 2.9 ± 0.2 | 6.3 ± 0.1 | 2.5 ± 0.1 | 88.3 ± 0.4 |
| CGA6 | 3.0 ± 0.3 | 2.3 ± 0.1 | 2.2 ± 0.1 | 92.4 ± 0.4 |
| CGA7 | 2.8 ± 0.3 | 0.3 ± 0.1 | 1.1 ± 0.1 | 95.8 ± 0.2 |
| RD1 | 3.1 ± 0.3 | 0.8 ± 0.1 | 1.4 ± 0.2 | 94.8 ± 0.4 |
| RD2 | 3.1 ± 0.3 | 0.8 ± 0.1 | 1.4 ± 0.2 | 94.7 ± 0.4 |
| RD3 | 3.1 ± 0.2 | 0.8 ± 0.1 | 1.4 ± 0.2 | 94.7 ± 0.1 |
The effects of different acetic acid concentrations of 2.5%, 5.0%, 7.5% and 10.0% on the chemical composition of the corresponding obtained chitin samples CGA5, CGA6, CGA3 and CGA7 were investigated. After CGA treatment with 2.5 wt% acetic acid (CGA5), the ash and protein contents of the extracted chitin were 6.3% and 2.5%, respectively. Upon increasing the acetic acid concentration to 7.5 wt% (CGA3), the ash and protein contents decreased to 0.4% and 1.1%, reductions of 82% and 58%, respectively, compared to the traditional chemical treatment (AA). Moreover, this sample displayed the highest purity (96%) among the conditions examined. When the acetic acid concentration was further increased to 10.0 wt% (CGA7), the ash and protein contents remained essentially unchanged. It should be noted that one gram of BMS contains approximately 0.4 g of CaCO3 and is expected to consume 0.6 g of acetic acid. An acetic acid concentration of 2.5 wt% corresponds to about 0.8 g of acetic acid per gram of BMS, which is just sufficient to remove the calcium carbonate from the BMS. This indicated that the acetic acid and DES not only played a role in demineralization but also assisted in deproteinization.44 The acetic acid concentration of 7.5% could provide chitin with good demineralization and deproteinization, and the remaining concentrations tended to depolymerize chitin rapidly at high temperatures. Moreover, the DES maintained excellent chitin extraction performance even after three recoveries (RD3). Thus, the combined application of acetic acid and the DES was found to be an effective method for the isolation of high-purity chitin from shrimp shells.
3.3 Structural characterization of the extracted chitin
Recently, SS-NMR spectroscopy has been employed in numerous studies to measure the purity of chitin.46,47 The SS 13C-NMR spectra of BMS and several of the extracted chitin samples (AA, CGA3, and RD3) are presented in Fig. 2. The spectrum of BMS contained all of the characteristic peaks expected for chitin, i.e., 174.3 (C![[double bond, length as m-dash]](https://www.rsc.org/images/entities/char_e001.gif) O of the N-acetyl moiety), 103.6 (C1), 83.1 (C4), 75.7 (C5), 73.5 (C3), 61.1 (C6), 55.1 (C2), and 23.2 ppm (CH3). In addition, peaks corresponding to proteins were observed in the region of 20–40 ppm (indicated by the green shading).48 The absence of these protein-derived signals for CGA3 and RD3 demonstrated that proteins were effectively eliminated from the extracted chitin samples. Moreover, no extra peaks appeared, indicating that the structure of the extracted chitin remained intact. Thus, the extraction processes used to obtain CGA3 and RD3 mediated efficient demineralization and deproteinization and resulted in chitin with high purity.
O of the N-acetyl moiety), 103.6 (C1), 83.1 (C4), 75.7 (C5), 73.5 (C3), 61.1 (C6), 55.1 (C2), and 23.2 ppm (CH3). In addition, peaks corresponding to proteins were observed in the region of 20–40 ppm (indicated by the green shading).48 The absence of these protein-derived signals for CGA3 and RD3 demonstrated that proteins were effectively eliminated from the extracted chitin samples. Moreover, no extra peaks appeared, indicating that the structure of the extracted chitin remained intact. Thus, the extraction processes used to obtain CGA3 and RD3 mediated efficient demineralization and deproteinization and resulted in chitin with high purity.
 | ||
| Fig. 2 Solid-state 13C NMR spectra of BMS, AA, CGA3, and RD3. | ||
The chemical structures of BMS and the extracted chitin samples were investigated by FTIR spectroscopy, as shown in Fig. 3. In the spectra of the extracted chitin samples, the broad bands at 3450 and 3266 cm−1 were ascribed to O–H and N–H stretching. The bands at 1655 and 1624 cm−1 were assigned to the amide I band (two types of hydrogen bonds in a CO group with the NH group of the adjacent chain and the OH group of the inter-chain).49 Finally, the intense peak at 1550 cm−1 arising from the N–H in-plane bending and C–N stretching modes corresponded to the amide II band. In contrast, the spectrum of BMS was significantly different from those of the extracted chitin samples. In the spectrum of BMS, the bands were not split due to the overlap of the amide peaks of protein with the amide I and amide II bands of chitin. Furthermore, the spectra of CGA3 and RD3 were similar to that of AA. These results confirmed that the extraction processes virtually removed proteins from the shrimp shells to afford chitin CGA3 and RD3 with high purity, which was in accordance with the SS 13C-NMR results.
 | ||
| Fig. 3 FTIR spectra of BMS, AA, CGA3, and RD3. | ||
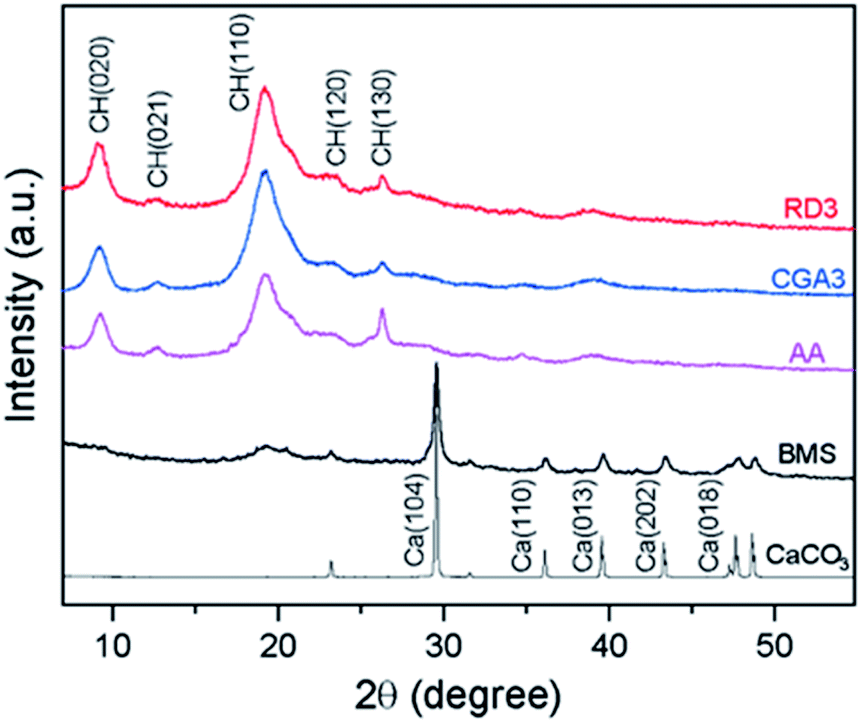
The extracted chitin samples (AA, CGA3, and RD3), BMS, and CaCO3 were also analyzed by XRD to determine their crystal structures and relative crystallinities. As presented in Fig. 4, the extracted chitin samples exhibited typical diffraction peaks at 2θ = 9.2° (020), 12.9° (021), 19.3° (110), 23.5° (120), and 26.3° (130), corresponding to the crystal lattice of chitin.50 The additional peaks observed in CaCO3 and BMS were not detected, suggesting that the extracted chitin samples were essentially pure at the XRD limit, confirming the efficient demineralization.
 | ||
| Fig. 4 XRD patterns of CaCO3, BMS, AA, CGA3, and RD3. | ||
In addition, the XRD patterns of CGA3 and RD3 were in good agreement with that of AA, further indicating that the former samples were free from minerals. Moreover, the crystallinity index of the chitin samples was calculated according to the Segal method.51 It turned out that the CrI value of BMS was 38.2%, while the CrI values of the extracted chitin samples increased to 75.1% for AA, 84.3% for CGA3, and 74.0% for RD3. The increases in CrI values confirmed that the CGA treatment resulted in the removal of minerals and proteins from BMS.
3.4 Surface morphology of the extracted chitin
The BMS and extracted chitin samples were analyzed by SEM to examine their surface morphologies. It is shown in Fig. 5 that the surface morphology of the extracted chitin samples differed significantly from BMS. The SEM image of BMS revealed a rough surface without pores due to the presence of minerals and proteins (Fig. 5a). In contrast, the extracted chitin samples occupied smooth surfaces with pores caused by the elimination of the minerals and proteins (Fig. 5b–d). Moreover, CGA3 and RD3 exhibited larger pore sizes on the surface compared to AA, which might be attributed to the penetration and swelling of chitin induced by the thermomechanical force of DES at 120 °C, making it easier for acetic acid to enter the interior of chitin.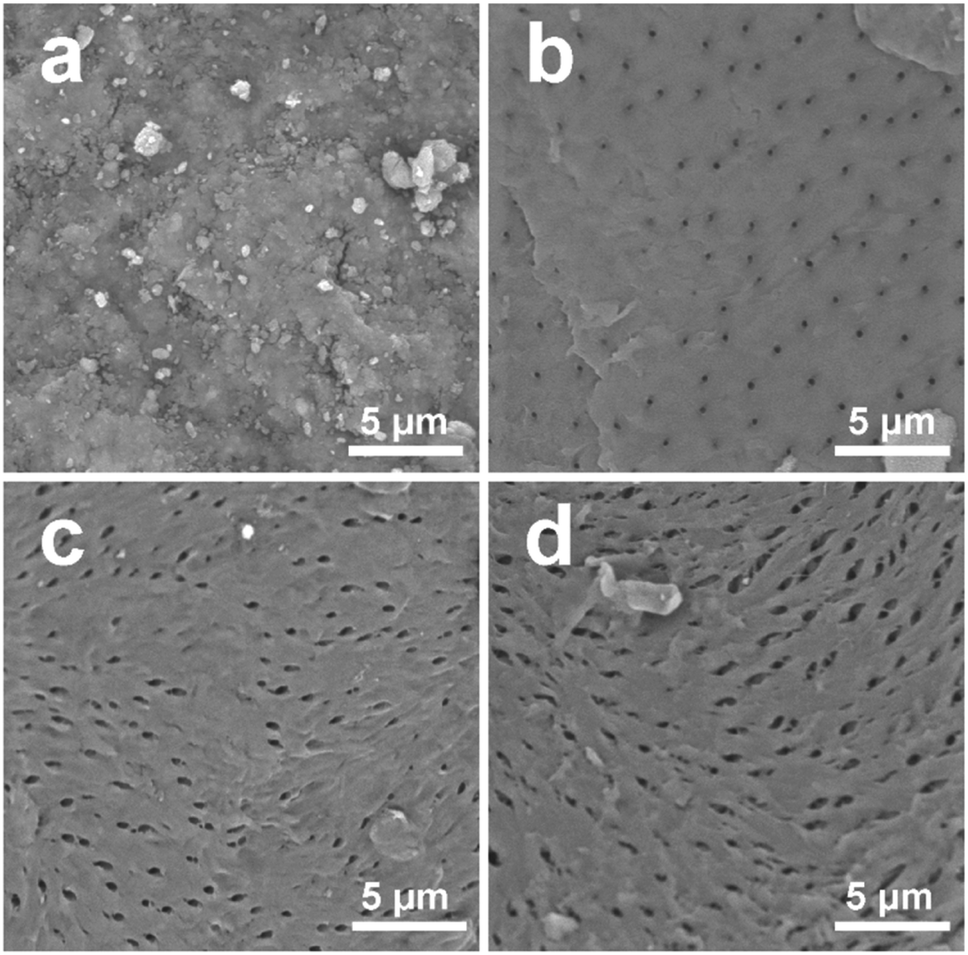 | ||
| Fig. 5 SEM images of (a) BMS, (b) AA, (c) CGA3, and (d) RD3 at 13.00 kx magnification. | ||
3.5 Thermal properties of the extracted chitin
The thermal stabilities of the BMS and extracted chitin samples were investigated by TG and DTG analysis. According to Fig. 6, the TGA plot for BMS illustrated three stages of thermal degradation in the range of 80–750 °C. The first stage was primarily caused by the evaporation of water at temperatures below 180 °C. The second stage was ascribed to the gradual degradation of the chitin polysaccharide structure at 180–600 °C. The final stage at 600–750 °C was assigned to the decomposition of calcium carbonate into calcium oxide and carbon dioxide. Similar degradation behavior was also observed from the dried shrimp shells in work reported by Tian and colleagues.53 In the case of extracted chitin samples, the weight loss at 600–750 °C was approximately negligible, indicating that the calcium carbonate had been almost completely removed, which was in line with the XRD results. In addition, the DTG data revealed that the maximum weight loss rate temperature (Tmax) and the statistic heat-resistant index temperature (Ts) of CGA3 (374.6 °C, 150.7 °C) were both higher than those of the AA (371.0 °C, 108.8 °C) (Table 3). The better thermostability of CGA3 than AA should be contributed to its higher molecular weight. Even after recycling of the DES three times, the Tmax and Ts of RD3 were still maintained at acceptable levels of 365.4 °C and 138.5 °C, respectively.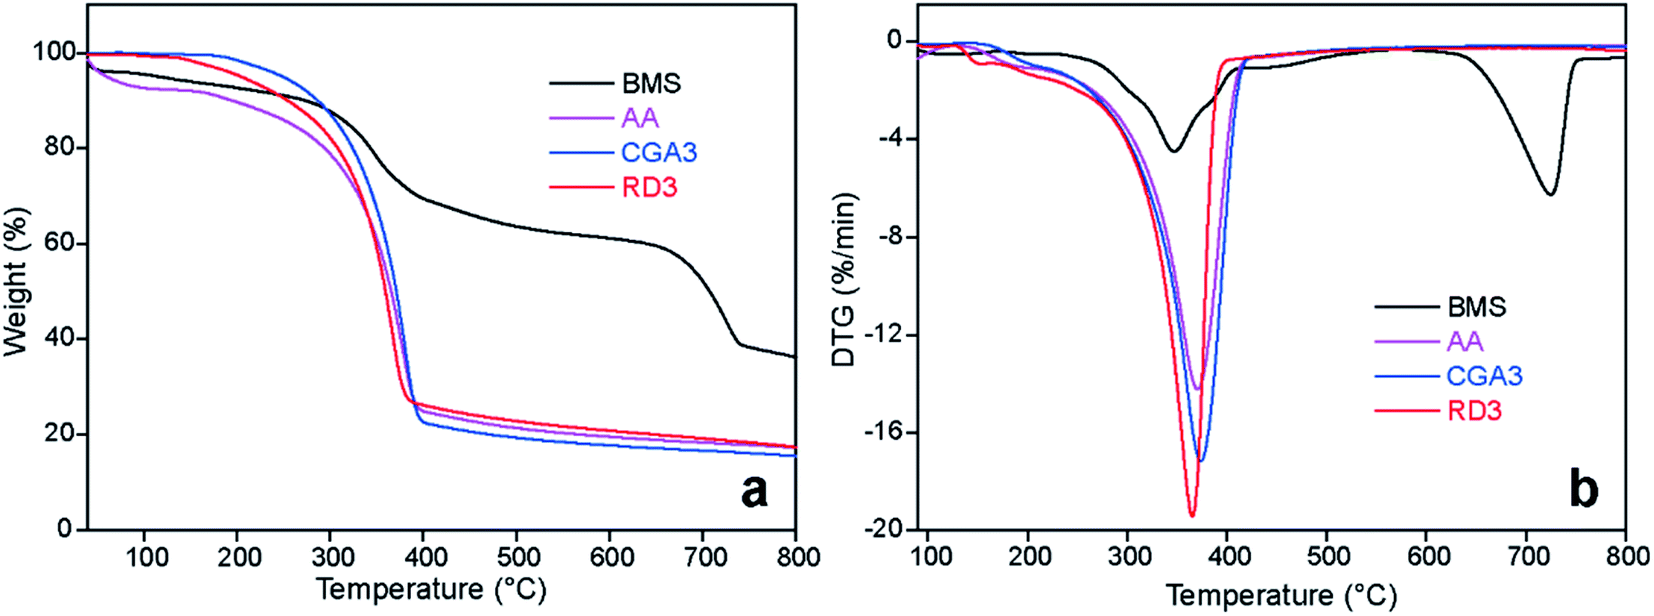 | ||
| Fig. 6 (a) TGA and (b) DTG curves of BMS, AA, CGA3, and RD3. | ||
| Codes | Td5 (°C) | Td30 (°C) | Ts (°C) | Tmax (°C) | Char800 (%) |
|---|---|---|---|---|---|
| a The temperature corresponding to the weight loss of 5% (Td5), 30% (Td30), the maximum weight loss rate (Tmax) was acquired from TGA curves, and the statistic heat-resistant index temperature (Ts) was calculated by the following equation:52 Ts = 0.49 (Td5 + 0.6 (Td30 − Td5)). | |||||
| BMS | 116.6 | 390.7 | 137.7 | 347.5/725.6 | 36.4 |
| AA | 58.7 | 330.8 | 108.8 | 371.0 | 17.3 |
| CGA3 | 251.6 | 344.7 | 150.7 | 374.6 | 15.5 |
| RD3 | 205.7 | 334.1 | 138.5 | 365.4 | 17.3 |
4 Conclusions
A sustainable, efficient, and green approach for extracting chitin from shrimp shells has been developed using choline chloride–glycerol (ChCl–Gl) DES and a small amount of acetic acid in one-pot method. When acetic acid concentration was 7.5 wt% and reaction temperature was 120 °C, the chitin was obtained with an optimized yield of 21.4% and purity of 96.1%. The viscosity-average molecular weight of corresponding chitin was 228 kDa, which was higher than the Mv of 218 kDa for conventionally processed chitin, leading to better thermal stability of the former, as revealed by the TGA results. The chemical composition analysis, solid-state 13C-NMR, FTIR, XRD, and SEM results demonstrated that the chitin samples obtained by the proposed method were of high purity. Furthermore, the DES could be effectively reused for at least three cycles. Overall, the developed one-pot method based on an environmentally friendly DES solvent and a small amount of acetic acid had great potential for the green and fine production of chitin.Author contributions
Jie Zhang: methodology, investigation, data analysis, writing-original draft, verification; Wen-Rong Xu: methodology, supervision, resources, review & editing, funding acquisition; Yu-Cang Zhang: supervision, funding acquisition.Conflicts of interest
The authors have no conflict of interest to declare.Acknowledgements
We acknowledge the financial supports from the Key Scientific Research Project Funding of Hainan Province (No. ZDYF2020184), the National Natural Science Foundation of China (No. 21978059, No. 22061015), and the Health Institute Research Foundation (2019ZR03).References
- P. S. Barber, C. S. Griggs, J. R. Bonner and R. D. Rogers, Green Chem., 2013, 15, 601–607 RSC.
- Y. Wang, A. Zhang, X. Mo, N. Zhou, S. Yang, K. Chen and P. Ouyang, Process Biochem., 2020, 99, 265–269 CrossRef CAS.
- Y. Pierson, X. Chen, F. D. Bobbink, J. Zhang and N. Yan, ACS Sustainable Chem. Eng., 2014, 2, 2081–2089 CrossRef CAS.
- H. Yang, G. Gözaydın, R. R. Nasaruddin, J. R. G. Har, X. Chen, X. Wang and N. Yan, ACS Sustainable Chem. Eng., 2019, 7, 5532–5542 CrossRef CAS.
- N. E. Mushi, T. Nishino, L. A. Berglund and Q. Zhou, ACS Sustainable Chem. Eng., 2019, 7, 1692–1697 CrossRef CAS.
- Y. Fang, R. Zhang, B. Duan, M. Liu, A. Lu and L. Zhang, ACS Sustainable Chem. Eng., 2017, 5, 2725–2733 CrossRef CAS.
- N. Zel and M. Elibol, Carbohydr. Polym., 2021, 262, 117942 CrossRef.
- C. He, M. Ke, Z. Zhong, Q. Ye, L. He, Y. Chen and J. Zhou, ACS Appl. Bio Mater., 2021, 4, 1833–1842 CrossRef CAS.
- J. Zhang, W. Xu, Y. Zhang, X. Han, C. Chen and A. Chen, Carbohydr. Polym., 2020, 238, 116182 CrossRef CAS PubMed.
- C. Chen, D. Li, H. Yano and K. Abe, J. Agric. Food Chem., 2019, 67, 5571–5578 CrossRef CAS PubMed.
- G. Gözaydın, S. Song and N. Yan, Green Chem., 2020, 22, 5096–5104 RSC.
- X. Chen, S. Song, H. Li, G. Gözaydın and N. Yan, Acc. Chem. Res., 2021, 54, 1711–1722 CrossRef CAS PubMed.
- R. Devi and R. Dhamodharan, ACS Sustainable Chem. Eng., 2018, 6, 846–853 CrossRef CAS.
- N. Yan and X. Chen, Nature, 2015, 524, 155–157 CrossRef CAS PubMed.
- K. Shimahara and Y. Takiguchi, Methods Enzymol., 1988, 161, 417–423 CAS.
- Z. Ping, Z. Gu, H. Shu and H. Lian, Carbohydr. Polym., 2017, 177, 217–223 CrossRef PubMed.
- X. Mao, N. Guo, J. Sun and C. Xue, J. Cleaner Prod., 2017, 143, 814–823 CrossRef CAS.
- H. Zhang, Y. Jin, Y. Deng, D. Wang and Y. Zhao, Carbohydr. Res., 2012, 362, 13–20 CrossRef CAS PubMed.
- A. Zhang, C. Wang, J. Chen, G. Wei, N. Zhou, G. Li, K. Chen and P. Ouyang, Green Chem., 2021, 23, 3081–3089 RSC.
- J. L. Shamshina, Green Chem., 2019, 21, 3974–3993 RSC.
- H. B. Wineinger, J. L. Shamshina, A. Kelly, C. King and R. D. Rogers, Green Chem., 2020, 22, 3734–3741 RSC.
- L. Yu, X. Xu, C. Xue, Y. Chang, L. Ge, Y. Wang, C. Zhang, G. Liu and C. He, Food Chem., 2013, 139, 702–709 CrossRef CAS PubMed.
- K. Ding, H. Lu, Y. Zhang, M. L. Snedaker, D. Liu, J. A. Maciá-Agulló and G. D. Stucky, J. Am. Chem. Soc., 2014, 136, 15465–15468 CrossRef CAS PubMed.
- P. Kuo, C. Tsao, C. Hsu, S. Chen and H. Hsu, J. Membr. Sci., 2016, 499, 462–469 CrossRef CAS.
- A. B. Pereiro, J. M. M. Araújo, S. Martinho, F. Alves, S. Nunes, A. Matias, C. M. M. Duarte, L. P. N. Rebelo and I. M. Marrucho, ACS Sustainable Chem. Eng., 2013, 1, 427–439 CrossRef CAS.
- L. D. Tolesa, B. S. Gupta and M.-J. Lee, Int. J. Biol. Macromol., 2019, 130, 818–826 CrossRef CAS PubMed.
- T. Setoguchi, T. Kato, K. Yamamoto and J.-i. Kadokawa, Int. J. Biol. Macromol., 2012, 50, 861–864 CrossRef CAS PubMed.
- M. A. R. Martins, S. P. Pinho and J. A. P. Coutinho, J. Solution Chem., 2019, 48, 962–982 CrossRef CAS.
- A. P. Abbott, D. Boothby, G. Capper, D. L. Davies and R. K. Rasheed, J. Am. Chem. Soc., 2004, 126, 9142–9147 CrossRef CAS.
- A. A. N. Gunny, D. Arbain, E. M. Nashef and P. Jamal, Bioresour. Technol., 2015, 181, 297–302 CrossRef CAS PubMed.
- G. Yan, Y. Zhou, L. Zhao, W. Wang, Y. Yang, X. Zhao, Y. Chen and X. Yao, Ind. Crops Prod., 2022, 183, 115005 CrossRef CAS.
- M. Zdanowicz, K. Wilpiszewska and T. Spychaj, Carbohydr. Polym., 2018, 200, 361–380 CrossRef CAS PubMed.
- H. Huang, Q. Tang, G. Lin, C. Yu, H. Wang and Z. Li, Ind. Crops Prod., 2021, 171, 113879 CrossRef CAS.
- X. Shen, T. Chen, H. Wang, Q. Mei, F. Yue, S. Sun, J. Wen, T. Yuan and R. Sun, ACS Sustainable Chem. Eng., 2020, 8, 2130–2137 CrossRef CAS.
- X. Wu, P. Liu, Q. Liu, S. Xu, Y. Zhang, W. Xu and G. Liu, RSC Adv., 2021, 11, 14071–14078 RSC.
- P. Zhu, Z. Gu, S. Hong and H. Lian, Carbohydr. Polym., 2017, 177, 217–223 CrossRef CAS PubMed.
- W. Huang, D. Zhao, N. Guo, C. Xue and X. Mao, J. Agric. Food Chem., 2018, 66, 11897–11901 CrossRef CAS.
- B. Bradić, U. Novak and B. Likozar, Green Process. Synth., 2020, 9, 13–25 Search PubMed.
- X. Sun, Q. Wei, Y. Yang, Z. Xiao and X. Ren, J. Environ. Chem. Eng., 2022, 10, 106859 CrossRef CAS.
- J. Zhang, W. Xu, Y. Zhang, W. Li, J. Hu, F. Zheng and Y. Wu, Carbohydr. Polym., 2018, 180, 175–181 CrossRef CAS.
- J. Zhang, M. Feng, X. Lu, C. Shi, X. Li, J. Xin, G. Yue and S. Zhang, Carbohydr. Polym., 2018, 190, 148–155 CrossRef CAS.
- W. Sajomsang and P. Gonil, Mater. Sci. Eng. C, 2010, 30, 357–363 CrossRef CAS.
- M. M. Bradford, Anal. Biochem., 1976, 72, 248–254 CrossRef CAS PubMed.
- S. Hong, Q. Yang, Y. Yuan, L. Chen, Y. Song and H. Lian, Carbohydr. Polym., 2019, 205, 236–243 CrossRef CAS PubMed.
- A. Baxter, M. Dillon, K. D. Anthony Taylor and G. A. F. Roberts, Int. J. Biol. Macromol., 1992, 14, 166–169 CrossRef CAS.
- L. D. Fernando, M. C. Dickwella Widanage, J. Penfield, A. S. Lipton, N. Washton, J.-P. Latgé, P. Wang, L. Zhang and T. Wang, Front. Mol. Biosci., 2021, 8, 727053 CrossRef CAS PubMed.
- C. King, R. S. Stein, J. L. Shamshina and R. D. Rogers, ACS Sustainable Chem. Eng., 2017, 5, 8011–8016 CrossRef.
- C. King, R. S. Stein, J. L. Shamshina and R. D. Rogers, ACS Sustainable Chem. Eng., 2017, 5, 8011–8016 CrossRef CAS.
- J. Liao and H. Huang, Int. J. Biol. Macromol., 2020, 156, 1279–1286 CrossRef CAS PubMed.
- J. D. Goodrich and W. T. Winter, Biomacromolecules, 2007, 8, 252–257 CrossRef CAS PubMed.
- M. Feng, J. Yan, B. He, X. Chen and J. Sun, Int. J. Biol. Macromol., 2021, 193, 347–357 CrossRef CAS.
- P. Kuo, M. Sain and N. Yan, Green Chem., 2014, 16, 3483–3493 RSC.
- W. Tian, Q. Gao, L. Zhang, C. Yang, Z. Li, Y. Tan, W. Qian and H. Zhang, J. Mater. Chem. A, 2016, 4, 8690–8699 RSC.
Footnote |
| † These authors made equal contributions to this work. |
| This journal is © The Royal Society of Chemistry 2022 |