 Open Access Article
Reduced graphene oxide from dead Li-ion batteries with β-Co(OH)2 as a potential electrode for enhanced charge storage capabilities†
Aranganathan
Viswanathan
 * and
Vanchiappan
Aravindan
 *
*
Department of Chemistry, Indian Institute of Science Education and Research (IISER), Tirupati-517507, Andhra Pradesh, India. E-mail: ranguchemist@gmail.com; aravind.van@gmail.com
First published on 13th June 2024
Abstract
Supercapacitive studies were performed on two composites of reduced graphene oxide (rGO)/β-Co(OH)2 of the same weight composition, with the difference among them being the graphite source, one being the graphite recovered from spent Li-ion batteries (GC150) and the other being the pristine graphite (GPGC150). Results show that GC150 exhibits superior energy storage performances compared to GPGC150. However, the rate capability of the GPGC150 was found to be higher than that of GC150. Both the composites exhibited better cyclic stabilities up to 10![[thin space (1/6-em)]](https://www.rsc.org/images/entities/char_2009.gif) 000 cycles at a current density of 10 A g−1. GC150 exhibited zero deterioration while GPGC150 exhibited 9.23% of deterioration. The energy storage parameters, viz., specific capacitance, specific capacity, specific energy, specific power, and coulombic efficiency, exhibited by GC150 at a current density of 1 A g−1 are 36 F g−1, 43 C g−1, 7.16 W h kg−1, 0.77 kW kg−1, and 94.99%, respectively, in a symmetric two-electrode system. The rGO/β-Co(OH)2 composites synthesized using recovered graphite as the source for rGO (GC150) exhibit supercapacitance better than their analog that is synthesized using pristine graphite as the source for rGO by the synthetic route followed in the present study.
000 cycles at a current density of 10 A g−1. GC150 exhibited zero deterioration while GPGC150 exhibited 9.23% of deterioration. The energy storage parameters, viz., specific capacitance, specific capacity, specific energy, specific power, and coulombic efficiency, exhibited by GC150 at a current density of 1 A g−1 are 36 F g−1, 43 C g−1, 7.16 W h kg−1, 0.77 kW kg−1, and 94.99%, respectively, in a symmetric two-electrode system. The rGO/β-Co(OH)2 composites synthesized using recovered graphite as the source for rGO (GC150) exhibit supercapacitance better than their analog that is synthesized using pristine graphite as the source for rGO by the synthetic route followed in the present study.
Sustainability spotlightThe growing world is also accompanied by the growth of waste piles all across the environment; inadvertently, the idea of waste to wealth is being taken up as one of the crucial steps to control these waste piles. These waste piles are of different natures; some are bio-degradable while some are not, and some are toxic to the environment to a greater extent. One such waste pile that is given the least importance in recycling is spent Li-ion batteries (LIBs), which are being piled up globally after their use in various gadgets. Our study focuses on recycling LIBs and using their components again in energy storage devices such as supercapacitors. The main aim was to recover the graphite from spent LIBs, use it as a base material for the synthesis of reduced graphene oxide (rGO), and integrate it with other faradaic materials in facile methods. In this work, one such rGO composited with cobalt hydroxide and its supercapacitive behavior is presented. These results highlight the importance of recycling spent LIBs and are highly relevant to UN SDGs 7 (Affordable and Clean Energy) and 13 (Climate Action). |
1 Introduction
The production, utilization, and disposal of Li-ion batteries (LIBs) are at their maximum level, presently, due to their high energy characteristics. The most used anodic material in them is graphite due to its easy availability, inexpensiveness, electrical conductivity (band gap ∼0.4 eV), chemical stability, mechanical stability, moderate theoretical capacity of 372 mA h g−1, and reversible and effective intercalation reactions that it undergoes with Li-ions.1 Producing one million electric vehicles is estimated to require ∼75 × 106 kg of graphite.2 LIBs produced using such a huge amount of graphite are just discarded as landfills once their purpose is served, and LIBs get to a stage where they are called spent. It is foreseen that by the year 2030, 11 million tonnes of LIBs will be discarded.3 Of this huge amount of LIBs discarded, only <5% is recycled due to the high cost involved in their recycling process.3 On the other hand, the present supply of raw materials for the production of LIBs is perceived to be inadequate, considering the growing demand for LIBs.3 At this juncture of pressing situations, knowing the properties of constituent materials of LIBs after their life span and considering their possible reuse is essential so that the anticipated inadequacy of raw materials for producing LIBs can effectively be dealt with.Now, considering the structural aspects of graphite, which is the most common anode material in LIBs, its reuse will come in handy. As its structural aspects are not substantially disturbed or altered even after several cycles. The early studies conducted on the structural properties of graphite recovered from spent LIBs have revealed that its layered structures, electrical conductivity, and chemical and mechanical stabilities are intact without much alterations.4 This one aspect could be the driving force behind removing the graphite from spent LIBs and reusing it in new charge storage systems like supercapacitors. It is also imperative to consider that the graphite recovered from LIBs would possess residues of Li-ion containing electrolytes, binders like polyvinylidene fluoride (PVdF) and Nafion, and corrosion products of the current collector (Cu), which is possible in the long course of the use of LIBs. Such impurities should be removed in an attempt to reuse it. There are other reasons, such as the electrolyte (LiPF6 in ethylene carbonate, propylene carbonate, etc.) and the heavy metals (Mn, Co, Ni, etc.) present in them, that cause severe water and soil pollution.3 The expanded d-spacing of recovered graphite4 facilitates its conversion to other derivatives (like graphite oxide, reduced graphene oxide (rGO), and graphene) and necessitates the reuse of the parts of LIBs.
The use of graphene (contains no oxygen functionalities) and rGO (contains minimal oxygen functionalities, yet resembles the properties of graphene) in supercapacitors owing to their large surface area, electrical conductivity, mechanical stability, chemical stability, high charge-carrying ability, etc., is well established.5 Co(OH)2 is a well-known faradaic material known for its use in batteries and supercapacitors due to the facile synthesis and electrochemical processes that it undergoes.6 It exhibits good electrical conductivity7 and possesses a theoretical capacitance of 3460 F g−1.8,9 There are two polymorphs of Co(OH)2, which are in the α and β forms. The α-form possesses a hexagonal hydrotalcite structure, and the β-form possesses a hexagonal brucite structure, and their electronic band gaps are calculated to be 2.45 and 2.85 eV, respectively.10 In addition, α-Co(OH)2 exhibits larger interlayer spacing than β-Co(OH)2 (ref. 11) to exhibit faster intercalations of electrolytic ions in between the layer structures. However, β-Co(OH)2 is facile in its synthesis; therefore, its electrochemical energy storage properties should also be explored. A few of the Co(OH)2 containing supercapacitors and their specific capacitances are as follows: Co(OH)2/CNT/Ni (61 F g−1 at a current density of 0.15 A g−1),7 Co(OH)2/CoSe2 nano-sheet (349 C g−1 at a current density of 1 A g−1),12 Co(OH)2/Co3S4 nano-sheet (231 F g−1 at a current density of 1 A g−1),12 CoOOH/Co(OH)2 (104 F g−1 at a current density of 1 A g−1),13 NiCoP/Co(OH)2 (118 F g−1 at a current density of 1 A g−1),14 NiCo2S4/Co(OH)2 (101 F g−1 at a current density of 0.5 A g−1),15 β-Co(OH)2 nano-flower (416 F g−1 at a current density of 1 A g−1),16 and sheet-like Co(OH)2 (417 F g−1).17 These early studies indicate the fruitfulness of using Co(OH)2 as a supercapacitor electrode material.
Therefore, in this study, an attempt has been made to synthesize rGO/Co(OH)2 composite electrode materials for supercapacitors using the graphite recovered from LIBs as the source for rGO at different weight compositions of both rGO and Co(OH)2 (named as GC composites) and to compare the supercapacitance of the weight composition that provided maximum performance with the rGO/Co(OH)2 composite of similar weight composition synthesized using pristine graphite as a source for rGO (named as the GPGC composite). The supercapacitance of both GC and GPGC composites was evaluated using two electrodes containing a symmetric supercapacitor cell setup and 1 M H2SO4 as the electrolyte. The findings and the discussions are detailed in the forthcoming sections.
2 Experimental
2.1. Synthesis of rGO and Co(OH)2 composite using recovered graphite (GC)
In the synthesis of GC, in a 250 mL round-bottomed (RB) flask, 35 mg of GO that was synthesized using the recovered graphite (RG) (Section S1†) and 5.34 mL of 0.1 M CoSO4. 7 H2O and about 75 mL of distilled water were taken and sonicated for 45 minutes. After that, the pH of the reaction mixture was enhanced to 14 using 6 M KOH and an adequate amount of N2H4. H2O was added. The reduction reaction was conducted for 2 hours with constant stirring at 90 °C. Then, the end product was cooled, washed multiple times with distilled water (DW) and ethanol, extracted with ethanol, and dried at room temperature to get GC. The same method was followed with different amounts of CoSO4·7H2O by keeping the amount of GO constant to obtain GC composites with varying weights of Co(OH)2.2.2. Synthesis of rGO and Co(OH)2 composite using pristine graphite (GPGC)
For the synthesis of GPGC, the same synthetic procedure as that of GC with the exception of usage of GO synthesized using pristine graphite instead of GO synthesized using RG was followed. The fabrication of synthesized GC and GPGC into symmetric supercapacitors is detailed in the ESI (Section S2†). The structural and electrochemical characterization details of GC and GPGC are provided in ESI (Section S3).†3 Results and discussion
3.1. Structural characterizations
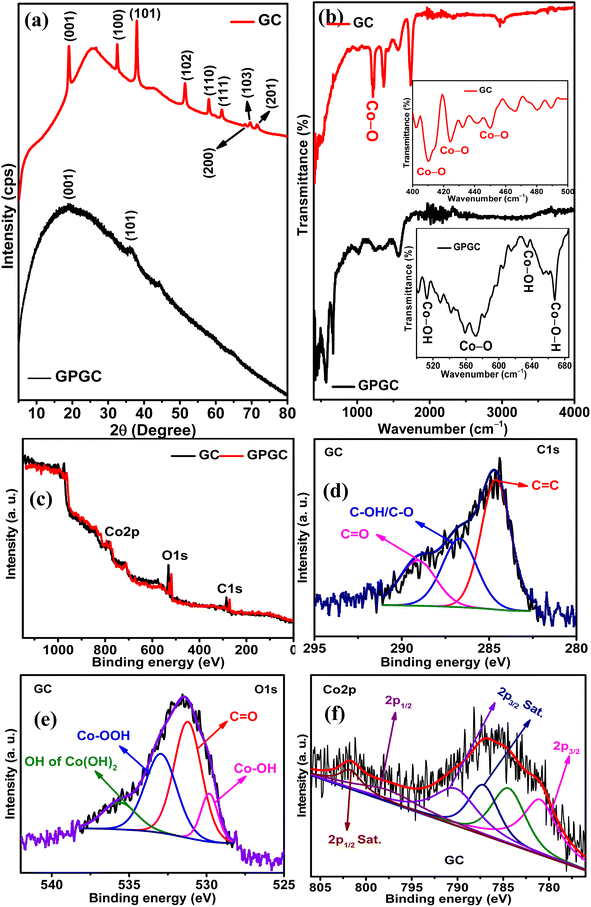
![[double bond, length as m-dash]](https://www.rsc.org/images/entities/char_e001.gif) C bonds of sp2 hybridized carbon,22 and the C
C bonds of sp2 hybridized carbon,22 and the C![[double bond, length as m-dash]](https://www.rsc.org/images/entities/char_e001.gif) O vibrations of the carboxylic acid groups21 present on GC, respectively. The peak at 3630 cm−1 pertains to the β-form of Co(OH)2.23 GPGC possesses a series of transmittances from 421 to 668 cm−1 corresponding to the different vibrational modes of bonds that exist in Co(OH)2. In that range of transmittances, the peaks at 513, 571–583, 634, and 668 cm−1 correspond to Co–OH tensile/Co–O vibrations,22,24 vibrations of Co–O bond of β-Co(OH)2,20 Co–OH flexural vibrations,25 and vibrations of Co–O–H bonds,26 respectively. The transmittances at 1254, 1351, and 1570 cm−1 are due to the vibrations of C–O stretching,21 O–H,25 and sp2 hybridized C
O vibrations of the carboxylic acid groups21 present on GC, respectively. The peak at 3630 cm−1 pertains to the β-form of Co(OH)2.23 GPGC possesses a series of transmittances from 421 to 668 cm−1 corresponding to the different vibrational modes of bonds that exist in Co(OH)2. In that range of transmittances, the peaks at 513, 571–583, 634, and 668 cm−1 correspond to Co–OH tensile/Co–O vibrations,22,24 vibrations of Co–O bond of β-Co(OH)2,20 Co–OH flexural vibrations,25 and vibrations of Co–O–H bonds,26 respectively. The transmittances at 1254, 1351, and 1570 cm−1 are due to the vibrations of C–O stretching,21 O–H,25 and sp2 hybridized C![[double bond, length as m-dash]](https://www.rsc.org/images/entities/char_e001.gif) C bonds,22 respectively.
C bonds,22 respectively.
![[double bond, length as m-dash]](https://www.rsc.org/images/entities/char_e001.gif) C, C–OH/C–O,19 and C
C, C–OH/C–O,19 and C![[double bond, length as m-dash]](https://www.rsc.org/images/entities/char_e001.gif) O27 bonds at 284.60, 286.69, and 289.08 eV, respectively. The deconvolution of O 1s (Fig. 1e) provided four peaks at 531.21, 532.94, 529.82, and 535.61 eV corresponding to Co–OH,28 C
O27 bonds at 284.60, 286.69, and 289.08 eV, respectively. The deconvolution of O 1s (Fig. 1e) provided four peaks at 531.21, 532.94, 529.82, and 535.61 eV corresponding to Co–OH,28 C![[double bond, length as m-dash]](https://www.rsc.org/images/entities/char_e001.gif) O,29 OH of Co(OOH)30 and OH of Co(OH)2,28 respectively. The Co 2p (Fig. 1f) spectra provided four peaks corresponding to the spin–orbit coupling of 2p3/2 and two peaks corresponding to 2p1/2. The peaks at 780.97 eV are associated with Co p3/2, and the peaks observed at 787.17 and 790.18 eV are corresponding to the satellite peaks.31 The peak at 784.41 eV indicates the presence of Co(OOH) along with Co(OH)2. The peaks corresponding to Co 2p1/2 and its satellite peak are at 797.59 and 801.70 eV, respectively.32,33 The doublet peak separation by 16.62 eV confirms the presence of Co(OH)2.34 Co 2p3/2 has two satellite peaks, one with a difference of 6.2 eV and another with 9.21 eV,25,35 indicating the presence of both Co2+ (Co(OH)2) and Co3+ (Co(OOH) in GC), respectively. GPGC also exhibited similar peaks upon deconvolution, and its deconvoluted core level spectra of C 1s, O 1s, and Co 2p are shown in Fig. S1.†
O,29 OH of Co(OOH)30 and OH of Co(OH)2,28 respectively. The Co 2p (Fig. 1f) spectra provided four peaks corresponding to the spin–orbit coupling of 2p3/2 and two peaks corresponding to 2p1/2. The peaks at 780.97 eV are associated with Co p3/2, and the peaks observed at 787.17 and 790.18 eV are corresponding to the satellite peaks.31 The peak at 784.41 eV indicates the presence of Co(OOH) along with Co(OH)2. The peaks corresponding to Co 2p1/2 and its satellite peak are at 797.59 and 801.70 eV, respectively.32,33 The doublet peak separation by 16.62 eV confirms the presence of Co(OH)2.34 Co 2p3/2 has two satellite peaks, one with a difference of 6.2 eV and another with 9.21 eV,25,35 indicating the presence of both Co2+ (Co(OH)2) and Co3+ (Co(OOH) in GC), respectively. GPGC also exhibited similar peaks upon deconvolution, and its deconvoluted core level spectra of C 1s, O 1s, and Co 2p are shown in Fig. S1.†
3.2. Electrochemical characterization
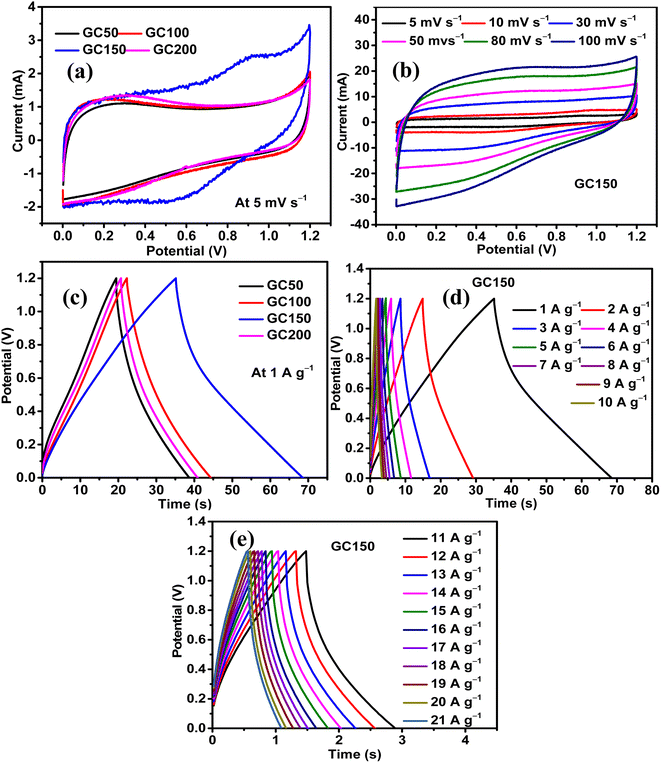
The influence of Co(OH)2 in enhancing the energy storage GC composite was studied by maintaining the concentration of rGO constant and varying the quantity of Co(OH)2. There were four composites synthesized in the series, and they had a constant quantity of rGO as 25 mg and variable quantities of Co(OH)2 as 50, 100, 150, and 200 mg. The composites were named as GC50, GC100, GC150, and GC200, respectively, in accordance with their Co(OH)2 concentration. The energy storage performance evaluation was conducted using 1 M H2SO4 as the electrolyte and at the potential range of 0–1.2 V in a symmetric two-electrode configuration. The results revealed that there was an increase in the energy storage of GC composites with an increase in the quantity of Co(OH)2 until 150 mg, beyond which there was a decrease in the energy storage. Therefore, a composite with a weight ratio similar to that of GC150 was synthesized using pristine graphite as the source of GO and in turn rGO, and named as GPGC150. It was observed that the supercapacitance of GC150 was higher than that of the GPGC150, indicating the fruitfulness of using graphite recovered from the spent Li-ion batteries (LIBs) as a source for synthesizing rGO, specifically for the synthesis of rGO/Co(OH)2 composites, following the synthetic route mentioned in Section 2.1.| Composite | C s (F g−1) | Q (C g−1) | E (W h kg−1) | P (kW kg−1) | η (%) |
|---|---|---|---|---|---|
| GC50 | 21 | 25 | 4.13 | 0.77 | 98.67 |
| GC100 | 21 | 26 | 4.30 | 0.70 | 99.28 |
| GC150 | 36 | 43 | 7.16 | 0.77 | 94.99 |
| GC200 | 21 | 25 | 4.20 | 0.75 | 97.58 |
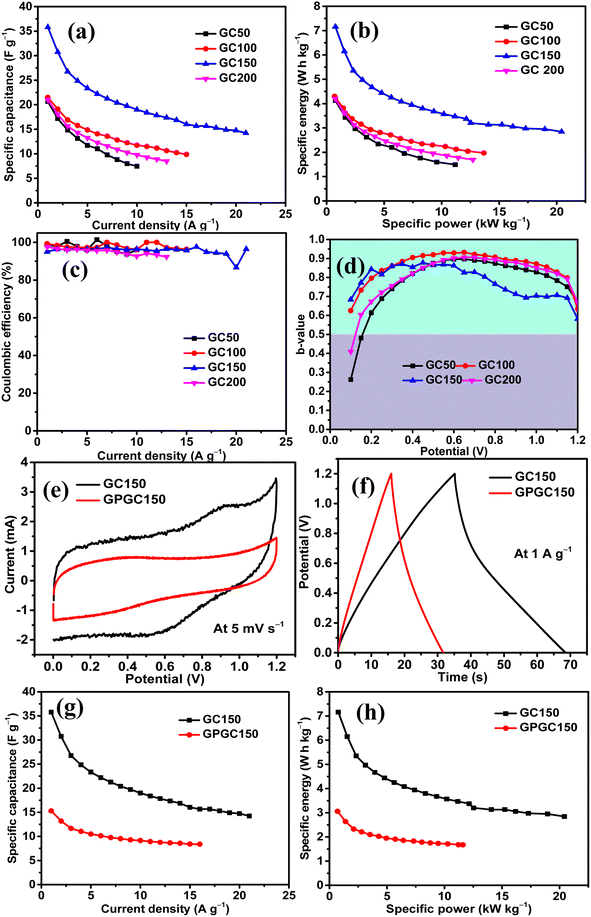
The sustainability of higher applied current, storage, and delivery of high energy at these maximum applied currents are seen in the form of the rate capabilities of GC composites. The maximum tolerable current density exhibited by GC50, GC100, GC150, and GC200 are found to be 10, 15, 21, and 13 A g−1, respectively. The high tolerable current density of GC150 indicates its robustness and faster mobility of electrolytic ions into the bulk of the GC150, which is reversible even at a high current density (Fig. 5d, e, and 6a). The higher rate capability of GC150 in comparison with other GC composites indicates the faster kinetic of electrolytic ions and electrochemical reactions that are taking place in it even at higher applied currents in comparison with other GC composites.
The maximum E and P exhibited by GC50, GC100, GC150, and GC200 are 4.13 W h kg−1 and 0.77 kW kg−1; 4.30 W h kg−1 and 0.70 kW kg−1; 7.16 W h kg−1 and 0.77 kW kg−1; and 4.20 W h kg−1 and 0.75 kW kg−1, respectively (Fig. 6b). The maintenance E with respect to increase in current density follows the same orders as that of their Cs order. All the GC composites exhibit the η close to 100% at all current densities, indicating the reversibility of their electrochemical reactions at all current densities (Fig. 6c). Considering the significance of the b-values with regard to the energy storage processes taking place in an electrode and its magnitude (eqn (S9)†), it is clear that all the GC composites other than GC150 (Fig. 6d) are involved in the intercalation mechanism at lower and higher potentials and majorly EDL formation at mid potential ranges. Meanwhile, GC150 involves the simultaneous operations of both mechanisms in the entire potential range, giving rise to higher energy storage than that of other GC composites. In order to comprehend the inference mentioned above, it is imperative to consider that the diffusion-controlled intercalation processes bring about higher energy storage in comparison with surface phenomena like EDL formation and redox reactions. In addition, this higher occurrence of intercalation processes has produced a slightly different CV curve in GC150 in relation to other GC composites, as seen in Fig. 5a. Since GC150 has exhibited superior energy storage performance among the GC composites, a composite with a similar weight composition as that of GC150 was synthesized using pristine graphite as a source for GO and, in turn, rGO, whose energy storage performance was evaluated and compared with that of GC150. The CV area (Fig. 6e) and the td (Fig. 6f) exhibited by GPGC150 is lower than that of GC150, indicating its lower energy storage performance in comparison with GC150. The energy storage parameters of GPGC150 are presented in Table 2, indicating its low energy characteristics in comparison with GC150. The maximum Cs, Q, E, P, and η exhibited by GPGC150 are 15 F g−1, 18 C g−1, 3.06 W h kg−1, 0.70 kW kg−1, and 97.51%, respectively.
| Composite | C s (F g−1) | Q (C g−1) | E (W h kg−1) | P (kW kg−1) | η (%) |
|---|---|---|---|---|---|
| GC150 | 36 | 43 | 7.16 | 0.77 | 94.99 |
| GPGC150 | 15 | 18 | 3.06 | 0.70 | 97.51 |
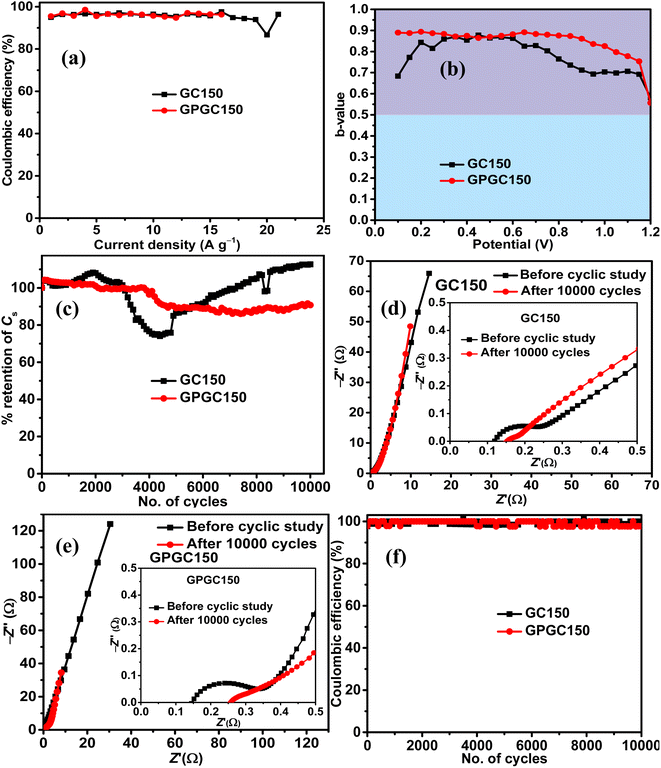
The maximum tolerable current density of GPGC150 is 16 A g−1, at which it maintains 53.33% (8 F g−1) of its initial Cs (15 F g−1) (Fig. 6g). It should be noted that the rate capability exhibited by GPGC150 is superior to GC150, indicating the occurrence of an electrochemical reaction in a similar fashion as that of lower current densities even at higher current densities, which is not the case with GC150. The retention of E with an increase in current density follows a similar order to that of Csvs. current density. The plots of E vs. P depict the comparison between E and P of GC150 and GPGC150 (Fig. 6h). The η of GPGC150 is slightly higher than GC150 at lower current densities and is closer to 100% at its mid and higher current densities, indicating the higher reversibility of electrochemical reactions occurring in GPGC150 in comparison with GC150 (Table 2 and Fig. 7a). The plots of b-value vs. potential (Fig. 7b) indicate that GPGC150 stores energy majorly by surface phenomena and to a minimum extent by the intercalation phenomena and thus it exhibits lower energy storage and better rate capability than GC150 as the surface phenomenon like EDLC is highly reversible compared to the intercalation reactions. As seen from Fig. 7b, GC150 and GPGC150 store energy not only by surface capacitive processes but also by diffusion-controlled intercalation processes. The kinetics of intercalation processes are lower than the surface energy storage processes like electrical double layer formation and pseudo surface reactions, and therefore the lower coulombic efficiencies in the range ∼95% are attained. The cyclic stability study conducted at a current density of 10 A g−1 for 10![[thin space (1/6-em)]](https://www.rsc.org/images/entities/char_2009.gif) 000 continuous charge and discharge cycles (Fig. 7c) depicts that there is a deterioration in Cs up to 4800 cycles and beyond, where a constant increase in Cs up to 10
000 continuous charge and discharge cycles (Fig. 7c) depicts that there is a deterioration in Cs up to 4800 cycles and beyond, where a constant increase in Cs up to 10![[thin space (1/6-em)]](https://www.rsc.org/images/entities/char_2009.gif) 000 cycles is seen in the case of GC150. At the end of the 10
000 cycles is seen in the case of GC150. At the end of the 10![[thin space (1/6-em)]](https://www.rsc.org/images/entities/char_2009.gif) 000 cycles, GC150 exhibits 12.75% higher Cs than that of the initial capacitance, whereas GPGC150 exhibits a gradual deterioration and maintains 90.77% of its initial Cs. The observed improvement in the specific capacitance after 5000 cycles in the case of GC150 is because the continuous electrolytic insertion and extraction increase the extent of the intercalation processes, increasing the specific capacitance after 5000 cycles. This is confirmed by the b-values obtained after 10
000 cycles, GC150 exhibits 12.75% higher Cs than that of the initial capacitance, whereas GPGC150 exhibits a gradual deterioration and maintains 90.77% of its initial Cs. The observed improvement in the specific capacitance after 5000 cycles in the case of GC150 is because the continuous electrolytic insertion and extraction increase the extent of the intercalation processes, increasing the specific capacitance after 5000 cycles. This is confirmed by the b-values obtained after 10![[thin space (1/6-em)]](https://www.rsc.org/images/entities/char_2009.gif) 000 cycles of continuous charge discharge. In addition, it is clear that the peak created at the lower potential region is due to the intercalation process as the b-value corresponds to peak potential closer to 0.5, as seen in Fig. S6.† The Nyquist plots obtained after 10
000 cycles of continuous charge discharge. In addition, it is clear that the peak created at the lower potential region is due to the intercalation process as the b-value corresponds to peak potential closer to 0.5, as seen in Fig. S6.† The Nyquist plots obtained after 10![[thin space (1/6-em)]](https://www.rsc.org/images/entities/char_2009.gif) 000 cycles for GC150 (Fig. 7d) and GPGC150 (Fig. 7e) depict that in both cases, there is an increase in solution resistance (Rs),38 a decrease in charge transfer resistance (Rct)38 and decrease in Warburg resistance.39 The decrease in Rct and the Warburg resistance (W) resulted in appreciable cyclic stability despite the increase in Rs. Therefore, the detrimental effect caused by the increase in Rs to GC150 and GPGC150 is possibly compensated by the decrease in Rct and W, and hence, there are negligible and minimal performance deteriorations in the cases of GC150 and GPGC150, respectively, at the end of the 10
000 cycles for GC150 (Fig. 7d) and GPGC150 (Fig. 7e) depict that in both cases, there is an increase in solution resistance (Rs),38 a decrease in charge transfer resistance (Rct)38 and decrease in Warburg resistance.39 The decrease in Rct and the Warburg resistance (W) resulted in appreciable cyclic stability despite the increase in Rs. Therefore, the detrimental effect caused by the increase in Rs to GC150 and GPGC150 is possibly compensated by the decrease in Rct and W, and hence, there are negligible and minimal performance deteriorations in the cases of GC150 and GPGC150, respectively, at the end of the 10![[thin space (1/6-em)]](https://www.rsc.org/images/entities/char_2009.gif) 000 cycles. The coulombic efficiency (Fig. 7f) of both GC150 and GPGC150 is closer to 100% during the cyclic stability study until 10
000 cycles. The coulombic efficiency (Fig. 7f) of both GC150 and GPGC150 is closer to 100% during the cyclic stability study until 10![[thin space (1/6-em)]](https://www.rsc.org/images/entities/char_2009.gif) 000 cycles, indicating the intact faster kinetics of the energy storage processes.
000 cycles, indicating the intact faster kinetics of the energy storage processes.
The Nyquist plots of GC150 and GPGC150 possess a semicircle at a higher frequency and a linear Warburg portion at a lower frequency, indicating their capacitive nature (Fig. 8a). The various electrical elements involved in the energy storage processes of GC composites were deduced by fitting the obtained Nyquist plots to an equivalent circuit of Rs(RctQ1)((RleakCdl)(Q2))W, and the obtained values are provided in Table S2 (Fig. S7).† The descriptions for electrical elements of equivalent circuits are the same as they are provided in ref. 19 and also provided in ESI (Section S4).† As it is seen in the table, the sums of Rs, Rct, Rleak, and W are 2.59, 0.78, 0.66, and 8.26 Ω for GC50, GC100, GC150, and GC200, respectively. The lower value of GC150 indicates its higher energy storage character than the other GC composites. The cumulative of Rs, Rct, and W, are equivalent to the real axis of the Nyquist plot, is called as series resistance (Fig. 8b). The series resistances exhibited by GC150 and GPGC150 are 14.54 Ω and 30.48 Ω, respectively; this low series resistance of GC150 resulted in its high capacitance of 0.24 F (eqn (S9)†) at a lower frequency of 0.01 Hz (Fig. 8c), which is higher than the lower capacitance (0.13 F) exhibited by GPGC150 due to its higher series resistance under similar circumstances. The Nyquist plots of all the GC composites possess semicircles in the higher frequency region and linear Warburg lines in the lower frequency region (Fig. S8a†), indicating their capacitive nature. The series resistance is proportional to the real axis of the Nyquist plots and decreases in its magnitude with an increase in Co(OH)2 concentration until the loading of 150 mg and beyond, which it increases (Fig. S8b†). The GC corresponding to the weight of 150 mg of Co(OH)2 is GC150, which possesses the lowest series resistance at the lowest frequency of 0.01 Hz. This lower series resistance of GC150 is responsible for its high capacitance of 0.24 F (eqn (S10)†) at 0.01 Hz (Fig. S8c†). The supercapacitance of GC150 obtained is compared with similar reported rGO/Co(OH)2 composites, and the comparison is presented in Table 3. The rGOs presented in Table 3 were obtained from pristine graphite, except in the present study. The comparison between the two and three electrodes is possible, considering that the performance obtained by the three-electrode system is four-fold higher than that obtained by the two-electrode system.40
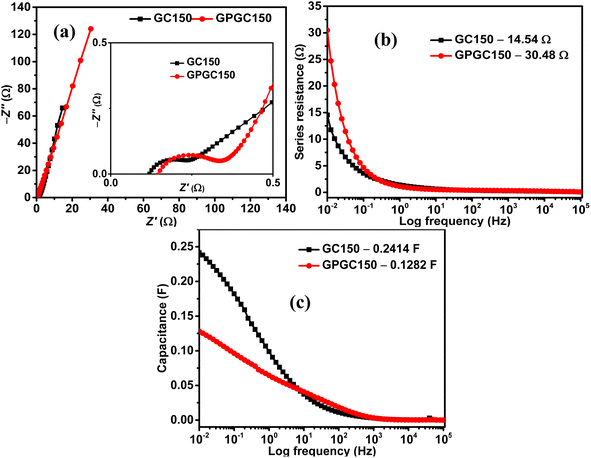 | ||
| Fig. 8 (a) Nyquist plots, plots of (b) series resistance vs. log frequency, and (c) capacitance vs. log frequency of GC150 and GPGC150. | ||
| Electrode | Electrolyte | E (V) | C s (F g−1) | E (W h kg−1) | P (kW kg−1) | Cyclic stability | Ref. |
|---|---|---|---|---|---|---|---|
| 2-EL | |||||||
| rGO/β-Co(OH)2 (GC150) | 1 M H2SO4 | 1.2 | 36 at 1 A g−1 | 7.16 | 0.77 | No deterioration up to 10![[thin space (1/6-em)]](https://www.rsc.org/images/entities/char_2009.gif) 000 cycles at 10 A g−1 000 cycles at 10 A g−1 |
Present work |
![[thin space (1/6-em)]](https://www.rsc.org/images/entities/char_2009.gif) |
|||||||
| 3-EL | |||||||
| α-Co(OH)2/rGO/carbon fibre paper | 1 M NaOH | 0.5 | 1093 at 1.8 A g−1 | — | — | 2% deterioration up to 5000 cycles at 1.8 A g−1 | 34 |
| rGO/Co(OH)2 | 2 M KOH | 0.5 | 1100 at 0.5 A g−1 | — | — | 1.9% deterioration up to 2000 cycles at 5 A g−1 | 41 |
| rGO/Co(OH)2 | 2 M KOH | 0.5 | 474 at 1 A g−1 | — | — | 10% deterioration up to 1000 cycles at 3 A g−1 | 26 |
| rGO/Co(OH)2 | 2 M KOH | 0.8 | 734 at 1 A g−1 | — | — | 5% deterioration up to 1000 cycles at 1 A g−1 | 23 |
4 Conclusions
The supercapacitance studies were carried out on two composites of rGO/β-Co(OH)2 with the same weight composition, with the difference among them being the graphite sources, one being the graphite recovered from spent Li-ion batteries (GC150 (rGO25mg/β-Co(OH)2 150mg)) and the other being pristine graphite (GPGC150). The study revealed that GC150 exhibits superior energy storage performances compared to GPGC150. However, the rate capability of GPGC150 is found to be higher than that for GC150. Both the composites exhibited better cyclic stabilities up to 10,000 cycles at a current density of 10 A g−1. GC150 exhibited a zero deterioration, while GPGC150 exhibited 9.23% of deterioration. GC150 provided higher tolerable current density up to 21 A g−1. The energy storage parameters, viz., specific capacitance, specific capacity, specific energy, specific power, and coulombic efficiency, provided by GC150 at 1 A g−1 were 36 F g−1, 43 C g−1, 7.16 W h kg−1, 0.77 kW kg−1, and 94.99%, respectively. The rGO/β-Co(OH)2 composites synthesized using recovered graphite as the source for rGO exhibit supercapacitance better than their analog that is synthesized using pristine graphite as the source for rGO by the synthetic route followed in the present study. Therefore, using graphite recovered from the spent Li-ion batteries to make electrodes for supercapacitors could be a wise notion in attaining sustainable energy materials for the future.Conflicts of interest
There are no conflicts to declare.Acknowledgements
VA acknowledges financial support from the Science and Engineering Research Board, a statutory body of the Department of Science and Technology (DST), Govt. of India, through the Swarnajayanti Fellowship (SB/SJF/2020-21/12) and Waste Management Technologies (DST/TDT/WMT/Power Ind. Waste/2021/01) by DST. Dr Aranganathan Viswanathan (AV) acknowledges the financial support provided by the Science and Engineering Research Board (SERB), India, in the form of National Post-Doctoral Fellowship.References
- S. Natarajan and V. Aravindan, An Urgent Call to Spent LIB Recycling: Whys and Wherefores for Graphite Recovery, Adv. Energy Mater., 2020, 10, 2002238, DOI:10.1002/aenm.202002238
.
- M. L. Divya, S. Natarajan and V. Aravindan, Graphene from Spent Lithium-Ion Batteries, Batteries Supercaps, 2022, 5, e202200046, DOI:10.1002/batt.202200046
.
- S. Natarajan and V. Aravindan, Burgeoning Prospects of Spent Lithium-Ion Batteries in Multifarious Applications, Adv. Energy Mater., 2018, 8, 1802303, DOI:10.1002/aenm.201802303
.
- M. L. Divya, S. Natarajan and V. Aravindan, Graphene from Spent Lithium-Ion Batteries, Batteries Supercaps, 2022, 5, e202200046, DOI:10.1002/batt.202200046
.
- B. Zhao, P. Liu, Y. Jiang, D. Pan, H. Tao, J. Song, T. Fang and W. Xu, Supercapacitor performances of thermally reduced graphene oxide, J. Power Sources, 2012, 198, 423–427, DOI:10.1016/j.jpowsour.2011.09.074
.
- R. Shokrani-Havigh and Y. Azizian-Kalandaragh, Preparation of cobalt hydroxide and cobalt oxide nanostructures using ultrasonic waves and investigation of their optical and structural properties, J. Optoelectron. Adv. Mater., 2017, 19, 283–288 CAS
.
- T. Peng, H. Wang, H. Yi, Y. Jing, P. Sun and X. Wang, Co(OH)2 Nanosheets Coupled With CNT Arrays Grown on Ni Mesh for High-Rate Asymmetric Supercapacitors with Excellent Capacitive Behavior, Electrochim. Acta, 2015, 176, 77–85, DOI:10.1016/j.electacta.2015.06.118
.
- W. Fu, L. Long, M. Wang, Y. Yao, N. Wei, M. Yan, G. Yin, X. Liao, Z. Huang and X. Chen, Pine needle β-Co(OH)2 grown on Ni foam substrate for high specific capacitance and good cycling stability as advanced electrochemical pseudocapacitor materials, J. Alloys Compd., 2015, 631, 82–85, DOI:10.1016/j.jallcom.2015.01.089
.
- C. Yuan, X. Zhang, B. Gao and J. Li, Synthesis and electrochemical capacitance of mesoporous Co(OH)2, Mater. Chem. Phys., 2007, 101, 148–152, DOI:10.1016/j.matchemphys.2006.03.013
.
- M. Suksomboon, K. Kongsawatvoragul, S. Duangdangchote and M. Sawangphruk, Reducing the Energy Band Gap of Cobalt Hydroxide Nanosheets with Silver Atoms and Enhancing Their Electrical Conductivity with Silver Nanoparticles, ACS Omega, 2021, 6, 20804–20811, DOI:10.1021/acsomega.1c01908
.
- L.-B. Kong, J.-W. Lang, M. Liu, Y.-C. Luo and L. Kang, Facile approach to prepare loose-packed cobalt hydroxide nano-flakes materials for electrochemical capacitors, J. Power Sources, 2009, 194, 1194–1201, DOI:10.1016/j.jpowsour.2009.06.016
.
- K. Song, W. Li, J. Xin, Y. Zheng, X. Chen, R. Yang, W. Lv and Q. Li, Hierarchical porous heterostructured Co(OH)2/CoSe2 nanoarray: A controllable design electrode for advanced asymmetrical supercapacitors, Chem. Eng. J., 2021, 419, 129435, DOI:10.1016/j.cej.2021.129435
.
- Y. Yu, Y. Tan, B. Yang, L. Yuan, X. Shen and X. Hu, Electrochemical transformation method for the preparation of novel 3D hybrid porous CoOOH/Co(OH)2 composites with excellent pseudocapacitance performance, J. Power Sources, 2019, 443, 227278, DOI:10.1016/j.jpowsour.2019.227278
.
- H. Wang, Y. Zhu, Q. Zong, Q. Wang, H. Yang and Q. Zhang, Hierarchical NiCoP/Co(OH)2 nanoarrays for high-performance asymmetric hybrid supercapacitors, Electrochim. Acta, 2019, 321, 134746, DOI:10.1016/j.electacta.2019.134746
.
- R. Li, S. Wang, Z. Huang, F. Lu and T. He, NiCo2S4@Co(OH)2 core-shell nanotube arrays in situ grown on Ni foam for high performances asymmetric supercapacitors, J. Power Sources, 2016, 312, 156–164, DOI:10.1016/j.jpowsour.2016.02.047
.
- C. Mondal, M. Ganguly, P. K. Manna, S. M. Yusuf and T. Pal, Fabrication of Porous β-Co(O)2 Architecture at Room Temperature: A High Performance Supercapacitor, Langmuir, 2013, 29, 9179–9187, DOI:10.1021/la401752n
.
- Z. Hu, L. Mo, X. Feng, J. Shi, Y. Wang and Y. Xie, Synthesis and electrochemical capacitance of sheet-like cobalt hydroxide, Mater. Chem. Phys., 2009, 114, 53–57, DOI:10.1016/j.matchemphys.2008.07.073
.
- P. Jeevanandam, Y. Koltypin, A. Gedanken and Y. Mastai, Synthesis of α-cobalt(II) hydroxide using ultrasound radiation, J. Mater. Chem., 2000, 10, 511–514, 10.1039/A908065A
.
- A. Viswanathan and A. N. Shetty, Single step synthesis of rGO, copper oxide and polyaniline nanocomposites for high energy supercapacitors, Electrochim. Acta, 2018, 289, 204–217, DOI:10.1016/j.electacta.2018.09.033
.
- G. Abarca, P. L. Ríos, P. Povea, C. Cerda-Cavieres, C. Morales-Verdejo, J. L. Arroyo and M. B. Camarada, Nanohybrids of reduced graphene oxide and cobalt hydroxide (Co(OH)2 |rGO) for the thermal decomposition of ammonium perchlorate, RSC Adv., 2020, 10, 23165–23172, 10.1039/D0RA02853C
.
- H.-W. Wang, Z.-A. Hu, Y.-Q. Chang, Y.-L. Chen, Z.-Y. Zhang, Y.-Y. Yang and H.-Y. Wu, Preparation of reduced graphene oxide/cobalt oxide composites and their enhanced capacitive behaviors by homogeneous incorporation of reduced graphene oxide sheets in cobalt oxide matrix, Mater. Chem. Phys., 2011, 130, 672–679, DOI:10.1016/j.matchemphys.2011.07.043
.
- S. Liu, L. Zhou, L. Yao, L. Chai, L. Li, G. Zhang, Kankan and K. Shi, One-pot reflux method synthesis of cobalt hydroxide nanoflake-reduced graphene oxide hybrid and their NOx gas sensors at room temperature, J. Alloys Compd., 2014, 612, 126–133, DOI:10.1016/j.jallcom.2014.05.129
.
- S. Abbas Rahimi, P. Norouzi and M. Reza Ganjali, One-step cathodic electrodeposition of a cobalt hydroxide–graphene nanocomposite and its use as a high performance supercapacitor electrode material, RSC Adv., 2018, 8, 26818–26827, 10.1039/C8RA04105A
.
- X. Wang, W. Wu, Z. Wang, Z. Li, X. Wang, C. Zhou and Y. Luo, Cobalt Hydroxide Nanosheets Grown on Carbon Nanotubes Anchored in Wood Carbon Scaffolding for High-Performance Hybrid Supercapacitors, Energy Fuels, 2021, 35, 18815–18823, DOI:10.1021/acs.energyfuels.1c03129
.
- X. Wang, W. Wu, Z. Wang, Z. Li, X. Wang, C. Zhou and Y. Luo, Cobalt Hydroxide Nanosheets Grown on Carbon Nanotubes Anchored in Wood Carbon Scaffolding for High-Performance Hybrid Supercapacitors, Energy Fuels, 2021, 35, 18815–18823, DOI:10.1021/acs.energyfuels.1c03129
.
- Z. Li, J. Wang, L. Niu, J. Sun, P. Gong, W. Hong, L. Ma and S. Yang, Rapid synthesis of graphene/cobalt hydroxide composite with enhanced electrochemical performance for supercapacitors, J. Power Sources, 2014, 245, 224–231, DOI:10.1016/j.jpowsour.2013.06.121
.
- A. Viswanathan, B. G. Prakashaiah, V. Subburaj and A. N. Shetty, High energy reduced graphene oxide/vanadium Pentoxide/polyaniline hybrid supercapacitor for power backup and switched capacitor converters, J. Colloid Interface Sci., 2019, 545, 82–93, DOI:10.1016/j.jcis.2019.03.013
.
- J. Haber, J. Stoch and L. Ungier, X-ray photoelectron spectra of oxygen in oxides of Co, Ni, Fe and Zn, J. Electron Spectrosc. Relat. Phenom., 1976, 9, 459–467, DOI:10.1016/0368-2048(76)80064-3
.
- A. Viswanathan and A. N. Shetty, Single step synthesis of rGO, copper oxide and polyaniline nanocomposites for high energy supercapacitors, Electrochim. Acta, 2018, 289, 204–217, DOI:10.1016/j.electacta.2018.09.033
.
- X. Cui, H. Zhao and Z. Li, Hexagonal cobalt oxyhydroxide nanoflakes/reduced graphene oxide for hydrogen peroxide detection in biological samples, Anal. Bioanal. Chem., 2018, 410, 7523–7535, DOI:10.1007/s00216-018-1370-6
.
- A. García-Gómez, S. Eugénio, R. G. Duarte, T. M. Silva, M. J. Carmezim and M. F. Montemor, Electrodeposited reduced-graphene oxide/cobalt oxide electrodes for charge storage applications, Appl. Surf. Sci., 2016, 382, 34–40, DOI:10.1016/j.apsusc.2016.04.113
.
- B. J. Tan, K. J. Klabunde and P. M. A. Sherwood, XPS studies of solvated metal atom dispersed (SMAD) catalysts. Evidence for layered cobalt-manganese particles on alumina and silica, J. Am. Chem. Soc., 1991, 113, 855–861, DOI:10.1021/ja00003a019
.
- S. Chan Lee, U. M. Patil, S. Jun Kim, S. Ahn, S.-W. Kang and S. Chan Jun, All-solid-state flexible asymmetric micro supercapacitors based on cobalt hydroxide and reduced graphene oxide electrodes, RSC Adv., 2016, 6, 43844–43854, 10.1039/C6RA06034J
.
- M. Suksomboon, P. Srimuk, A. Krittayavathananon, S. Luanwuthi and M. Sawangphruk, Effect of alkaline electrolytes on the charge storage capacity and morphology of porous layered double cobalt hydroxide-coated graphene supercapacitor electrodes, RSC Adv., 2014, 4, 56876–56882, 10.1039/C4RA11727A
.
- Y. Yang, P. Zhu, L. Zhang, F. Zhou, T. Li, R. Bai, R. Sun and C. Wong, Electrodeposition of Co(OH)2 Improving Carbonized Melamine Foam Performance for Compressible Supercapacitor Application, ACS Sustain. Chem. Eng., 2019, 7, 16803–16813, DOI:10.1021/acssuschemeng.9b04321
.
- P. Fei Liu, S. Yang, L. Rong Zheng, B. Zhang and H. Gui Yang, Electrochemical etching of α-cobalt hydroxide for improvement of oxygen evolution reaction, J. Mater. Chem. A, 2016, 4, 9578–9584, 10.1039/C6TA04078K
.
- M. Thommes, K. Kaneko, A. V. Neimark, J. P. Olivier, F. Rodriguez-Reinoso, J. Rouquerol and K. S. W. Sing, Physisorption of gases, with special reference to the evaluation of surface area and pore size distribution (IUPAC Technical Report), Pure Appl. Chem., 2015, 87, 1051–1069, DOI:10.1515/pac-2014-1117
.
- B.-A. Mei, O. Munteshari, J. Lau, B. Dunn and L. Pilon, Physical Interpretations of Nyquist Plots for EDLC Electrodes and Devices, J. Phys. Chem. C, 2018, 122, 194–206, DOI:10.1021/acs.jpcc.7b10582
.
- L. Zuniga, G. Gonzalez, R. Orrostieta Chavez, J. C. Myers, T. P. Lodge and M. Alcoutlabi, Centrifugally Spun α-Fe2O3/TiO2/Carbon Composite Fibers as Anode Materials for Lithium-Ion Batteries, Appl. Sci., 2019, 9, 4032, DOI:10.3390/app9194032
.
- A. Viswanathan and A. N. Shetty, Supporting electrolyte enhanced supercapacitance of acetic acid doped reduced graphene oxide/nickel hydroxide/polyaniline nanocomposites, J. Energy Storage, 2023, 65, 107337, DOI:10.1016/j.est.2023.107337
.
- M. S. Vidhya, G. Ravi, R. Yuvakkumar, D. Velauthapillai, M. Thambidurai, C. Dang, B. Saravanakumar, A. Syed and T. M. S. Dawoud, Functional reduced graphene oxide/cobalt hydroxide composite for energy storage applications, Mater. Lett., 2020, 276, 128193, DOI:10.1016/j.matlet.2020.128193
.
Footnote |
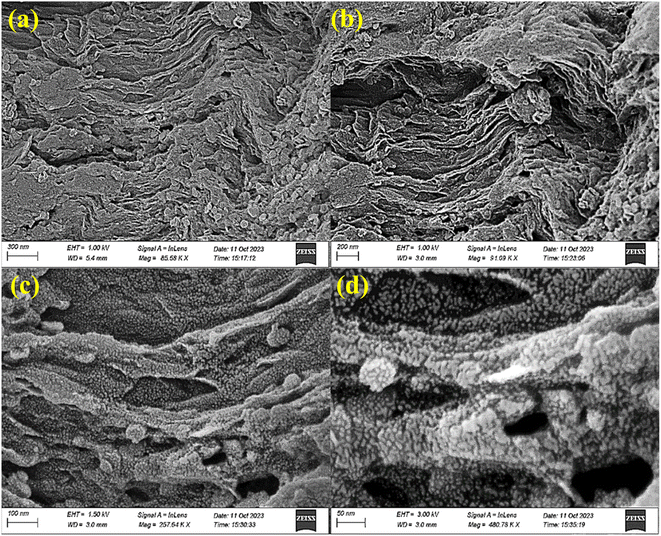
| † Electronic supplementary information (ESI) available: Recovery of graphite from spent Li-ion batteries and synthesis of graphite oxide (GO) by modified Hummers' method (S1), fabrication details (S2), characterizations and measurements techniques (S3), formulae involved in determining the crystallite size, number of graphene layers per domain or crystallite (eqn (S1)–(S3)), Fig. S1 (XPS studies of GPGC), Fig. S2 (FE-SEM of GC), Fig. S3, Tables S1, S2, Fig. S4, Fig. S5, eqn (S4) to (S10). See DOI: https://doi.org/10.1039/d4su00133h |
| This journal is © The Royal Society of Chemistry 2024 |

