Geographical traceability of cultivated Paris polyphylla var. yunnanensis using ATR-FTMIR spectroscopy with three mathematical algorithms†
Yi-Fei
Pei
ab,
Li-Hua
Wu
a,
Qing-Zhi
Zhang
b and
Yuan-Zhong
Wang
 *a
*a
aInstitute of Medicinal Plants, Yunnan Academy of Agricultural Sciences, Kunming 650200, PR China. E-mail: boletus@126.com
bCollege of Traditional Chinese Medicine, Yunnan University of Traditional Chinese Medicine, Kunming 650500, PR China
First published on 26th November 2018
Abstract
Paris polyphylla has been used by multiple nationalities as a traditional herb medicine to treat diseases in different regions of China. Since Paris quality is influenced by geographical regions, a fast and effective geographical traceability method is necessary. In our study, the geographical origin discrimination of 789 P. yunnanensis species from central, western, northwest, southeast and southwest Yunnan with 3rd to 8th cultivation years was carried out by chemometric of partial least squares discriminant analysis (PLS-DA), random forest (RF) and hierarchical cluster analysis (HCA) combined with attenuated total reflection-Fourier transform mid infrared (ATR-FTMIR). The results indicated that principal component analysis (PCA) was successfully used as an exploration data analysis method to remove outliers. Additionally, classification ability of PLS-DA model, established by variable importance for the projection (VIP), was similar to that of PLS-DA model, which indicated that raw ATR-FTMIR spectra contained abundant redundant information useless for classifying samples. For each model, the range of VIP values of PLS-DA is wider than the range of the important variables of RF, and PLS-DA was more time-efficient and high-ability than RF model. Besides, the geographical origin PLS-DA classification model with all collected samples was used to verify the results with accuracy rates of calibration set and validation set of 98.34% and 93.78%, respectively. HCA verified that the impact of geographical origin on P. yunnanensis characteristics is greater than that of the number of cultivation years. In short, PLS-DA model can assure the accuracy and limit time for identification analysis of cultivated P. yunnanensis quality assessment from different geographical origins.
Introduction
Paris is one type of traditional herb medicines in China, of which Paris polyphylla var. yunnanensis (Franch.) Hand.-Mazz. (P. yunnanensis) and P. polyphylla Smith var. chinensis (Franch.) Hara (P. chinensis) are defined as botanical sources of crude herbs in Chinese Pharmacopoeia (2015 edition).1 “Shennong Bencao” and “Diannan Bencao” have recorded “Zaoxiu” and “Chonglou” firstly in history of Chinese traditional medicine, respectively. Paris was mainly used to treat traumatic injury, innominate toxin swelling, fracture, abscess, snake bites and insect stings in Miao, Bai, Dai, Yi, Dong and other ethnic minorities in Chinese early folk. The steroidal saponin, cholestanol, steroids, phytosterol, molting hormones, flavone and pentacyclic triterpene were verified as the main chemical components in Paris.2 Additionally, owing to its anti-tumor,3 anti-bacterial,4 anti-myocardial ischemia,5 immune-regulation,6 and insect repellent7 pharmacological effects, 81 kinds of Chinese patent medicines were produced in China, and more than 800–1050 Paridis Rhizoma (rhizome of P. yunnanensis and P. chinensis) compounds were circulated in traditional herbal medicine markets every year.8 In other word, Paridis Rhizoma has shown huge medicinal and commercial value.P. yunnanensis commonly takes 4 years to grow from seed to flower and the content of saponins can reach its highest in the 7th to 8th year.9,10 Visibly, the number of growth years impacts the quality of Paris rhizome. Due to longer growth periods of Paris and the increasing Paridis Rhizoma market demand, the unplanned indiscriminate mining phenomena occurred frequently, leading to a sharp decline in the amount of wild Paris. The habitat areas of wild Paris gradually reduced to southwest China in recent years. Additionally, Paris was defined as the vulnerable species by International Union for Conservation of Nature (IUCN). Hence, the emergence of cultivated Paris was effective and important for protecting the wild medicinal materials. P. yunnanensis and P. chinensis were the two widely cultivated species of Paris in numerous areas of China mainly in southwest regions, including Yunnan Province. However, Paridis Rhizoma qualities are different in central, southern and western Yunnan or in other geographical locations in Yunnan Province.11,12 Hence, different sale prices also appeared on Chinese herb medicinal markets because Paridis Rhizoma were collected from diverse cultivated regions and showed different qualities. Furthermore, driven by demand, some phenomena of adulteration and substandard quality of Paris medicinal materials appeared in Chinese traditional medicine markets. In short, it was necessary and important to trace the geographical origin of Paris medicinal materials owing to the impact of Paridis Rhizoma qualities from different cultivated regions.
Authentication studies of P. yunnanensis from different cultivated regions were based on multiple chemical analytical methods, including ultraviolet visible,11 ultra-high performance liquid chromatography-mass spectrometry,12,13 Fourier transform infrared (FTIR),13 high performance liquid chromatography,14 near infrared,15 and attenuated total reflection-Fourier transform mid infrared (ATR-FTMIR).16 These chemical methods combined with classification models can discriminate Paris medicinal materials from different cultivated regions. To obtain a better prediction ability of true geographical origin, these classification models commonly were combined with pattern recognition techniques. Pattern recognition techniques have been applied to researching of P. yunnanensis quality assessment to different extents, including unsupervised and supervised pattern recognition techniques. The unsupervised pattern recognition methods, such as principal component analysis (PCA) and hierarchical cluster analysis (HCA), were widely used.14,17,18 Supervised pattern recognition methods have also been applied to Chinese herb medicine identification research; they include partial least squares discriminant analysis (PLS-DA),11,15,19 support vector machine model20 and random forest (RF) method.16
Furthermore, classification of wild P. yunnanensis from different geographical origins commonly has been better than that of the cultivated species.11,15,16 However, these studies have not revealed the relationship between chemical profiles of different cultivation years and have not compared the identification ability for different geographical origins of P. yunnanensis samples based on different growth years. Moreover, the classification accuracy and identification ability of pattern recognition methods need to be validated prospectively as there are smaller sample numbers of P. yunnanensis in priority research. Additionally, the importance variables for establishing the identification model are not mentioned in PLS-DA model and RF model.
In this study, 789 cultivated P. yunnanensis samples from central, western, northwest, southeast and southwest Yunnan of 3rd to 8th years of cultivation were analysed by ATR-FTMIR spectroscopy. PLS-DA and RF models as classification methods were applied to differentiate the geographical origin of P. yunnanensis samples. This study focused on the geographical origin identification for cultivated P. yunnanensis samples of each year. Further, we planned to explore the differences of origin identification among the six models based on 3rd to 8th years samples, as well as to explore the differences of the most important characteristic bands selected in the establishment of PLS-DA and RF models by different growth years samples. Finally, an accurate and rapid identification model of P. yunnanensis from different habitats was selected, and there was a requirement that the model was applicable to large sample numbers of P. yunnanensis. The genetic relationship among samples was further analysed by HCA dendrograms. The research results of this study will supply a quick and reliable method for geographical origin classification analysis and quality assessment of P. yunnanensis.
Materials and methods
Samples
In this experiment, 789 cultivated P. yunnanensis samples from 3rd to 8th years were obtained from Kunming, Yuxi, Chuxiong, Baoshan, Dali, Dehong, Nujiang, Lijiang, Honghe, Wenshan, Lincang and Pu'er cities of Yunnan Province, and all cities belonging to five regions including central, western, northwest, southeast and southwest Yunnan are shown in Fig. 1. All these samples were identified as P. polyphylla Smith var. yunnanensis (Franch.) Hand.-Mazz. by Professor Hang Jin (Institute of Medicinal Plants, Yunnan Academy of Agricultural Sciences). All P. yunnanensis samples were washed and cut into thin slices, dried and crushed at 50 °C. Then all samples were sifted through 100 mesh sieves and stored in a dry environment before spectroscopy scan analysis.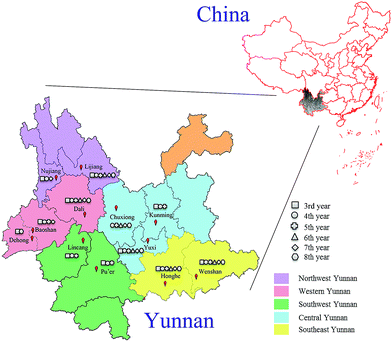 | ||
| Fig. 1 Location distribution of 3rd to 8th years cultivated P. yunnanensis samples in central, western, northwest, southeast and southwest Yunnan. | ||
ATR-FTMIR spectra acquisition
FTIR spectrometer with DTGS detector, equipped with ZnSe attenuated total reflectance accessory (Frontier Perkin Elmer, USA), was used for ATR-FTMIR analysis. The ATR-FTMIR spectra collection method was described by Wu et al.16 The ATR-FTMIR spectra recorded from 4000 to 550 cm−1 with 4 cm−1 resolution and 16 scans per each P. yunnanensis sample, which consisted of 1789 variables of raw spectral data. The scans were repeated three times. In addition, a constant temperature of 26 °C and humidity around 45% were required for the ATR-FTMIR spectral measurements. Above all, original ATR-FTMIR spectra were analysed by OMNIC (Thermo Fisher, USA), SIMCA-P+ 13.0 (Umetrics, Sweden).Chemometrics
True negative (TN) and true positive (TP) represent the correctly identified samples of positive and negative class, respectively. Similarly, false negative (FN) and false positive (FP) represent the incorrectly identified samples of positive and negative class, respectively. The sensitivity (SE) (eqn (1)) and specificity (SP) (eqn (2)) of the two parameters represent the model ability to classify samples. The higher are the accuracy (eqn (3)) and the Matthews correlation coefficient (MCC) (eqn (4)) values, the better is the model identification ability. Thus, TN, TP, FN, FP, SE, SP, accuracy and MCC of each class were the primary evaluation parameters of PLS-DA and RF models. These parameters can evaluate the identification ability of each category of a classification model.
| SE = TP/(TP + FN) | (1) |
| SP = TN/(TN + FP) | (2) |
| Accuracy = (TN + TP)/(TN + TP + FN + FP) | (3) |
 | (4) |
Results and discussion
Each cultivation year samples for geographical origin identification
In our study, different pretreatment combinations were applied to classify the five geographical origins of P. yunnanensis from 3rd to 8th years samples, respectively. The parameters and classification results of PLS-DA classification models by different preprocessing methods obtained original data and are shown in Table S1.† The best pretreatment of 5 window sizes for SG was used for data matrixes of 3rd, 4th, 6th and 7th years P. yunnanensis samples. Seven and 13 window sizes for SG were used for the matrix of 5th and 8th years samples, respectively. Apparently, the best SG of PLS-DA models of different years samples were partially different and mainly central around the 5 window sizes for SG. In the next study, PLS-DA and RF models were based on 3rd to 8th years samples of the original and the best preprocessing data, respectively. Before the construction of PLS-DA and RF models, two thirds and one third of samples were selected for the calibration set and validation set by KS algorithm in MATLAB 2017a, respectively.
![[double bond, length as m-dash]](https://www.rsc.org/images/entities/char_e001.gif) O stretching vibration, and the peak at 1645 cm−1 corresponds to C
O stretching vibration, and the peak at 1645 cm−1 corresponds to C![[double bond, length as m-dash]](https://www.rsc.org/images/entities/char_e001.gif) C and C
C and C![[double bond, length as m-dash]](https://www.rsc.org/images/entities/char_e001.gif) O stretching vibrations in oils, saccharides, steroid saponins and flavonoids.40 The peak at ∼1240 cm−1 is assigned to C–O stretching vibration. The peaks at 1154, 1079 and 1020 cm−1 are assigned to C–C and C–O stretching vibrations and C–OH bending vibration. The peak absorption at ∼925 cm−1 could correspond to sugar skeleton. Moreover, the peaks at ∼2927 cm−1, 1459 cm−1 and 1415 cm−1 are assigned to C–H stretching and bending vibrations and are mainly attributed to CH2 group. What's more, the SD spectra show more refined peaks than raw spectra in Fig. 2b. Compared with raw spectra, the absorption peaks at 1459, 1310, 1262, 1204, 1106, 995, 896, and 873 cm−1 are much more apparent in SD spectra.
O stretching vibrations in oils, saccharides, steroid saponins and flavonoids.40 The peak at ∼1240 cm−1 is assigned to C–O stretching vibration. The peaks at 1154, 1079 and 1020 cm−1 are assigned to C–C and C–O stretching vibrations and C–OH bending vibration. The peak absorption at ∼925 cm−1 could correspond to sugar skeleton. Moreover, the peaks at ∼2927 cm−1, 1459 cm−1 and 1415 cm−1 are assigned to C–H stretching and bending vibrations and are mainly attributed to CH2 group. What's more, the SD spectra show more refined peaks than raw spectra in Fig. 2b. Compared with raw spectra, the absorption peaks at 1459, 1310, 1262, 1204, 1106, 995, 896, and 873 cm−1 are much more apparent in SD spectra.
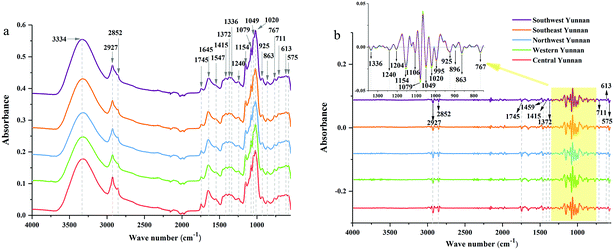 | ||
| Fig. 2 ATR-FTMIR spectra of central, western, northwest, southeast and southwest Yunnan: (a) the raw data spectra, (b) the best preprocessed spectra. | ||
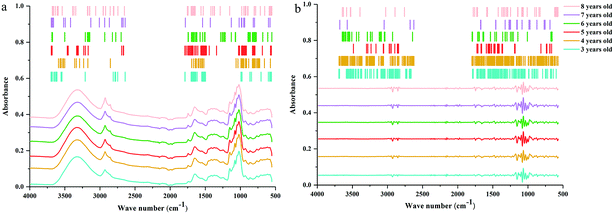
The absorption range at 3700–2620 cm−1 and 1800–550 cm−1 were significant for identifying these cultivated P. yunnanensis samples, and the other two wave numbers (4000–3700 cm−1 and 2620–1800 cm−1) belong to the range of independent variables, both in raw and SD ATR-FTMIR spectra. In our next study, all data matrixes excluded the data of the last two bands, thus, further reducing the interference of independent variables. Additionally, it also could be one operation of EDA method by analysing the ATR-FTMIR spectra. There are some fine differences between the values of absorbance and wave numbers for the common peaks of P. yunnanensis samples from different cultivated regions that are hard to distinguish. Hence, this problem can be solved by establishing discrimination models to identify the geographical origin of P. yunnanensis.
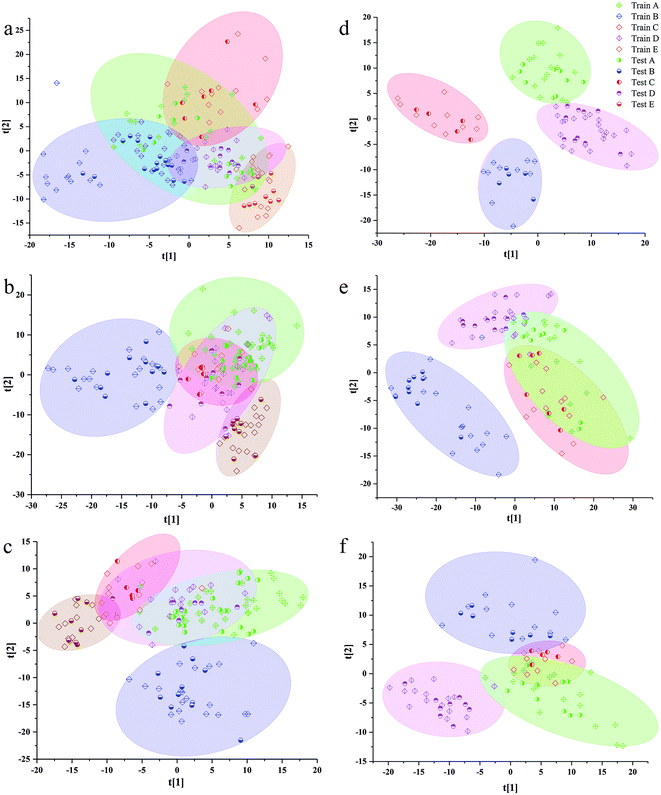
The separation effects of calibration set and validation set in scatter diagram of VIP scores based on the best preprocessing data of 3rd to 8th years samples are shown in Fig. 3. Additionally, the validation set was randomly distributed in areas of calibration, set for the same class. In all models of the samples from 3rd to 8th years, the samples from western Yunnan showed better separated effect from other cultivated regions. The samples from southeast Yunnan were confused with other regions in the scatter diagram, especially with those from northwest Yunnan and central Yunnan. The samples from northwest Yunnan were greatly confused with the samples from central Yunnan in all VIP scores. Additionally, there is some correlation between the separated effects in scatter diagrams of VIP scores, and the percentage of all information was represented by the first two LVs. The sums of the first two LVs values of the PLS-DA model based on 3rd to 8th years sample were 0.302, 0.356, 0.382, 0.562, 0.428 and 0.493. The highest LV values of VIP scores were observed for 6th year samples, which had the better separated performance in scatter diagrams of VIP scores than samples from other years.
The values of ntree and mtry of RF models were set as 2000 and square root of the number of original variables, respectively. The best ntree was selected according to the obtained OOB error values of RF models based on 3rd to 8th years samples. Additionally, the best values of mtry were selected by searching the numbers both on the left and the right with the values of square root of the number of original variables. The optimal ntree value could be selected by the lowest regions of total OOB with the OOB value of each class were lower. New RF models were established using combination between the best ntree and mtry for classifying P. yunnanensis from different cultivated regions of 3rd to 8th years. The dataset matrix of new RF models of this step was based on the important variables of each new dataset source.
The 10-fold cross validation error rates of RF model (sequentially reduced every five variables) based on 3rd year samples are shown in Fig. 4. With the change of number of variables, the 10-fold cross validation error rate values showed a tendency of increasing or decreasing, and all variables numbers can be divided into three regions. From the far-right region to the far-left region the 10-fold cross validation error rate values appeared to increase significantly. In other words, the key variables were increasingly eliminated in the regions from the left to the right. Based on the trend of 10-fold cross validation error rate, selected the lowest 10-fold cross validation error rate values in the two areas on the left, which obtained the two best important variables values matrixes, respectively. The lowest OOB value further selected by calibration of the two RF models was 235. The 10-fold cross validation error rates of RF model (sequentially reduced every five variables) established by 4th to 8th years samples are shown in Fig. S3–S7.† Similarly, the lowest OOB values, obtained by further selection of calibration set of the two RF models based on 4th to 8th year samples, were 354, 69, 69, 70 and 62.
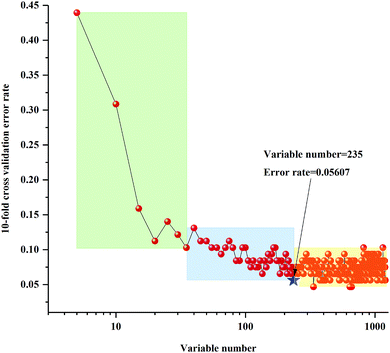 | ||
| Fig. 4 Ten-fold cross validation error rates of RF model (sequentially reduced every five variables) based on 3rd year of cultivation of P. yunnanensis samples. | ||
The anew optimal ntree and mtry were selected similarly to the primary principle. The final selected numbers (ntree) of RF model of 3rd year samples were marked between 1098 and 1239 in Fig. 5. Additionally, the final selected number (mtry) of RF model of 3rd year samples is 24, shown in Fig. 6. The final selected numbers (ntree) of RF model of 4th to 8th years samples were marked between at 127–140, 1392–1472, 450–534, 1517–1544 and 48–70, respectively, in Fig. S8–S12.† The final selected numbers (mtry) of RF model of 4th to 8th years samples are 27, 17, 12, 15 and 12, respectively, shown in Fig. S13–S17.† It was greatly different from RF models based on 3rd to 8th years cultivated P. yunnanensis samples.
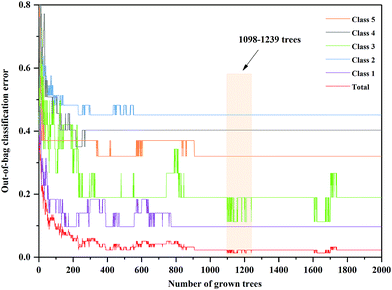 | ||
| Fig. 5 The ntree screening of RF models of 3rd year P. yunnanensis samples for variables ranked by permutation accuracy importance. | ||
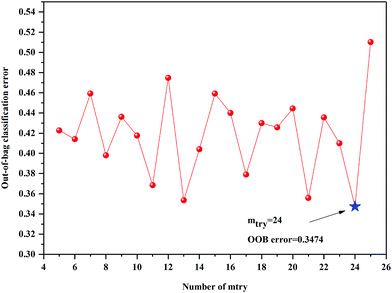 | ||
| Fig. 6 The mtry screening of RF models of 3rd year P. yunnanensis samples for variables ranked by permutation accuracy importance. | ||
What's more, Fig. 7 shows the most important variable values of the best preprocessing dataset of different RF models, based on 3rd to 8th years samples. The most important variables of RF model based on 3rd year samples were similar to those of 4th year and different from those of 5th, 6th, 7th and 8th years. This may be due to the growth of the 4th year species before P. yunnanensis began to blossom. The lowest values of important variables were those of RF model based on 7th year samples. Previous studies showed the highest total saponins content and good quality after 7th to 8th year of cultivation.10 It can be preliminarily concluded that the number of the important variables of RF model for identifying different geographical sources, established by different cultivation years, has a certain correlation with the cultivation years.
Additionally, the accuracy, SE, SP and MCC for each class of the best preprocessing spectral RF models are shown in Table S4.† The accuracy of PLS-DA geographical origin models based on 3rd to 7th years samples reached 100%. However, only the samples in central Yunnan were correctly classified by the PLS-DA model based on 8th year samples. Although the classification accuracy of the PLS-DA model among 3rd to 7th years sample was the highest, the model does not show a good classification ability in the scatter plots of Fig. 3. In the scatter plot, X axis and Y axis represent the values of LV1 and LV2, respectively. The PLS-DA model based on 6th year samples has the best separation effect in scatter plots, but the values of classification accuracy of each class are not as higher as those of 7th year. Samples from central and southeast Yunnan were misclassified by PLS-DA model based on 6th year P. yunnanensis samples. There is no clear relationship between the degree of separation of each kind of samples from different geographical sources and the accuracy of prediction and classification of each kind of samples.
The RF classification models, based on 5th to 7th years samples, demonstrated better identification ability than those for other years. The accuracy of validation set of RF model of 7th year sample was achieved to 100%. In RF models of 3rd to 5th years samples, the validation set accuracy of the samples in southwest Yunnan was 100%. Additionally, based on RF models of 4th to 7th years samples, the samples in the northwest Yunnan benefited from 100% accuracy. In the RF model of 4th to 8th years, the classification accuracy of western samples was 100%. As a whole, the prediction performance of PLS-DA model was better than that of RF model for calibration set and validation set.
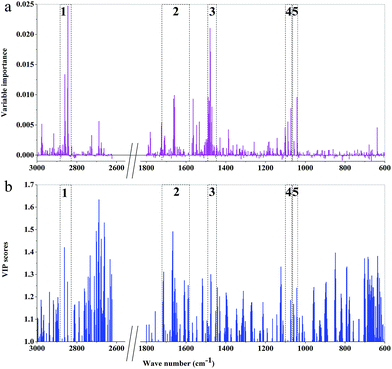 | ||
| Fig. 8 The importance variables of RF models and the VIP values of PLS-DA models of 3rd year cultivated P. yunnanensis samples: (a) RF model, (b) PLS-DA. | ||
The main important variable regions of PLS-DA or RF models were different. There were 5, 7, 7, 4, 5, and 7 major regions according to RF models of 3rd to 8th years, respectively. Additionally, the two important variable regions of peaks at 1645 and 1459 cm−1 were represented by RF models of all years, which correspond to C![[double bond, length as m-dash]](https://www.rsc.org/images/entities/char_e001.gif) C and C
C and C![[double bond, length as m-dash]](https://www.rsc.org/images/entities/char_e001.gif) O stretching vibrations, respectively, and mainly attribute to oils, saccharides, steroid saponin, flavonoids and CH2. The important variable regions of the RF model of 8th year samples almost cover the region of 1800–1000 cm−1. However, the major regions of the RF model of 7th year samples were among 1300–1000 cm−1, which were mainly attributed to saccharides, glycosides and oils. The important regions of RF model based on 6th year mainly concentrated in the 1700–1200 cm−1 region. In the RF models based on 4th and 5th years samples, the major regions were attributed to CH2 and CH3. What's more, the region of peaks at 1745 and 925 cm−1 was unique to the RF model based on 8th and 4th year, respectively. In addition, 2900–2800 cm−1 area was one of the important regions of RF models from 3rd and 8th years samples, where the position of absorption peaks was unknown.
O stretching vibrations, respectively, and mainly attribute to oils, saccharides, steroid saponin, flavonoids and CH2. The important variable regions of the RF model of 8th year samples almost cover the region of 1800–1000 cm−1. However, the major regions of the RF model of 7th year samples were among 1300–1000 cm−1, which were mainly attributed to saccharides, glycosides and oils. The important regions of RF model based on 6th year mainly concentrated in the 1700–1200 cm−1 region. In the RF models based on 4th and 5th years samples, the major regions were attributed to CH2 and CH3. What's more, the region of peaks at 1745 and 925 cm−1 was unique to the RF model based on 8th and 4th year, respectively. In addition, 2900–2800 cm−1 area was one of the important regions of RF models from 3rd and 8th years samples, where the position of absorption peaks was unknown.
The difference of important variables between RF and PLS-DA models, based on the same age samples, was also presented. It showed that the different major important variables regions were influenced by different chemical components. The chemical components and contents of the secondary metabolites are constantly changing during the growth of P. yunnanensis, which may be the main reason for the difference of the important variables regions of models established by the samples with different growth years. Additionally, comparing the important variables regions of the two models established by the sample with the same growth years, it can be found that the important variables regions of RF model were smaller than those of PLS-DA model, and the important variables are dispersed in the PLS-DA model. That is to say, more widely distributed VIP values and better classification ability and discriminant performance were obtained by PLS-DA model than by RF model.
Geographical origin identification of all samples
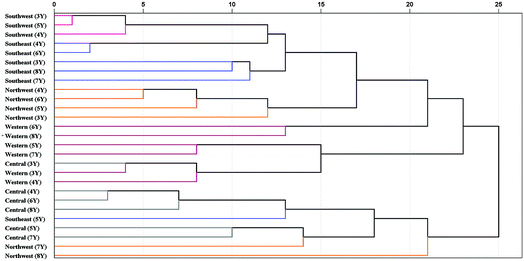 | ||
| Fig. 9 Dendrograms of HCA based on 5 geographical origins and 6 cultivation years of P. yunnanensis samples. 3Y: 3rd year, 4Y: 4th year, 5Y: 5th year, 6Y: 6th year, 7Y: 7th year, 8Y: 8th year. | ||
P. yunnanensis samples from southwest and southeast Yunnan showed a closer relationship. In addition, the samples from northwest (7th year), northwest (8th year) and southeast (5th year) of Yunnan were confused with samples from central (4th to 8th year) Yunnan in the same cluster. These samples were closer to each other, which may be the reason for the lower classification accuracy of PLS-DA model in central Yunnan. Additionally, all combinations of different geographical origins and cultivation years classes were analysed by Pearson correlation coefficient of HCA, based on the best preprocessing ATR-FTMIR spectral data that are shown in Table S7.† In general, the absolute values of Pearson correlation coefficient among different geographical origins are greater than those of different cultivation years of P. yunnanensis samples. In short, upon comparing PLS-DA and HCA, it was concluded that the effect of geographical origin on the quality of P. yunnanensis is greater than that of cultivation years.
Conclusions
Geographical origin discrimination analysis of 789 P. yunnanensis species from central, western, northwest, southeast and southwest Yunnan Province (3rd to 8th cultivation years) was carried out by PLS-DA, RF and HCA combined with ATR-FTMIR. There are different important variable ranges in different years of origin identification, which indicate that different chemical composition contributes differently to identification. Besides, the geographical origins have more influence on the P. yunnanensis medicinal properties than the cultivation years, according to HCA dendrograms. In conclusion, combining ATR-FTMIR spectra with PLS-DA models can be used as a rapid and accurate method for classification of different geographical origins from multiple cultivation years of P. yunnanensis samples.Conflicts of interest
There are no conflicts of interest to declare.Acknowledgements
This work was sponsored by National Natural Science Foundation of China (Grant number: 81460584). We would like to acknowledge the people who assisted with collection of a large number of Paris polyphylla var. yunnanensis samples used in our study.References
- C. P. Commission, Pharmacopoeia of People's Republic of China (Part I), China Medical Science Press, Beijing, 2015, p. 260 Search PubMed.
- Y. G. Yang, J. Zhang, J. Y. Zhang and Y. Z. Wang, Chin. Tradit. Herb. Drugs, 2016, 47, 3301–3323 Search PubMed.
- X. Wu, L. Wang, G. C. Wang, H. Wang, Y. Dai, X. X. Yang, W. C. Ye and Y. L. Li, Carbohydr. Res., 2013, 368, 1–7 CrossRef CAS PubMed.
- D. W. Deng, D. R. Lauren, J. M. Cooney, D. J. Jensen, K. V. Wurms, J. E. Upritchard, R. D. Cannon, M. Z. Wang and M. Z. Li, Planta Med., 2008, 74, 1397–1402 CrossRef CAS PubMed.
- P. Li, J. H. Fu, J. K. Wang, J. G. Ren and J. X. Liu, Chin. J. Integr. Med., 2011, 17, 283–289 CrossRef PubMed.
- S. J. Hwang, H. C. Lin, C. F. Chang, F. Y. Lee, C. W. Lu, H. C. Hsia, S. S. Wang, S. D. Lee, Y. T. Tsai and K. J. Lo, J. Hepatol., 1992, 16, 320–325 CrossRef CAS.
- G. X. Wang, J. Han, L. W. Zhao, D. X. Jiang and X. L. Liu, Phytomedicine, 2010, 17, 1102–1105 CrossRef CAS PubMed.
- A. B. Cunningham, J. A. Brinckmann, Y. F. Bi, S. J. Pei, U. Schippmann and P. Luo, J. Ethnopharmacol., 2018, 222, 208–216 CrossRef CAS PubMed.
- J. J. Qi, N. Zheng, B. Zhang, P. Sun, S. N. Hu, W. J. Xu, Q. Ma, T. Z. Zhao, L. L. Zhou, M. J. Qin and X. N. Li, BMC Genomics, 2013, 14, 358–371 CrossRef CAS PubMed.
- Y. Z. Wang and P. Li, Plant Growth Regul., 2018, 84, 373–381 CrossRef CAS.
- Y. G. Yang, H. Jin, J. Zhang, J. Y. Zhang and Y. Z. Wang, J. Nat. Med., 2017, 71, 148–157 CrossRef CAS PubMed.
- X. W. Dai, L. L. Feng and H. F. Li, Chin. J. Exp. Tradit. Med. Formulae, 2018, 24, 41–48 Search PubMed.
- Y. G. Yang, J. Zhang, Y. L. Zhao, J. Y. Zhang and Y. Z. Wang, Biomed. Chromatogr., 2017, 31, e3913 CrossRef PubMed.
- T. Z. Chen, F. Y. Wen, T. Zhang, Y. X. Yang, Q. M. Fang, H. Zhang and D. Xue, Chin. Tradit. Pat. Med., 2017, 39, 2345–2350 Search PubMed.
- Y. L. Zhao, J. Zhang, T. J. Yuan, T. Shen, Y. Hou, S. H. Yang, W. Li, Y. Z. Wang and H. Jin, Spectrosc. Spectral Anal., 2014, 34, 1831–1835 CAS.
- X. M. Wu, Q. Z. Zhang and Y. Z. Wang, Spectrochim. Acta, Part A, 2018, 205, 479–488 CrossRef CAS PubMed.
- S. S. Zhang, X. Liu, J. F. Wang, M. J. Yu, Z. J. Huang, Y. Liu and H. Zhang, Chin. Tradit. Herb. Drugs, 2016, 47, 4257–4263 Search PubMed.
- J. D. Xie and L. Sun, Chin. J. Pharm. Anal., 2015, 35, 1585–1590 CAS.
- J. Y. Zhang, Y. Z. Wang, Y. L. Zhao, S. B. Yang, J. Zhang, T. J. Yuan, J. J. Wang and H. Jin, Spectrosc. Spectral Anal., 2012, 32, 2176–2180 CAS.
- Y. G. Yang and Y. Z. Wang, Anal. Lett., 2018, 51, 1730–1742 CrossRef CAS.
- E. S. Magdalena, N. Agnieszka and K. Dorota, Food Sci. Nutr., 2017, 58, 1747–1766 Search PubMed.
- M. Wu, L. J. Chen, X. M. Huang, Z. Z. Zheng, B. Qiu, L. H. Guo, Z. Y. Lin, G. N. Chen and Z. W. Cai, J. Lumin., 2018, 202, 239–245 CrossRef CAS.
- X. D. Yang, G. L. Li, J. Song, M. J. Gao and S. L. Zhou, Spectrochim. Acta, Part A, 2018, 205, 457–464 CrossRef CAS PubMed.
- X. Wang, C. Esquerre, G. Downey, L. Henihan, D. O'Callaghan and C. O'Donnell, Talanta, 2018, 183, 320–328 CrossRef CAS PubMed.
- Ł. Górski, W. sordon, F. Ciepiela, W. W. Kubiak and M. Jakubowska, Talanta, 2016, 146, 231–236 CrossRef.
- L. Breiman, Random forests, Mach Learn, 2001, vol. 45, pp. 5–32 Search PubMed.
- W. Liu, C. Liu, J. Yu, Y. Zhang, J. Li, Y. Chen and L. Zheng, Food Chem., 2018, 251, 86–92 CrossRef CAS PubMed.
- T. M. Oshiro, P. S. Perez and J. A. Baranauskas, International Workshop on Machine Learning and Data Mining in Pattern Recognition, Springer, Berlin, Heidelberg, 2012 Search PubMed.
- G. B. Chen, Y. C. Wang, S. S. Li, W. Cao, H. Y. Ren, L. D. Knibbs, M. J. Abramson and Y. M. Guo, Environ. Pollut., 2018, 242, 605–613 CrossRef CAS.
- A. Amjad, R. Ullah, S. Khan, M. Bilal and A. Khan, Vib. Spectrosc., 2018, 99, 124–129 CrossRef CAS.
- Y. Li, J. Y. Zhang and Y. Z. Wang, Anal. Bioanal. Chem., 2018, 410, 91–103 CrossRef CAS.
- A. Gredilla, S. Fdez-Ortiz de Vallejuelo, J. M. Amigo, A. de Diego and J. M. Madariaga, TrAC, Trends Anal. Chem., 2013, 46, 59–69 CrossRef CAS.
- L. M. Qi, J. Zhang, H. G. Liu, T. Li and Y. Z. Wang, Int. J. Food Prop., 2017, 20, S56–S68 CrossRef CAS.
- L. J. Xie, X. Q. Ye, D. H. Liu and Y. B. Ying, Food Chem., 2009, 114, 1135–1140 CrossRef CAS.
- Z. Wu, J. Zhang, H. Jin, Y. Z. Wang and J. Y. Zhang, Spectrosc. Spectral Anal., 2017, 37, 1754–1758 CAS.
- F. R. Liu and D. J. Han, J. Chin. Med. Mater., 1992, 15(8), 40–41 Search PubMed.
- R. J. Barnes, M. S. Dhanoa and S. J. Lister, Appl. Spectrosc., 1989, 43, 772–777 CrossRef CAS.
- A. Savitzky and M. J. Golay, Anal. Chem., 1964, 36, 1627–1639 CrossRef CAS.
- S. Q. Sun, Q. Zhou and J. B. Chen, Analysis of Traditional Chinese Medicine by Infrared Spectroscopy, Chemical Industry Press, Beijing, 2010 Search PubMed.
- L. F. Yang, F. Ma, Q. Zhou and S. Q. Sun, J. Mol. Struct., 2018, 1165, 37–41 CrossRef CAS.
Footnote |
| † Electronic supplementary information (ESI) available. See DOI: 10.1039/c8ay02363h |
| This journal is © The Royal Society of Chemistry 2019 |

