
 Open Access Article
 This Open Access Article is licensed under a Creative Commons Attribution-Non Commercial 3.0 Unported Licence
Spent graphite from lithium-ion batteries: re-use and the impact of ball milling for re-use†
Jian
Peng
a,
Stefanie
Maslek
b and
Neeraj
Sharma
 *a
*a
aSchool of Chemistry, UNSW Sydney, Sydney, NSW 2052, Australia. E-mail: neeraj.sharma@unsw.edu.au; Fax: +61293856141; Tel: +61293854714
bMint Innovation, 13 Lorien Place, Auckland 2013, New Zealand
First published on 15th April 2024
Abstract
The growing demand for lithium-ion batteries over the last decade, coupled with the limited and geographically confined supply of high-quality battery-grade graphite, underscores the importance of recycling graphite from spent batteries. Ideally, recycled graphite, already optimised for battery applications, can find application in new batteries, thereby reducing environmental impact and potentially delivering excellent performance. This study focuses on assessing the electrochemical performance of as-received and ball-milled recycled graphite obtained from two distinct battery waste streams. After 100 cycles at a current of 20 mA g−1, capacities reach predominantly 313 mA h g−1 for graphite recycled from LiCoO2‖ graphite batteries and 242 mA h g−1 for those recycled from LiNixMnyCozO2 (x + y + z = 1)‖ graphite batteries. Nonetheless, there remains a noticeable disparity in electrochemical properties between recycled graphite and commercial battery-grade graphite. One additional processing step is undertaken: ball milling for different durations, to modify particle size and morphology. As a result, after 3-hour ball milling, the average capacities increased by 10.5% and 20.2% for recycled graphite derived from LiCoO2‖ graphite and LiNixMnyCozO2 (x + y + z = 1)‖ graphite batteries, respectively. This work clearly demonstrates that recycled graphite can be employed in second-life or batteries made from recycled materials and mechanochemical methods can be used to improve performance.
Sustainability spotlightGraphite is widely used in lithium-ion batteries and requires huge environmental and financial costs to produce, purify and use. We show how graphite can be effectively recycled from lithium-ion battery waste and re-used for the same application. This would allow for a more sustainable approach to realise our energy transition away from fossil fuels and potentially enable cheaper and hence more accessible batteries. Therefore, this work directly aligns with UN sustainable development goals: affordable and clean energy (SDG 7), industry, innovation, and infrastructure (SDG 9) and responsible consumption and production (SDG 12). |
1 Introduction
Due to their high energy density, relatively high operating voltage (up to 4.7 V), and good long-term stability, Li-ion batteries have gained widespread use in recent years.1 The high energy density of Li-ion batteries allows for the portability of everyday devices, including smartphones, laptops, and wearables. Moreover, the majority of electric vehicles (EVs) opt for Li-ion batteries as their power source due to their ability to offer extended travel ranges, ease of maintenance, and fast-charging capabilities.2 In addition to EVs, household and large-scale energy storage systems often use Li-ion batteries. This has resulted in a dramatic increase in the consumption of Li-ion batteries.3 For example, according to the global EV market forecasted by Canalys,4 about 13.7 million EVs will have been sold in 2023, representing 29% of the total annual car sales. This rapid expansion in Li-ion battery production highlights the need for appropriate spent battery disposal methods.A typical Li-ion battery comprises a cathode, an anode, electrolyte, a separator, and casing components. Presently, commercial cathodes encompass LiCoO2 (LCO), LiNixMnyCozO2 (NMC, x + y + z = 1), LiNi0.8Co0.15Al0.05O2 (NCA), and LiFePO4 (LFP), with the majority of anodes consisting of graphite.5 Although less than 5% of spent LIBs are thought to be recycled properly,6 the percentage is foreseen to increase when the recycling processes become more efficient, low-cost, and environmentally friendly. Unlike high-value transition metals and Li, graphite has typically been disregarded for many years. However, its value has to be seen in a different light. Graphite dominates in EV batteries accounting for the largest part, a staggering 28.1 wt%, while Li and Co only account for 3.2 wt% and 4.3 wt%, respectively.7 Furthermore, the demand for graphite is increasing to around 1.3 million metric tons this year and is expected to reach 5.7 million metric tons in 2050,8 as the battery market expands globally. Such a large-scale application of graphite necessitates both a reliable production and recycling process for high-quality graphite products.
Graphite is commonly found in nature and is a polymorph of carbon.9 Natural graphite is typically classified based on its mineral-oriented characteristics, such as vein (lump) graphite, flake graphite and amorphous graphite. Vein graphite, characterized by its high purity (>90% carbon) and well-defined crystalline form, is the ideal type directly suitable for batteries.10 However, its scarcity leads to high costs due to the limited availability of such deposits. Alternatively, flake graphite, with its widespread availability and good crystallinity, is more commonly used as a precursor to make battery-grade graphite.11 The initial process of obtaining flake graphite involves mining and extraction, which includes rock crushing to isolate graphite-rich particles, followed by separation techniques to increase the useful mineral content of ores, such as gravity separation and froth flotation.12 Various purification techniques, such as roasting, microwave treatment, and acid leaching, are employed to obtain higher-grade graphite. As an example, the roasting-leaching process involves heating the mineral at high temperatures (typically below 500 °C). During this, impurities such as silicates react with NaOH to form water-soluble alkali silicates that are removed through water-leaching. Other impurities, such as Fe and Al, can be neutralized using HCl/H2SO4. Following this process, final graphite products can attain a carbon content of 99.99%.13 It should be noted that, despite their high efficiency and consistency, these techniques remain costly and result in the production of acidic and alkaline wastewater, posing environmental concerns.
Graphite extracted by this means often features plate-like structures that are anisotropic. Anisotropic flake graphite reportedly encounters an issue with Li-ion intercalation during battery cycling. This is attributed to the majority of Li-ion intercalation occurring through the edge-plane surface, which can hamper battery capacity and reversibility. To address this problem, upgrading flake graphite to spherical graphite is necessary for commercial use.12 To obtain spheroidized graphite, at the industrial scale, typically natural graphite (NG) is pre-ground with a classifier mill, followed by the rounding process using a rounding machine such as an Alpine Particle Rounder (APP). As reported, the x50 of final products can range from 12.5–20.5 μm.14 Apart from the spheroidization, commercial graphite anodes generally have to be pre-lithiated before use in Li-ion batteries, or pre-lithiated in situ during the formation cycle. The pre-lithiation process not only compensates for the Li ion loss due to solid electrolyte interface (SEI) formation but provides a stable redox potential for the anode.15 The reaction at the graphite surface and in bulk can be described as:
| xLi+ + xe− + 6C → LixC6 | (1) |
Presently, the predominant anode material for commercial batteries comprises a mixture high-purity natural graphite obtained from the processes above and synthetic graphite. Typically, synthetic graphite is produced through the carbonization of disordered carbon, with a purity of over 98%, at extremely high temperatures (exceeding 2500 °C).16 This heat treatment induces the reorganization of disordered carbon into a layered graphite structure.17 Synthetic graphite can then be spheroidized by using a ball mill to achieve a better orientation of products.18 The type of graphite input, synthetic or natural, and their ratios used in batteries vary based on the targeted application and manufacturer. In electric vehicle or stationary applications, Li-ion battery anodes typically consist of an average composition of 65% synthetic graphite and 35% natural graphite. For electronic batteries, the ratio of synthetic to natural graphite is approximately 1![[thin space (1/6-em)]](https://www.rsc.org/images/entities/char_2009.gif) :1.19 State-of-the-art graphite can normally deliver 346.9 mA h g−1 in the initial cycle and 323.2 mA h g−1 after 400 cycles at 0.1C.20 However, its performance is rate-dependent; at higher rates, e.g., 3C, it can deliver approximately 210 mA h g−1 after 100 cycles.21
:1.19 State-of-the-art graphite can normally deliver 346.9 mA h g−1 in the initial cycle and 323.2 mA h g−1 after 400 cycles at 0.1C.20 However, its performance is rate-dependent; at higher rates, e.g., 3C, it can deliver approximately 210 mA h g−1 after 100 cycles.21
Clearly significant purification and processing is undertaken to produce anode-ready graphite, and it is optimised with a large energy cost. Therefore, recycling waste, including electrode materials, from spent batteries and re-using it to produce new or second-life batteries or even alternative products has become an active avenue for research and development in the last decade. Many of the spent electrode materials can be recovered and reused in new batteries. Recycling batteries conventionally follows a certain series of steps. Batteries are typically crushed, steel, Cu and Al from the casing and current collectors are physically separated and the resulting mass is termed black mass. This has a combination of a cathode, an anode and electrolyte. Graphite is not as widely recovered compared to transition metals, in part due to the cost, but also due to the ability to simply “remove” it from the black mass by a thermal treatment in air, converting graphite into CO2. In doing so, all the mining, purification and optimisation steps are effectively lost. The used graphite is likely to retain many of these features, e.g., spheroidized, and so can be recovered and re-used. For example, Yang et al. regenerated spent graphite materials from phone batteries by thermal treatment and an “environmentally friendly” acid leaching process. The regenerated graphite produced a relatively stable capacity of 320 mA h g−1 after 40 cycles at 0.1C.22 For further recovering the irreversible capacity, recycled graphite powders underwent coating with carbon materials.23 Chen et al. utilized pitch, a derivative of petroleum, to restore the coating layer of purified graphite. This treatment resulted in a capacity of 355 mA h g−1 after 450 cycles, accompanied by a 79% reduction in energy consumption and 90% reduction in harmful pollutant emissions.24 In a similar vein, Liu et al. combined the acid treatment with the carbon coating, followed by the 800 °C thermal treatment. This treatment yielded a recycled graphite product with a capacity of 428 mA h g−1 after 200 cycles at 0.5C.25 Other studies exploring graphite recycling are listed in Table 1.
| Number | Material source | Method | Electrochemical properties | Year | Reference |
|---|---|---|---|---|---|
| 1 | NMC black mass | Bioleaching and calcination | Specific capacity higher than 400 mA h g−1 at 100 mA g−1 with a retention of 100% after 200 cycles | 2022 | 30 |
| 2 | Spent LIB laptop batteries | Water leaching and purified by DMC washing and calcination | Specific capacity of 325 mA h g−1 at 0.1C with 75% capacity retention over 1000 cycles | 2022 | 31 |
| 3 | Spent LIB laptop batteries | Flash recycling and dilute acid treatment | Specific capacity of 325 mA h g−1 at 0.1C with 77.3% capacity retention after 400 cycles when coupled with an LFP cathode | 2022 | 32 |
| 4 | Spent LIB laptop and automotive electronics batteries | Two-stage calcination and acid leaching | Specific capacity of 173 mA h g−1 at 1C with 97.9% after 100 cycles | 2019 | 33 |
| 5 | Panasonic Li-ion MH12210 cells | Subcritical CO2 electrolyte extraction and thermal treatment | Specific capacity of 345 mA h g−1 at 0.1C with 99.8% after 100 cycles | 2016 | 34 |
Battery grade graphite requires extensive processing, ranging from mining and purification to spheriodization, which has significant energy and chemical requirements, and thus strategies to re-use processed graphite are attractive. However, the scale needs to be appropriate to meet demands and make the process commercially viable. It is noted that battery-grade graphite, whether artificial or natural, can be utilized for producing coated spherical graphite. In May 2023, the United States imported natural graphite at approximately $2135 per tonne and artificial graphite at $5464 per tonne. Specifically for battery-grade graphite, the price range in North America is estimated to be between $8700 and $10900 per tonne.26 Comparatively, the cost of graphite recycling comprises the expense of black mass ($300 per tonne, containing about 22 wt% of graphite) and processing ($100–$120 per tonne).27 Reclaimed graphite can undergo further enhancement through processes such as ball milling or spheroidization. Recycled graphite is priced at only about 20% of the cost of virgin natural graphite. Additionally, during the recycling process, valuable secondary transition metals such as Co, Ni, and Mn can also be recovered, adding to the economic viability. The recovery efficiencies for Li, Co, and graphite are reported at 99.3%, 98.1%, and 83.6%, respectively.28 The cost assessment by Gutsch is consistent with market reports, indicating that the total cost of manufacturing a new cell is around $94.5 per kW h−1. However, recycling cells via hydrometallurgy incurs costs of only $6.8 to $8.6 per kW h−1 for manufacturing, with electricity costs averaging about $0.18 per kW h−1 (in Europe), representing merely 13% of the expense of producing fresh cells.29 Considering the cost advantages of recycling based on these studies, the additional step of ball milling is unlikely to dramatically increase costs.
In this work, the electrochemical properties of recycled and ball-milled recycled graphite are evaluated from two different input sources. The impact of ball milling time and its impact on electrochemistry is determined. Key findings show that an optimal amount of ball milling time is required to produce the best electrochemical performance in terms of capacity.
2 Results and discussion
2.1 Characterization of recycled graphite
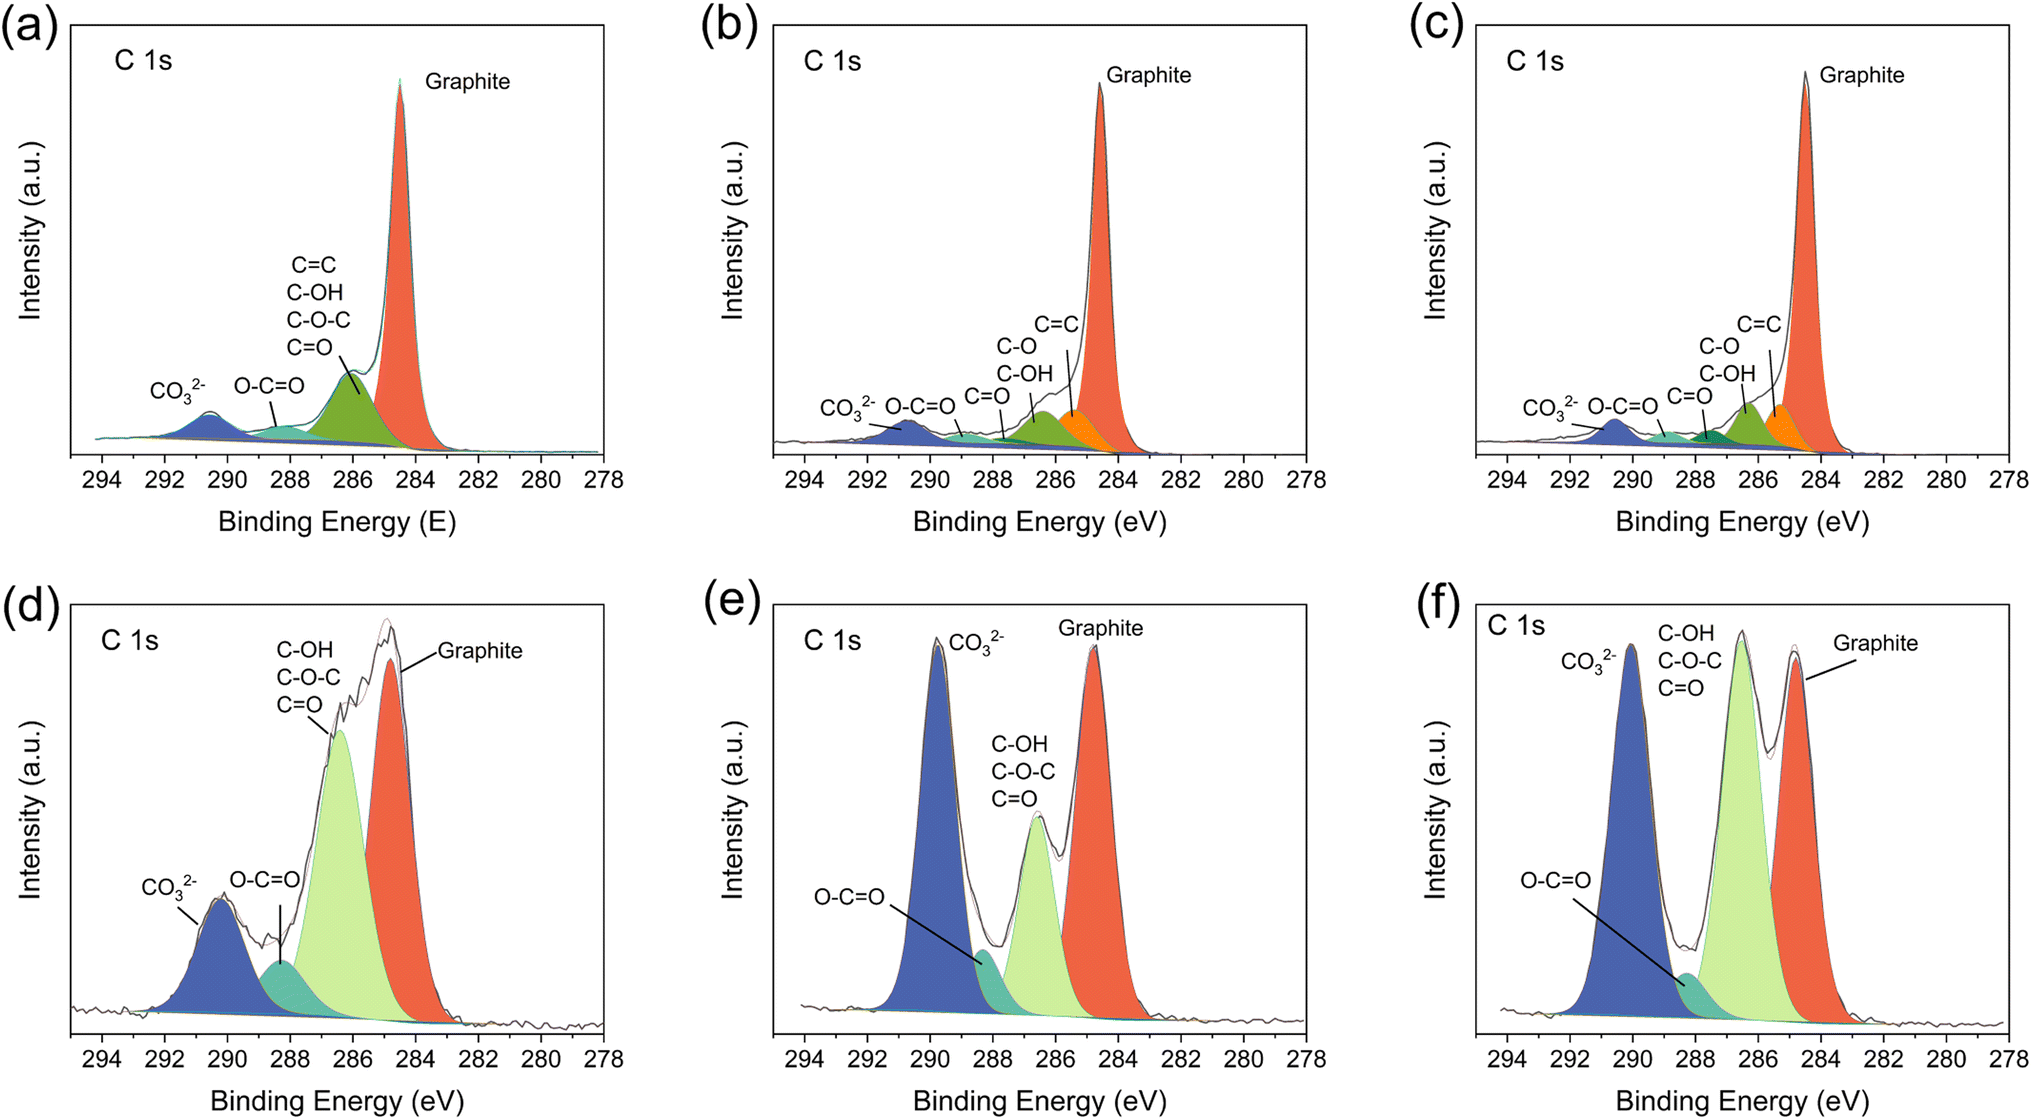
Certain contaminants, even in trace quantities, such as Co, Cu, Fe, K, Li, Mg, Mn, Na, and Ni, can significantly influence the physiochemical and electrochemical properties of graphite.35 To determine impurities in the recycled graphite powder, inductively coupled plasma mass spectrometry (ICP-MS) was employed, revealing metallic element impurities at around 0.17%. Fig. 1(a) displays the primary impurities with concentrations exceeding 5 mg kg−1. The dominant impurity in pristine recycled graphite from LiCoO2‖ graphite batteries (PRG-LCO) is Co at 1131 mg kg−1, followed by Al at 118.4 mg kg−1, Fe at 74.2 mg kg−1, and Li at 55.7 mg kg−1. This outcome is closely linked to the components of commercial lithium-ion batteries, where Li and Co form cathode compositions, as seen in LiCoO2, Al serves as the current collector and Fe is presumably from the steel casing, as it is hard for Al to be dissolved in the sulphuric acid leaching system and oxidises in the presence of hydrogen peroxide. Furthermore, as noted by Yang et al., Na (66 mg kg−1) is likely derived from the NaCl solution used for the pre-treatment.22 Al-containing impurities are also identified in X-ray diffraction (XRD) data (Fig. 1(b)), as Al2O3 at 2.9(3) wt%. The lattice parameters of Al2O3 and graphite are shown in Table S1.†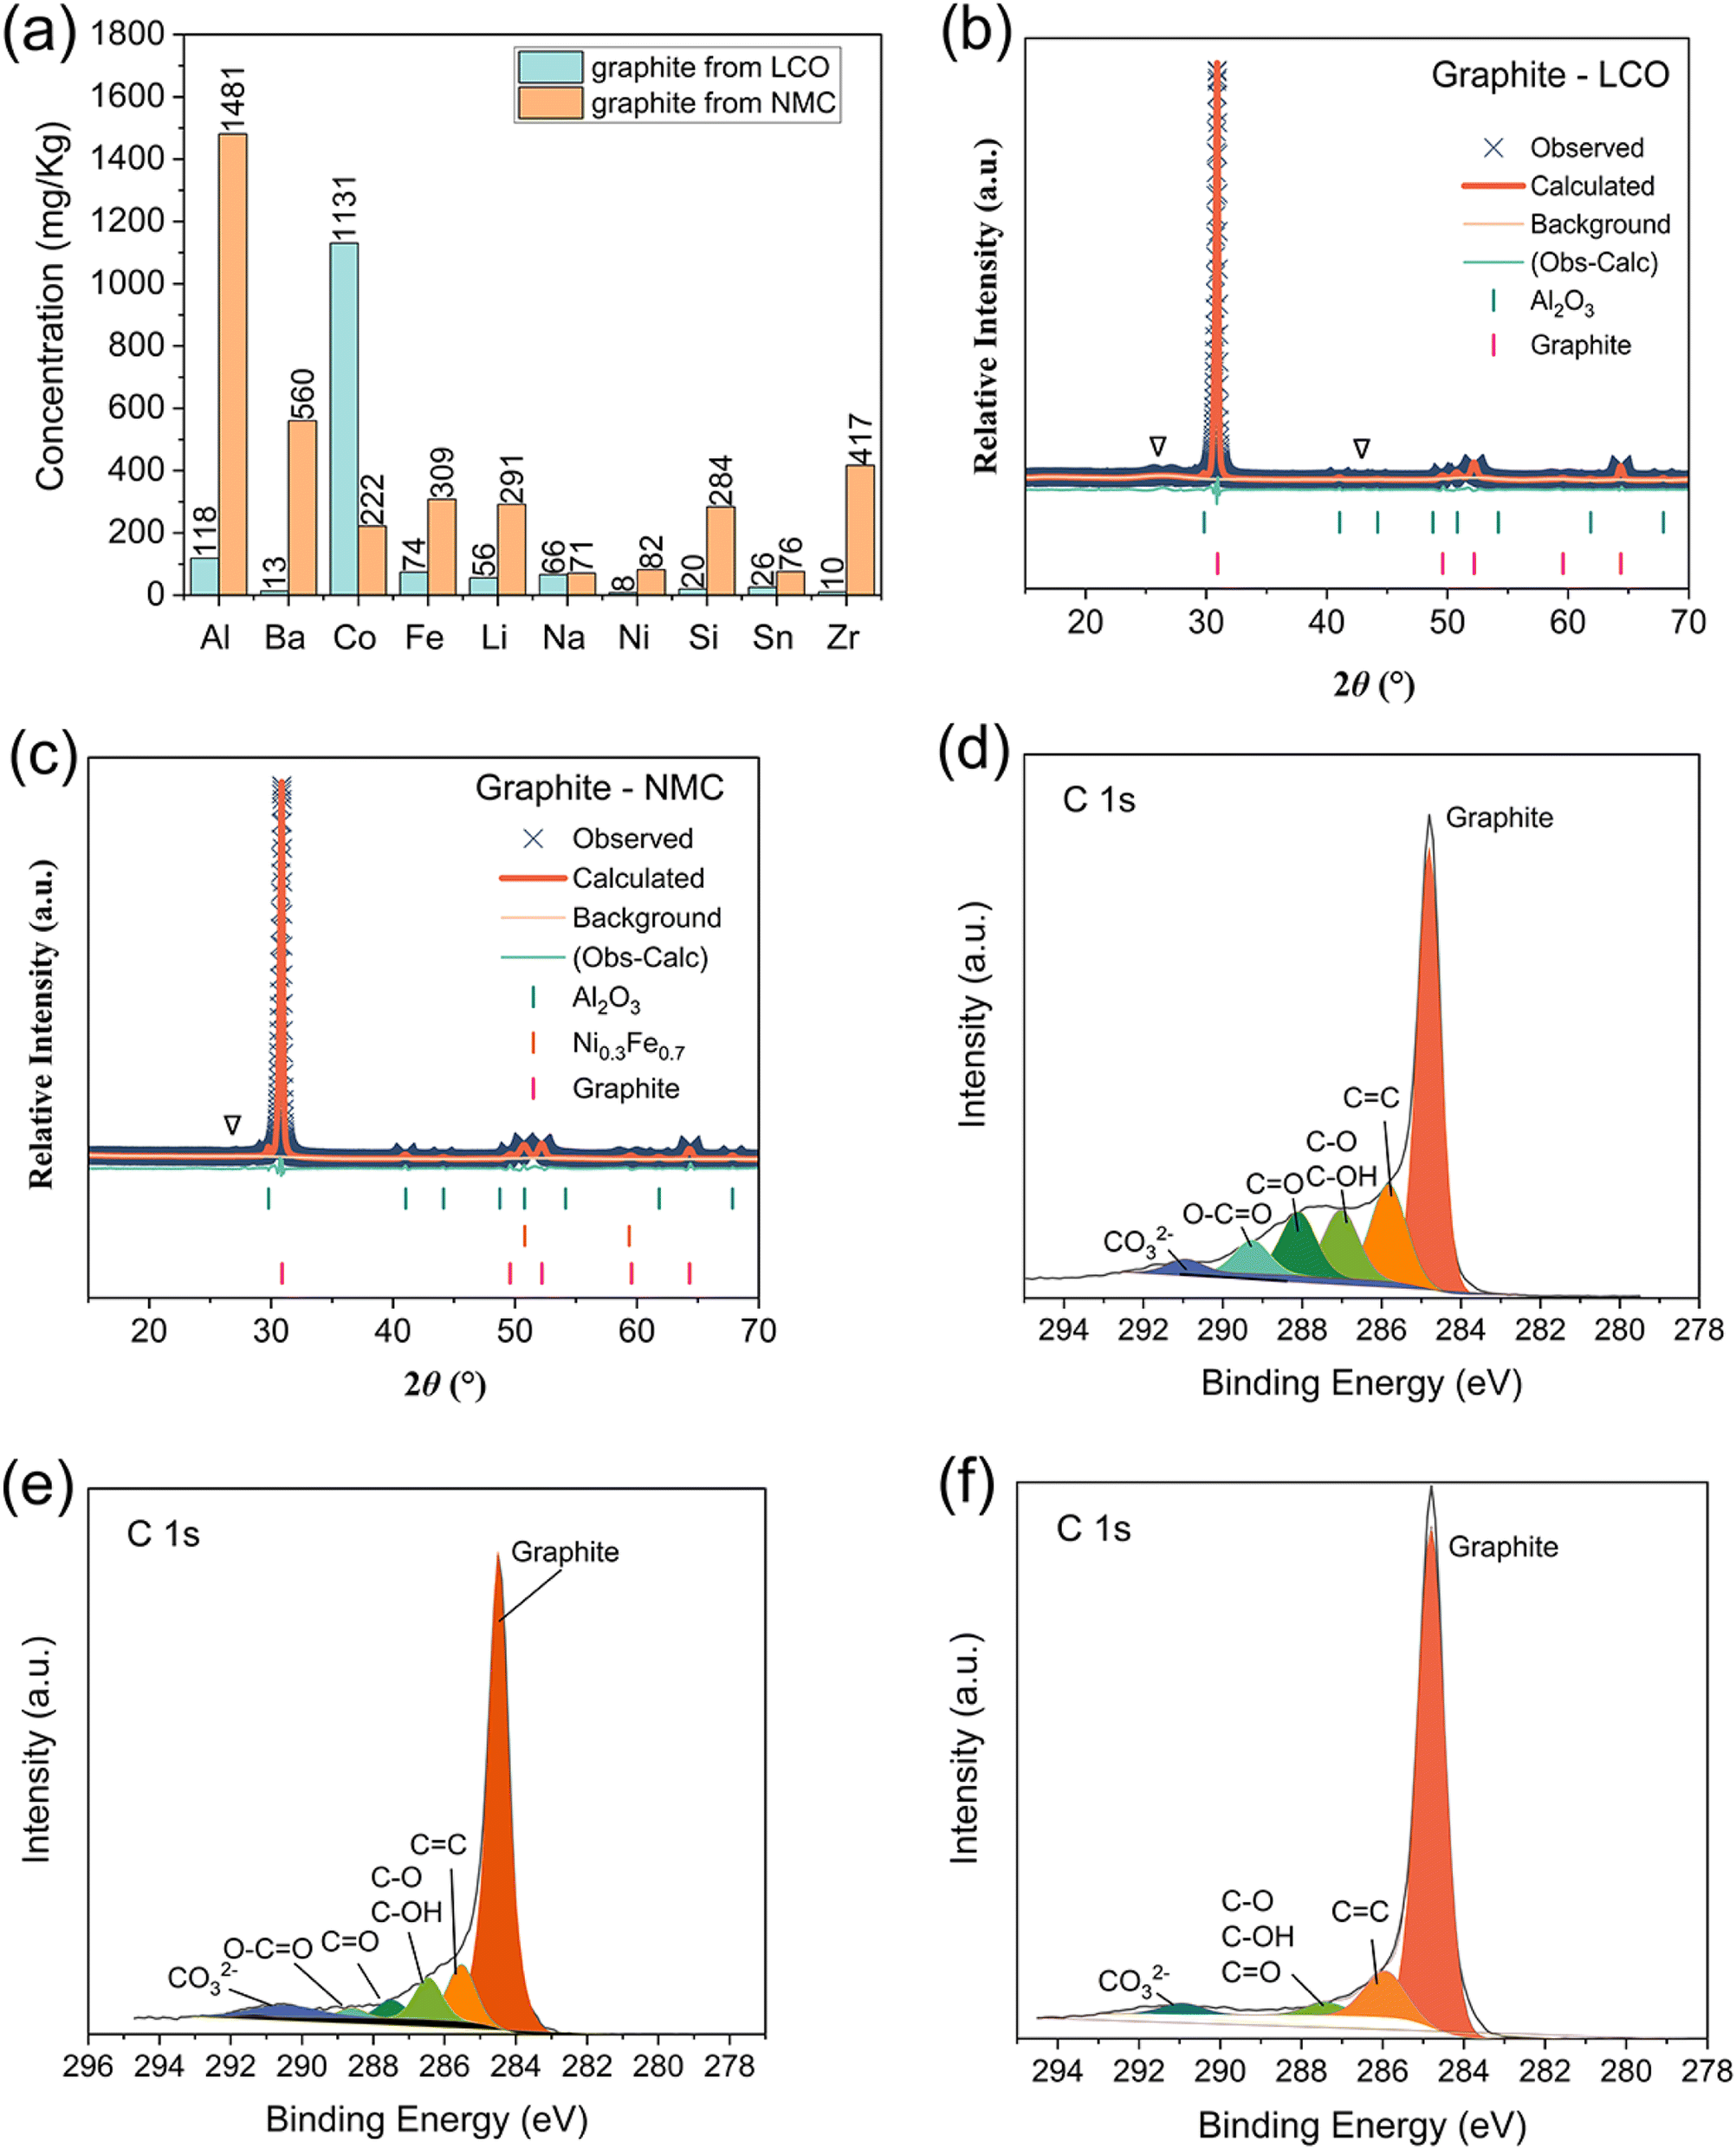 | ||
| Fig. 1 Recycled graphite powder characterisation, (a) elemental impurities with concentrations higher than 50 mg Kg−1, (b) Rietveld-refined fit of structural models with XRD data for PRG-LCO, (c) Rietveld-refined fit of structural models with XRD data for PRG-NMC, (d) fitted C 1s XPS spectra for PRG-LCO, (e) fitted C 1s XPS spectra for PRG-NMC and (f) fitted C 1s XPS spectra for commercial graphite powder (Sigma-Aldrich). Note: “∇” corresponds to unidentified peaks. | ||
In contrast, the predominant impurities in pristine recycled graphite from LiNixMnyCozO2 (x + y + z = 1)‖ graphite batteries (PRG-NMC) consist of Al at 1481 mg kg−1, Ba at 560 mg kg−1, and Zr at 417 mg kg−1, followed by Fe, Li, Si, and Co. These elements are commonly found in recycled battery materials.36–38 It's worth noting that Zr and Ba may be introduced from thermal batteries (ZrBaCrO4). Moreover, Ba has been employed as a bulking additive in lead-acid batteries to enhance reversibility under high-rate conditions.38 With the exception of Ba and Zr, the other impurity elements were similar to those found in the ICP analysis of PRG-LCO. Likewise, the XRD pattern of PRG-NMC (Fig. 1(c)) reveals the presence of impurities such as Al2O3 and possibly the alloy Ni0.3Fe0.7, whose lattice parameters are shown in Table S2.† It's worth noting that the XRD pattern contains additional unidentified peaks, denoted as ‘∇’. There was no evidence of known Co-containing phases in the XRD data, suggesting the presence of amorphous or nanoscale Co compounds. However, it's important to consider the limits of detection for XRD. In laboratory XRD, contaminants with quantities lower than 5 wt% may not be detectable especially if they are nanosized.39
To delve deeper into the surface composition, X-ray photoelectron spectroscopy (XPS) measurements were undertaken on the PRGs. In all XPS spectra, a distinct graphite peak at 284.8 eV and a satellite peak at 286 eV corresponding to the C![[double bond, length as m-dash]](https://www.rsc.org/images/entities/char_e001.gif) C bond environment are evident. Notably, the C 1s XPS spectra of recycled graphite (Fig. 1(d) and (e)) display multiple peaks spanning from 287 to 291 eV and these can be fitted to indicate the presence of C–O bonds, CO bonds, and carbonate (CO3), respectively.40 Interestingly, clear carbon–oxygen peaks are also discernible in the C 1s XPS spectra of commercial battery-grade graphite powder but to a lower intensity than the PRG (Fig. 1(f)). The presence of these oxygen functional groups implies that the surface of the PRG underwent oxidation during the recycling process or is more oxidised than the commercial battery-grade graphite powder.
C bond environment are evident. Notably, the C 1s XPS spectra of recycled graphite (Fig. 1(d) and (e)) display multiple peaks spanning from 287 to 291 eV and these can be fitted to indicate the presence of C–O bonds, CO bonds, and carbonate (CO3), respectively.40 Interestingly, clear carbon–oxygen peaks are also discernible in the C 1s XPS spectra of commercial battery-grade graphite powder but to a lower intensity than the PRG (Fig. 1(f)). The presence of these oxygen functional groups implies that the surface of the PRG underwent oxidation during the recycling process or is more oxidised than the commercial battery-grade graphite powder.
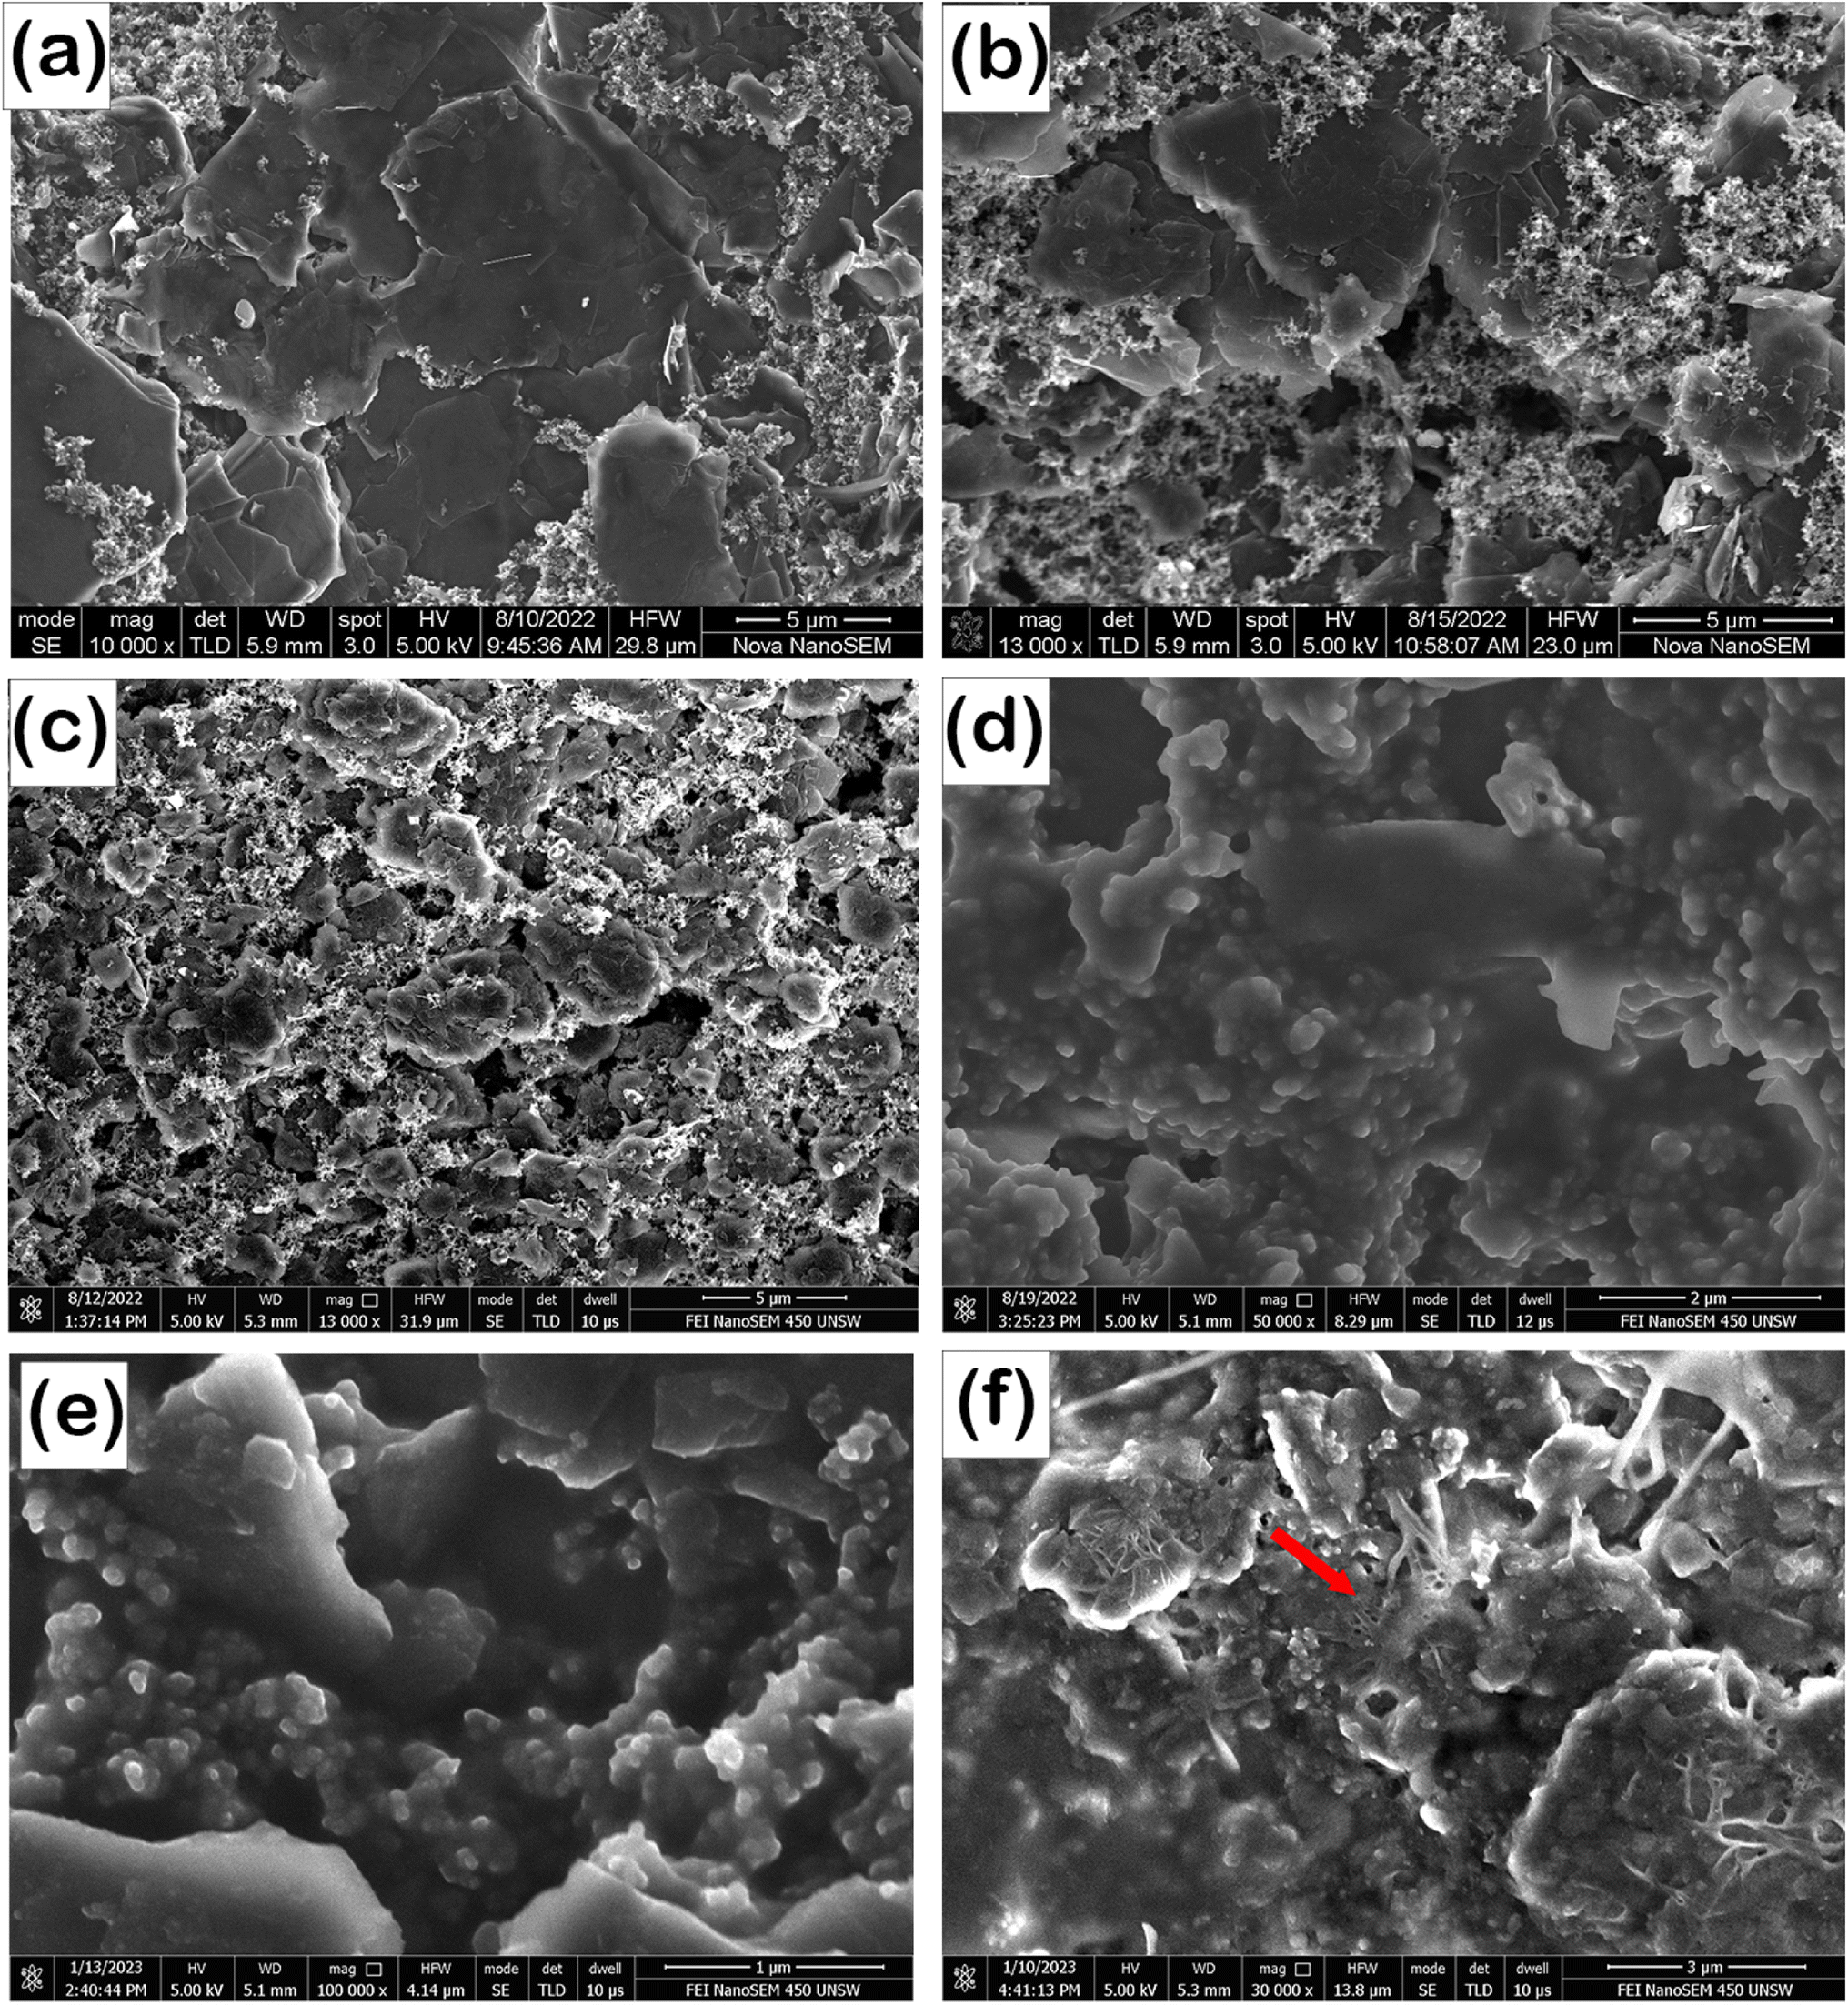
Scanning electron microscopy (SEM) images shown in Fig. 2 suggest that the optimal spheroidized graphite (battery-grade graphite) that is used in LIBs has been modified with use and the recycling/recovery process. Therefore, in order to recover the particle morphology, this work examined the impact of ball milling PRG, where two durations were used which are 3 h and 30 h and samples were denoted as PRG-LCO-3h and PRG-LCO-30h, respectively. The structural and morphological changes were examined with Raman, XRD, and SEM as shown in Fig. 2. The G and D bands in the Raman spectra (Fig. 2(a)) are found at around 1560 cm−1 and 1360 cm−1 respectively. The G band corresponds to the stretching vibration of all pairs of sp2 atoms in graphite-type layers, while the D band represents the ring breathing mode of sp2 carbon rings. The intensity of the D band indicates the presence of defects in carbon containing powders.41Table 2 presents the intensity ratio of the D band and G band (ID/IG), as well as positions of G and D peaks. In terms of PRG-LCO, the ID/IG ratio decreases from 0.20 to 0.05 after 3-hour ball milling (PRG-LCO-3h), which is close to the value of commercial graphite (Sigma-Aldrich). However, the ID/IG increases to 0.14 when ball milling is continued for 30 hours (PRG-LCO-30h). The ID/IG ratio of PRG-NMC follows a trend akin to that of PRG-LCO, decreasing from 0.21 in PRG-NMC powder to 0.03 after 3-hour ball milling, subsequently increasing to 0.17 after 30-hour ball milling. This suggests that 3-hour ball milling removes the defects in the recycled graphite. However, longer duration milling generates additional defects, possibly indicating an optimal milling time. Furthermore, it is noted that the D band and G band positions shift to lower wavenumbers after ball milling in both PRG-LCO and PRG-NMC cases. This shift is consistent with the previous work of Li et al.42 who showed that ball milling results in peak shifts in Raman data, corresponding to a more disordered carbon structure. It is however interesting to note that extended ball milling times may have additional impacts on the defect-structure and this is an area for further study.
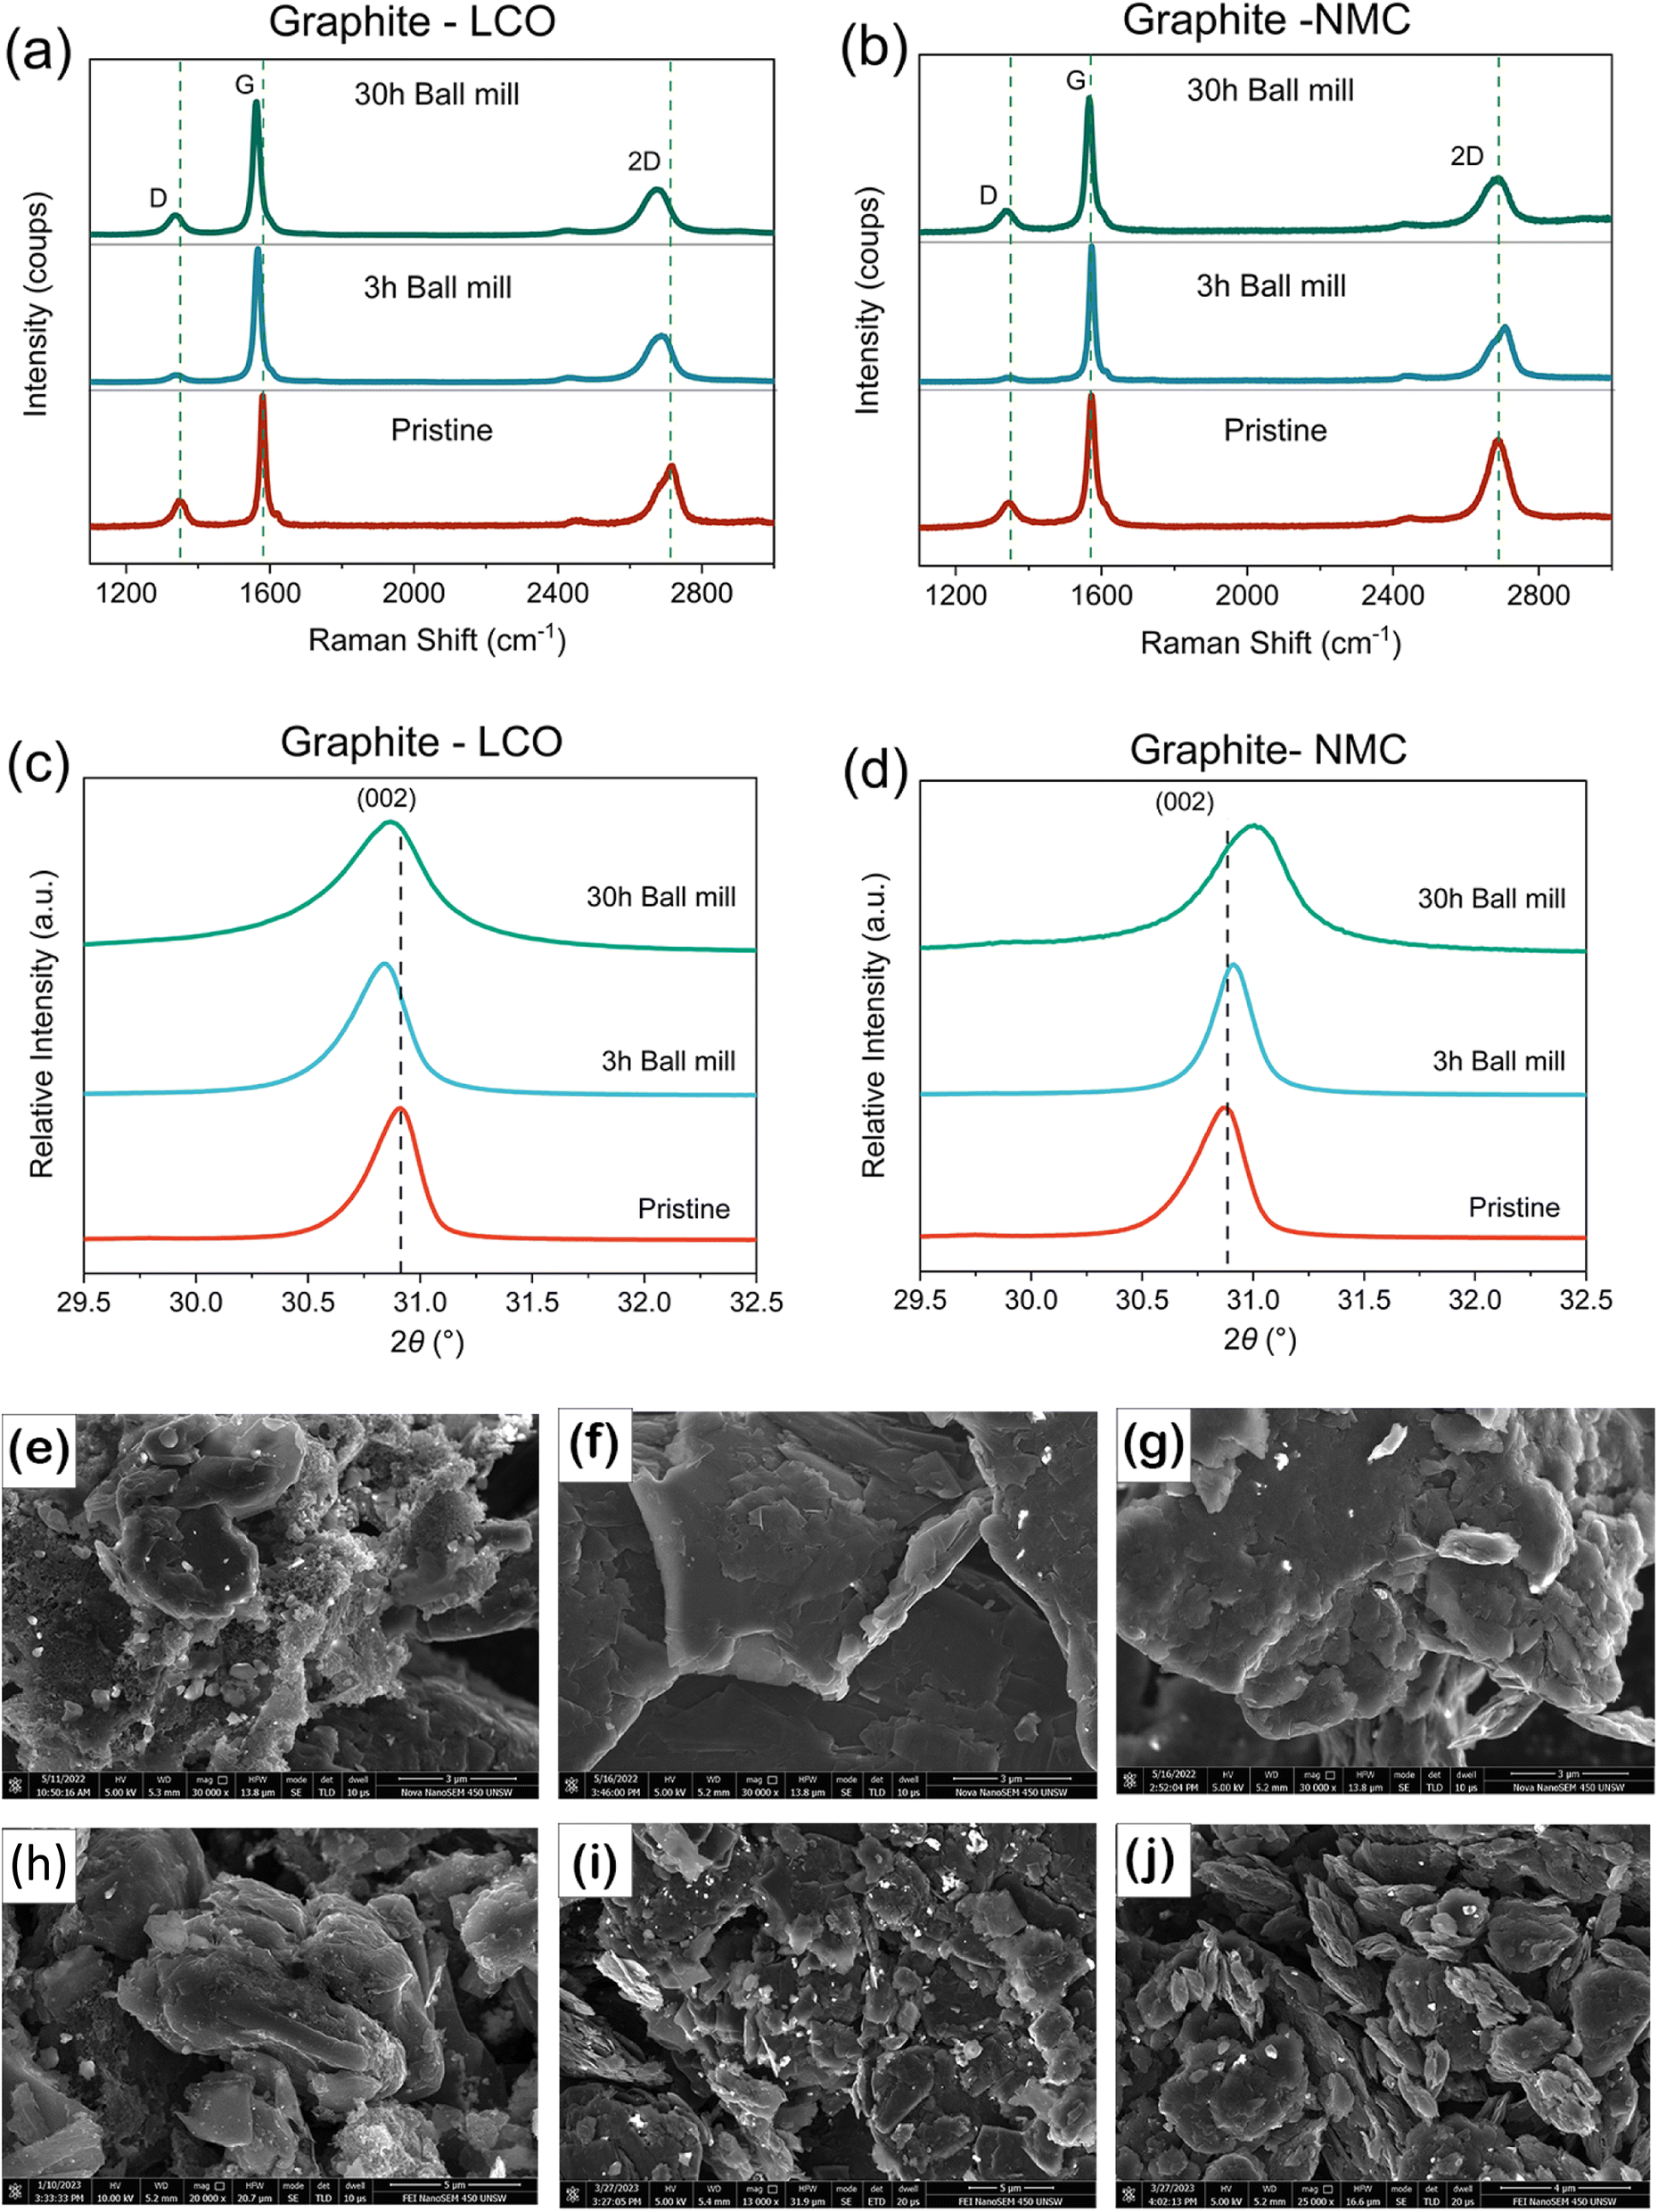 | ||
| Fig. 2 Comparison of the impact of ball milling on PRG, Raman spectra of (a) PRG-LCO and (b) PRG-NMC, (c) XRD patterns in selected 2θ regions highlighting the (002) reflection of (d) PRG-LCO and (e) PRG-NMC, microstructures of (e) PRG-LCO, (f) PRG-LCO-3h, and (g) PRG-LCO-30h, and microstructures of (h) PRG-NMC, (i) PRG-NMC-3h, and (j) PRG-NMC-30h. | ||
| Sample | I D/IG | Position D (cm−1) | Position G (cm−1) |
|---|---|---|---|
| PRG-LCO | 0.20 | 1349.4 | 1579.7 |
| PRG-LCO-3h | 0.05 | 1339.9 | 1566.1 |
| PRG-LCO-30h | 0.14 | 1337.0 | 1562.6 |
| PRG-NMC | 0.21 | 1344.6 | 1571.9 |
| PRG-NMC-3h | 0.03 | 1343.6 | 1569.3 |
| PRG-NMC-30h | 0.17 | 1340.3 | 1566.1 |
| Sigma graphite | 0.04 | 1343.8 | 1568.8 |
The XRD pattern of PRG-LCO, PRG-LCO-3h, and PRG-LCO-30h (Fig. 2(c)) shows that the (002) reflection of graphite shifts to lower 2θ values, from 30.92° to 30.85° after 3 h of ball milling and increases marginally to 30.87° after 30 h of ball milling but remains below PRG. This shows that 3 h of milling expands the stacking (c) axis of graphite while longer milling times have a slightly smaller expansion. The larger lattice parameter may suggest a more facile Li-insertion capacity. Furthermore, the impact on out-of-plane crystallite size (Lc) distribution based on XRD data can be estimated from the peak width, as shown in the equation below:43
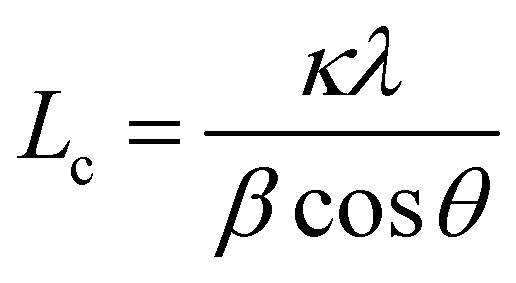 | (2) |
where Lc is the out-of-plane crystallite size, which is calculated from the full width at half maximum, β, of the (002) reflection, with κ = 0.91. There is a decreasing trend in Lc from 34 nm for PRG-LCO, to 27 nm for PRG-LCO-3h, and to 14 nm for PRG-LCO-30h, as shown in Table S3.†44 In the case of PRG-NMC samples, the (002) reflection shifts to a higher 2θ, changing from 30.88° to 30.91° after 3 h of ball milling and further to 31.00° after 30 h of ball milling. This implies that the stacking axis decreases in the case of PRG-NMC samples after the ball milling process. The Lc changes from 31 nm for PRG-NMC and to 17 nm for PRG-NMC-30h, as shown in S3. The Lc change in both PRG-LCO and PRG-NMC indicates a reduction in crystallite size distribution along this axis or a more nanocrystalline nature with ball milling.
The morphology of PRG-LCO particles before/after ball milling is shown in Fig. 2(e–g). PRG-LCO shows a combination of bar shaped and spherical structures, with a diameter ranging from approximately 14 to 20 μm (Fig. S1†). Upon closer examination, Fig. 2(e), the sample consists of stacked flakes and small agglomerated particles. The bright areas result from the electronic accumulation on the particle surface,42 which may be associated with impurities in accordance with our ICP results, Fig. 1(a). Interestingly, only flake-like layers that are smoother are observed after ball milling, as depicted in Fig. 2(f) and (g). The smoother surfaces may be achieved through centrifugal forces resulting from the rotation and abrasion between the powder and balls. In comparison to PRG-LCO-3h, PRG-LCO-30h exhibits more apparent damaged and fragmented layers, most likely a consequence of the extended ball milling time. As shown in Fig. 2(c)–(e), the morphology is highly dependent on the ball milling time and conditions. The PRG-NMC powder exhibits a similar phenomenon to PRG-LCO powder before and after ball milling, as depicted in Fig. 2(h)–(j). After ball milling, only flake-like layers remain. The main distinction is that ball milling results in relatively smaller fragmented flakes compared to PRG-LCO. The flat or flake-like morphology observed in graphite powder after the ball milling process aligns with the previously mentioned trend of Lc.
In summary, the impact of ball milling appears to be: 3-hour ball milled PRGs are less defective (based on the ID/IG ratio); both 3-hour and 30-hour ball milled PRGs are more disordered (based on the shift of the Raman peaks); both have smaller crystallite size distributions along the 002 axis (based on peak widths in the XRD data); and particle morphology is highly dependent on ball milling time (SEM images). However, certain parameters depend on the nature of samples. For example, PRG-LCO, PRG-LCO-3h and PRG-LCO-30h have a larger stacking axis (based on the 002 2θ position) compared to PRG-LCO; conversely, both the PRG-NMC-3h and PRG-NMC-30h have a smaller stacking axis compared to PRG-NMC. These parameters can be optimised in future targeted work and mechanomilling recovered/recycled LIB materials may provide an opportunity to tune physiochemical properties.
2.2 Electrochemical properties of recycled graphite
The electrochemical properties of PRG and ball-milled PRG are shown in Fig. 3. In Fig. 3(a), during the first discharge, a significant plateau is observed at around 0.75 V for PRG samples and 0.6 V for commercial battery-grade graphite. As noted in the work of An et al.,45 the organic electrolyte used in lithium-ion batteries has a reduction potential of approximately 1.0 V. This plateau implies that the electrolyte decomposes during discharging at 0.75 V or 0.6 V and forms a solid electrolyte interface (SEI) on the surface of graphite. The formation of the SEI, which consists of insoluble Li2CO3 and organic compounds such as ROLi and ROCO2Li, results in the additional consumption of lithium ions during the initial discharge cycle. The first discharge is a convolution of SEI formation and intercalation into graphite. A higher initial discharge capacity of over 400 mA h g−1 for PRG compared to a relatively lower value of 343 mA h g−1 for commercial graphite was noted. This suggests that impurities in recycled graphite may induce extra side reactions or produce subtly different SEI components, depleting more lithium ions during this initial discharge. Fig. 3(b) illustrates the cycling performance of both PRG and commercial graphite. Notably, commercial graphite exhibits a slight gradual capacity increase with the number of cycles, eventually reaching 370 mA h g−1 in the 100th cycle. In contrast, the capacity of PRG decreases during cycling. Of particular note, PRG-NMC experiences a significant decline after 35 cycles (reproducibly), with a discharge capacity of 231 mA h g−1 at the end of the 100th cycle. | ||
| Fig. 3 Electrochemical performance of PRG, PRG-3h and PRG-30h. (a) First cycle charge–discharge curves of PRG-LCO, PRG-NMC and commercial (Sigma) graphite, (b) discharge capacity versus the cycle number of selected cells, (c) and (d) first cycle and 100th cycle charge–discharge curves of PRG-LCO cells, and discharge capacity versus the cycle number of ball milled cells, (e) PRG-LCO and (f) PRG-NMC. | ||
Ball milling has modified the physiochemical properties, and consequently, a relatively higher initial discharge capacity of 451 mA h g−1 and 712 mA h g−1 for PRG-LCO-3h and PRG-LCO-30h respectively was observed. Similar capacities of 464 mA h g−1 and 722 mA h g−1 respectively were noted for PRG-NMC-3h and PRG-NMC-30h during the initial cycle. Aside from the first cycle, the subsequent cycles typically overlap, except for the gradual capacity decay with each cycle (Fig. S2†). It is interesting to note that the 30 h ball milled samples show distinctly different 1st (dis)charge profiles compared to unmilled and 3 h milled cases. Typically, the plateau at 0.8 V is longer and the charging curve shows a gradual increase in potential rather than remaining close to 0 V and then increasing rapidly at the end of charge. This is indicated by the arrows in Fig. S2(c).† This may suggest a more capacitive charge storage mechanism which would correlate with more surface area from a smaller particle size distribution as noted in the XRD data or subtly different kinetics for the intercalation reaction.
As shown in Fig. 3(e), the discharge capacity of PRG-LCO decreases to 328 mA h g−1 in the second cycle and further decreases to 292 mA h g−1 by the 100th cycle. PRG-LCO-3h maintains a capacity of approximately 360 mA h g−1, with a slight increase with each cycle until the 65th cycle. In contrast, PRG-LCO-30h exhibits relatively unstable electrochemical properties. The capacity of PRG-LCO-30h remains above 400 mA g h−1 but then fluctuates between the 50th and 100th cycles. This behaviour is noted in all PRG-LCO-30h cells tested, showing a stable decline until a certain cycle number and this is followed by larger fluctuations. In the PRG-NMC cells, PRG-NMC-3h exhibits a gradual capacity decline with the progression of cycling, while PRG-NMC-30h experiences a steeper decrease, ultimately both reaching around 310 mA h g−1 in the 100th cycle, as shown in Fig. S4.† After 100 cycles, it is evident that graphite samples subjected to 30h-ball milling exhibit a notably shorter plateau at approximately 0.1 V in comparison to their 3h-ball-milled counterparts, as illustrated in Fig. 3(d) and Fig. S4(b).† To mitigate the influence of individual battery cell differences, the average 1st and 100th discharge capacities along with their variations of PRG before and after ball milling are summarized in Fig. 4. After 100 cycles, PRG-LCO-3h shows approximately a 10.5% higher discharge capacity compared to PRG-LCO and 23.6% higher discharge capacity than PRG-LCO-30h. The error bar of PRG-LCO-30h in the 100th cycle is relatively larger, which further demonstrates variability in the cycling stability of this sample. PRG-LCO-3h appears to be significantly more stable and produces a higher capacity with cycling compared to both PRG and PRG-LCO-30h. Therefore a short ball-milling treatment appears to enhance the electrochemical performance of these recycled inputs. Likewise, in the case of PRG-NMC, 30 h ball milled cells deliver higher capacities over 100 cycles but reach a similar capacity to PRG-LCO-3h and PRG-NMC-3h of around 300 mA h g−1 in the 100th cycle. Compared to PRG-LCO-30h, PRG-NMC-30h exhibits smaller variability. It is noteworthy that, after 100 cycles, some of the PRG-LCO-30h coin cells exhibit higher capacities, approximately 320 mA h g−1, as illustrated in Fig. 3(d) and (e), while others demonstrate lower capacities at around 230 mA h g−1. This variability arises from the aforementioned side reactions (and discussed below), contributing to a substantial error bar for PRG-LCO-30 h in the 100th cycle as shown in Fig. 4.
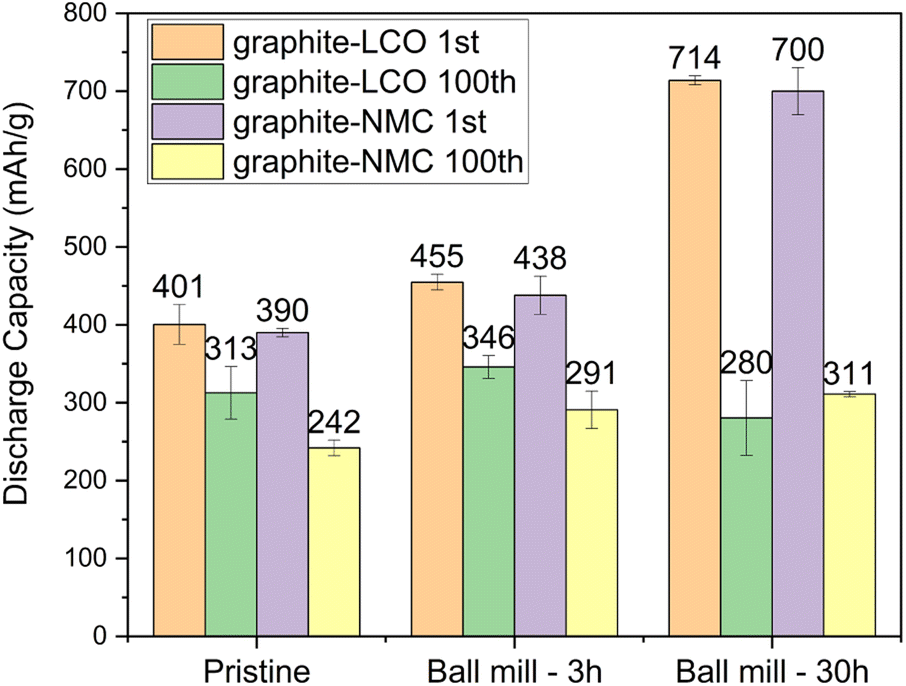 | ||
| Fig. 4 1st and 100th cycle capacity comparisons of PRG electrodes with the errors determined using identical cycling conditions. | ||
The average potential of graphite is commonly around 0.1 V as reported in numerous studies including commercial samples.46–48 The average discharge potential of PRG-LCO is 0.094 V in the first cycle and 0.099 V in the 100th cycle. For PRG-LCO-3h, the average discharge potential drops to 0.080 V in the first cycle, later stabilizing at a similar value (0.098 V) to the non-ball-milled PRG-LCO by the 100th cycle (Table 3). The voltage profile of PRG-LCO-3h (Fig. 3(c)) reveals an extended plateau at 0.1 V relative to PRG-LCO, leading to a reduction in average potential. Conversely, PRG-LCO-30h exhibits a prolonged plateau at 0.8 V instead of 0.1 V, resulting in an increase in average potential to 0.162 V in the first cycle which also decreases with cycling. These findings are consistent with previous research.49–51 In the case of PRG-NMC, ball milling time appears to increase the average potential, from 0.071 V to 0.074 V in PRG-NMC-3h and to 0.134 V in PRG-NMC-30h in the first cycle. This trend persists in the 100th cycle. This finding suggests that the ball milling process can modify the voltage profile and adjust the average potential.
| Sample name | Average potential (V) | |
|---|---|---|
| 1st cycle | 100th cycle | |
| PRG-LCO | 0.094 | 0.099 |
| PRG-LCO-3h | 0.079 | 0.098 |
| PRG-LCO-30h | 0.162 | 0.144 |
| PRG-NMC | 0.071 | 0.081 |
| PRG-NMC-3h | 0.074 | 0.096 |
| PRG-NMC-30h | 0.134 | 0.118 |
| Sigma graphite | 0.076 | 0.091 |
To further analyze the alterations on the surface of graphite electrodes with milling and electrochemical cycling, PRG-LCO cells were used as an illustrative case. The morphology of the PRG-LCO and ball-milled electrodes after 100 cycles was examined using SEM (Fig. 5). As shown in Fig. 5(b), PRG-LCO presents sphere-like deposits that could be composed of Li2CO3 and Li-alkyl carbonates as stated in the previous research.52 These deposits likely form due to the interaction between the electrolyte LiPF6 (EC/DMC = 1:1) and the surface layer of graphite. Likewise, the electrode surface of PRG-LCO-3h is covered by similar deposits. PRG-LCO-30h shows decomposition of the glass fiber (separator) and this appears to bond with the surface layers of graphite, as shown in Fig. 5(f). Structures containing glass fibre from the separator are found on the electrode surface. These structures are likely to disrupt the uniformity of the SEI layer. The growth of and interaction of the glass fibre with the graphite surface may be why the capacity drops off rapidly after a certain number of cycles. It is noted that methods to avoid glass fibre interaction as noted in Fig. 5(f) would include varying the electrolyte, pressure on the cell or employing a coating layer. Commercially, polyethylene separators are typically used and therefore the degradation of glass fibre separators may not be pertinent for such applications.
 | ||
| Fig. 5 SEM images of fresh electrodes, (a) PRG-LCO, (b) PRG-LCO-3h, and (c) PRG-LCO-30h and electrodes after 100 cycles, (d) PRG-LCO, (e) PRG-LCO-3h, and (f) PRG-LCO-30h. | ||
XPS studies of fresh and cycled electrodes were also undertaken, as shown in Fig. 6. The C 1s spectrum of the fresh PRG-LCO electrode (Fig. 6(a)) displays a narrow peak at 284.5 eV, corresponding to graphite. A satellite peak at around 285.3 eV is attributed to the carbon bonding with only C or H atoms,53 which can be identified in PRG-3h and PRG-30h patterns (Fig. 6(c) and (e)). In addition to the C–C bonds, some oxygen-containing functional groups are detected, which may come from the carbon black and the recycling procedure of graphite, i.e., from leaching or heat treatment in air during recovery. As shown in Fig. 6(a), relatively broad peaks at 286.3, 288.3, and 290.6 eV are assigned to a single carbon–oxygen, carbon connected to two-oxygen, and carbon connected to three-oxygen environments respectively.
 | ||
| Fig. 6 C 1s XPS pattern of fresh electrodes, (a) PRG-LCO, (b) PRG-LCO-3h, and (c) PRG-LCO-30h and electrodes after 100 cycles, (d) PRG-LCO, (e) PRG-LCO-3h, and (f) PRG-LCO-30h. | ||
After 100 cycles, the intensities of oxygen-containing peaks increase. This is indicative of the SEI layer, with electrolyte solvents, such as EC and/or DMC reacting to form a larger proportion of carbon–oxygen environments. For example, the SEI layer may include lithium alkyl carbonate (R–CH2–OCO2Li) and Li2CO3, as mentioned in the previous literature.54 PRG-3h shows a larger peak intensity assigned to CO32− which indicates that more Li2CO3 is formed. In the PRG-LCO-30h case not only is the CO32− intensity increased relative to PRG but the carbon to single oxygen environment is dramatically increased relative to both PRG and PRG-3h. The PRG-LCO-30h XPS spectra show a dramatic increase in all the carbon–oxygen environments. Other SEI components, such as LiF and phosphates, from the degradation of LiPF6, are identified as shown in Fig. S5.†55 On linking these results to the changes observed with SEM and electrochemistry, PRG-LCO-30 shows an increase in all the carbon-oxygen environments suggesting a larger difference in the surface layers and this may be correlated with a reduction in capacity. PRG-3h shows an increase in CO32− and PRG shows an increase in the carbon single-bonded oxygen environments with cycling. It would be good in future work to understand whether there is a key marker that can be targeted to optimise PRG performance.
Longer ball milling times result in smaller graphite particles, or in other words, a larger surface area.56 Considering the SEM and XPS results, the increase in surface area may offer more opportunities for SEI deposition, which also correlates with a higher initial discharge capacity noted in PRG-LCO-30h and a larger plateau at 0.75 V as shown in Fig. 3(c) and (e). Furthermore, as the graphite electrode undergoes roughly a 30% volume change during charge and discharge,57 the internal stress resulting from volume expansion and contraction can potentially fracture the graphite surface, generating new surface areas for SEI formation on subsequent cycles. Consequently, PRG-30h exhibits a more active surface reaction than the other two samples, illustrated by a wider variety of carbon–oxygen environments found in the XPS data after 100 cycles. It is worth noting that these reactions consume the battery's electrolyte, can disrupt the uniformity of the SEI, and ultimately lead to undesirable cycling instability again as observed for PRG-30h. In summary, an appropriate ball milling time (around 3 hours) can enhance the electrochemical properties of recovered graphite powders from spent LIBs. Further refinement of the work by adjusting ball mill speed, jar/ball media, and jar/sample ratios and the use of wet milling with various agents are promising for future work and optimisation.
3 Conclusion
Recycled graphite powders from various sources may exhibit varying compositions and electrochemical properties. Specifically, graphite recycled from LCO batteries features a lower weight ratio of impurities and demonstrates superior average discharge capacities of around 2.8% higher during the initial cycle and 29.3% higher in the 100th cycle compared to graphite recycled from NMC batteries. Nonetheless, both recycled graphite variants exhibit a notable difference in electrochemical properties when compared to commercial graphite.In the endeavor to enhance the electrochemical characteristics of recycled graphite with a single, easy-to-access step, ball milling was used for durations of 3 and 30 hours with the intention of modifying its particle size and surface properties. Assessments using Raman spectroscopy and scanning electron microscopy (SEM) confirmed the effective reduction of defects in particles while concurrently increasing their surface area as a consequence of extended ball milling. In the case of PRG-LCO, a 3-hour ball milling session substantially improved the average discharge capacity by 13.5% during the initial cycle and maintained a 10.5% higher capacity retention after 100 cycles. Conversely, in the instance of PRG-LCO subjected to 30 hours of ball milling, SEM observations revealed a significant interaction between the graphite and the glass fiber separator after 100 cycles, leading to a rapid capacity reduction. This unexpected outcome raises the possibility that the increased surface area of the graphite may trigger the decomposition of the glass fiber separator during cycling, potentially introducing safety concerns for battery applications.
In the case of PRG-NMC, an extended ball milling time (30 hours) enhances the electrochemical properties of recycled graphite. The discharge capacity is improved by 12.3% and 79.5% in the first cycle and by 20.2% and 28.5% in the 100th cycle after 3-hour and 30-hour ball milling, respectively. Notably, the optimized ball milling time may vary based on the nature of graphite powders, as revealed in this study. Interestingly, PRG-LCO-3h, PRG-NMC-3h and PRG-NMC-30h all produced very similar capacities after 100 cycles. Notably, we found that the ball milling can tune the average potential of the graphite anode. Typically, longer ball milling time leads to higher average potential. Overall, this work shows the importance of characterising single battery chemistry waste streams and the potential use of mechanomilling following graphite recovery as a means to re-use graphite in lithium-ion batteries.
4 Experimental
4.1 Powder materials preparation
Recycled graphite powders, including recycled graphite-LCO and recycled graphite-NMC, were provided by Mint Innovation.58 It is noted that recycled graphite-NMC was obtained from NMC-rich batteries provided by Environsteam59 and then processed by Mint Innovation.58 Spent batteries were found in small electronic equipment which contained LiCoO2 or LiNixMnyCozO2 (x + y + z = 1) cathodes and graphite anodes. The batteries were disassembled and black mass was extracted and processed. Both types of black mass underwent two dilute sulphuric acid with hydrogen peroxide metal leaching steps at 45 °C using 15% solids in liquid loading. The remaining unreactive graphite was separated from the liquid, washed with tap water and then dried at 60 °C overnight. Commercial battery-grade graphite powder was bought from Sigma-Aldrich.Recycled graphite powder was subjected to ball milling for various times using a Retsch PM-100 ball mill employing a zirconia grinding bowl and ϕ 10 mm zirconia balls. The ball-to-powder mass ratio was approximately 20:1, and the rotation speed was set at 400 rpm.
The choice of the two balling milling times, 3 and 30 h, was designed to examine two extremes of the ball milling process. One that is short while another that is large and times longer than 30 h are likely to be highly unfeasible for industrial uptake. Therefore, the work was designed to provide boundary conditions so that future researchers can refine their work. Further refinement of the work by adjusting ball mill speed, jar/ball media, and jar/sample ratios and the use of wet milling with various agents are promising for future work and optimisation.
4.2 Battery preparation and cycling
The electrochemical properties of recycled materials were measured using CR2032 coin cells. The electrode mixture was composed of 80 wt% active material, 10 wt% carbon black (Timcal C65), and 10 wt% polyvinylidene fluoride (PVDF, MTI). N-methyl-2-pyrrolidone (NMP, Sigma-Aldrich, 99.5%) was then added as the solvent to form a slurry. The slurry was magnetically stirred overnight. The slurry was then pasted on copper at 400 μm thickness using a doctor blade. This was then vacuum dried at 100 °C overnight. Next, the foil was pressed under 100 kN m−2 for an hour and then punched into ϕ 12 mm discs. The entire battery assembly was completed in an Ar-filled glovebox. 1 M LiPF6 in 1:1 EC/DMC (Sigma-Aldrich, 99.99%) and glass fibre (GF/F Whatman) were used as electrolyte and the separator respectively. Lithium metal (from Carnd) was used for the half cells. For electrochemical cycling, the graphite half-cells were measured between 0.01 and 3.00 V with a constant current of 20 mA g−1.
4.3 Characterization of powder materials and electrodes
Samples were characterised as powders, electrodes or cycled electrodes. For cycled electrodes, these were extracted from the coin cell under an Ar atmosphere, dried and wherever possible data were collected with air sensitive sample holders, e.g., for XRD.Inductively coupled plasma mass spectrometry (ICP- MS) was used to identify the elemental impurities present in the samples. The Raman data were obtained on an inVia Reflex Raman spectrometer using a diode laser of wavelength 532 nm. X-ray diffraction (XRD) patterns were recorded with a Panalytical Empyrean diffractometer with Cu-Kα radiation for the PRG powders and electrodes. The surface morphology of the powders and electrodes were observed with scanning electron microscopy (SEM) on an FEI Nova NanoSEM 230 and 450 operated at 5 kV. The surface composition of electrodes were analyzed by X-ray photoelectron spectroscopy (XPS), a Thermo ESCALAB250i using a monochromatic Al-Kα soft X-ray source.
Author contributions
JP: conceptualization; formal analysis; investigation; methodology; writing – original draft. NS: conceptualization; supervision; writing – review and editing. SM: methodology; writing – review and editing.Conflicts of interest
There are no conflicts to declare.Acknowledgements
The authors would like to acknowledge the support from our funding programs, the Australian Research Council, Future Fellowships, the Discovery program and the ARC Research Hub for Microrecycling of battery and consumer wastes (FT200100707, DP200100959, and IH190100009), and the China Scholarship Council (CSC) PhD scholarships and UNSW Tuition Fee Scholarship.Notes and references
- Y. Lyu, X. Wu, K. Wang, Z. Feng, T. Cheng, Y. Liu, M. Wang, R. Chen, L. Xu and J. Zhou, et al. , Adv. Energy Mater., 2021, 11, 2000982 CrossRef CAS.
- C. Yi, L. Zhou, X. Wu, W. Sun, L. Yi and Y. Yang, Chin. J. Chem. Eng., 2021, 39, 37–50 CrossRef CAS.
- J. Zhang, X. Li, D. Song, Y. Miao, J. Song and L. Zhang, J. Power Sources, 2018, 390, 38–44 CrossRef CAS.
- A. L. Jason Low, Global EV market forecasted to reach 17.5 million units with solid growth of 27% in 2024, 2024, https://www.canalys.com/newsroom/global-ev-market-2024.
- J. Wu, A. Mackenzie and N. Sharma, Green Chem., 2020, 22, 2244–2254 RSC.
- A. C. Society, Lithium Ion Battery Recycling: A Review of Current Methods and Global Development, 2022, chrome-extension://efaidnbmnnnibpcajpcglclefindmkaj/https://www.cas.org/sites/default/files/documents/%7B653f1a27-cad6-41ad-b065-c6e0bfb38ebf%7D_CASGENENGWHP100560220101-LIB_Recycling-White-Paper.pdf.
- D. Bristow, Why Graphite Could be the Next Critical Mineral to Rise Steeply in Price, https://investornews.com/critical-minerals-rare-earths/why-graphite-could-be-the-next-critical-mineral-to-rise-steeply-in-price/.
- M. R. Amrish Ritoe, Irina Patrahau, Graphite Supply chain challenges & recommendations for a critical mineral, chrome-extension://efaidnbmnnnibpcajpcglclefindmkaj/https://hcss.nl/wp-content/uploads/2022/03/Graphite-HCSS-2022.pdf.
- H. S. Lipson and A. Stokes, Proc. Roy. Soc. Lond. Math. Phys. Sci., 1942, 181, 101–105 CAS.
- F. Luque, J. Huizenga, E. Crespo-Feo, H. Wada, L. Ortega and J. Barrenechea, Miner. Deposita, 2014, 49, 261–277 CrossRef CAS.
- A. D. Jara, G. Woldetinsae, A. Betemariam and J. Y. Kim, Int. J. Min. Sci. Technol., 2020, 30, 715–721 CrossRef CAS.
- A. D. Jara, A. Betemariam, G. Woldetinsae and J. Y. Kim, Int. J. Min. Sci. Technol., 2019, 29, 671–689 CrossRef CAS.
- S. Chehreh Chelgani, M. Rudolph, R. Kratzsch, D. Sandmann and J. Gutzmer, Miner. Process. Extr. Metall. Rev., 2016, 37, 58–68 CrossRef CAS.
- B. Biber, S. Sander, J. Martin, M. Wohlfahrt-Mehrens and M. Mancini, Carbon, 2023, 201, 847–855 CrossRef CAS.
- A. Shellikeri, V. Watson, D. Adams, E. Kalu, J. Read, T. Jow, J. Zheng and J. Zheng, J. Electrochem. Soc., 2017, 164, A3914 CrossRef CAS.
- L. Zhao, Purification of Engineered Graphite for Advanced Application, 2022 Search PubMed.
- M. Wissler, J. Power Sources, 2006, 156, 142–150 CrossRef CAS.
- C. Natarajan, H. Fujimoto, A. Mabuchi, K. Tokumitsu and T. Kasuh, J. Power Sources, 2001, 92, 187–192 CrossRef CAS.
- C. Hebestreit, Experts hearing in the framework of the opinion CCMI/211 critical raw materials act, 2023, chrome-extension://efaidnbmnnnibpcajpcglclefindmkaj/https://www.eesc.europa.eu/sites/default/files/files/presentation_by_corina_hebestreit_-_ecga_on_critical_raw_materials_act.pdf.
- M. Rao, L. Zhang, L. Li, L. Rong, C. Ye, G. Zhou, H. Xu and Y. Qiu, J. Electroanal. Chem., 2019, 853, 113544 CrossRef CAS.
- I. Kottegoda, Y. Kadoma, H. Ikuta, Y. Uchimoto and M. Wakihara, Electrochem. Solid-State Lett., 2002, 5, A275 CrossRef CAS.
- J. Yang, E. Fan, J. Lin, F. Arshad, X. Zhang, H. Wang, F. Wu, R. Chen and L. Li, ACS Appl. Energy Mater., 2021, 4, 6261–6268 CrossRef CAS.
- J. Liu, H. Shi, X. Hu, Y. Geng, L. Yang, P. Shao and X. Luo, Sci. Total Environ., 2022, 816, 151621 CrossRef CAS PubMed.
- K. Chen, Y. Ding, L. Yang, Z. Wang, H. Yu, D. Fang, Y. Feng, L. Hu, C. Xu and P. Shao, et al. , Resour., Conserv. Recycl., 2024, 201, 107326 CrossRef CAS.
- K. Liu, S. Yang, L. Luo, Q. Pan, P. Zhang, Y. Huang, F. Zheng, H. Wang and Q. Li, Electrochim. Acta, 2020, 356, 136856 CrossRef CAS.
- E. Silva, North American graphite market to disconnect from Chinese prices, 2023, https://www.spglobal.com/marketintelligence/en/news-insights/latest-news-headlines/north-american-graphite-market-to-disconnect-from-chinese-prices-76963809.
- P. Curran, The Economics Around Lithium-Ion Battery Recycling Are Strong and Growing, 2021, https://glginsights.com/articles/the-economics-around-lithium-ion-battery-recycling-are-strong-and-growing/.
- J. Feng, B. Zhang, P. Du, Y. Yuan, M. Li, X. Chen, Y. Guo, H. Xie and H. Yin, Iscience, 2023, 26, 108097 CrossRef CAS PubMed.
- M. Gutsch and J. Leker, Appl. Energy, 2024, 353, 122132 CrossRef CAS.
- J. Jegan Roy, E. J. J. Tang, M. P. Do, B. Cao and M. Srinivasan, ACS Sustain. Chem. Eng., 2023, 11, 6567–6577 CrossRef CAS.
- M. Bhar, S. Ghosh, S. Krishnamurthy, K. Yalamanchili and S. K. Martha, ACS Sustain. Chem. Eng., 2022, 10, 7515–7525 CrossRef CAS.
- W. Chen, R. V. Salvatierra, J. T. Li, C. Kittrell, J. L. Beckham, K. M. Wyss, N. La, P. E. Savas, C. Ge and P. A. Advincula, et al. , Adv. Mater., 2023, 35, 2207303 CrossRef CAS PubMed.
- Y. Yang, S. Song, S. Lei, W. Sun, H. Hou, F. Jiang, X. Ji, W. Zhao and Y. Hu, Waste Manage., 2019, 85, 529–537 CrossRef CAS PubMed.
- S. Rothermel, M. Evertz, J. Kasnatscheew, X. Qi, M. Grützke, M. Winter and S. Nowak, ChemSusChem, 2016, 9, 3473–3484 CrossRef CAS PubMed.
- K. Watanabe and J. Inagawa, Analyst, 1996, 121, 623–625 RSC.
- O. A. Nasser and M. Petranikova, Batteries, 2021, 7, 60 CrossRef CAS.
- M. Beak, J. Park, S. Park, S. Jeong, J. Kang, W. Choi, W.-S. Yoon and K. Kwon, J. Hazard. Mater., 2022, 425, 127907 CrossRef CAS PubMed.
- X. Yuan, J. Hu, J. Xu, Y. Hu, W. Zhang, J. Dong, S. Liang, H. Hou, X. Wu and J. Yang, RSC Adv., 2016, 6, 27205–27212 RSC.
- C. F. Holder and R. E. Schaak, ACS Nano, 2019, 13, 7359–7365 CrossRef CAS PubMed.
- R. Blyth, H. Buqa, F. Netzer, M. Ramsey, J. Besenhard, P. Golob and M. Winter, Appl. Surf. Sci., 2000, 167, 99–106 CrossRef CAS.
- J. Hodkeiwicz, Characterizing Graphene with Raman Spectroscopy, Thermo Fisher Scientific Application Note, 2010, p. 51946 Search PubMed.
- Z. Li and Y. Zhou, Phys. B, 2010, 405, 1004–1010 CrossRef CAS.
- H. Wu, R. Gakhar, A. Chen, S. Lam, C. P. Marshall and R. O. Scarlat, J. Nucl. Mater., 2020, 528, 151802 CrossRef CAS.
- A. Milev, M. Wilson, G. K. Kannangara and N. Tran, Mater. Chem. Phys., 2008, 111, 346–350 CrossRef CAS.
- S. J. An, J. Li, C. Daniel, D. Mohanty, S. Nagpure and D. L. Wood III, Carbon, 2016, 105, 52–76 CrossRef CAS.
- M. Otero, C. Heim, E. P. Leiva, N. Wagner and A. Friedrich, Sci. Rep., 2018, 8, 15851 CrossRef PubMed.
- H. Kim, G. Yoon, K. Lim and K. Kang, Chem. Commun., 2016, 52, 12618–12621 RSC.
- Z. Shu, R. McMillan and J. Murray, J. Electrochem. Soc., 1993, 140, 922 CrossRef CAS.
- C. Wang, G. Wu and W. Li, J. Power Sources, 1998, 76, 1–10 CrossRef CAS.
- S. R. Sivakkumar, A. S. Milev and A. Pandolfo, Electrochim. Acta, 2011, 56, 9700–9706 CrossRef CAS.
- V. Ghanooni Ahmadabadi, M. M. Rahman and Y. Chen, Micromachines, 2023, 14, 191 CrossRef PubMed.
- P. Verma, P. Maire and P. Novák, Electrochim. Acta, 2010, 55, 6332–6341 CrossRef CAS.
- S. Leroy, F. Blanchard, R. Dedryvère, H. Martinez, B. Carré, D. Lemordant and D. Gonbeau, Surf. Interface Anal., 2005, 37, 773–781 CrossRef CAS.
- D. Aurbach, B. Markovsky, I. Weissman, E. Levi and Y. Ein-Eli, Electrochim. Acta, 1999, 45, 67–86 CrossRef CAS.
- R. Naejus, D. Lemordant, R. Coudert and P. Willmann, J. Fluorine Chem., 1998, 90, 81–85 CrossRef CAS.
- N. Welham, V. Berbenni and P. Chapman, J. Alloys Compd., 2003, 349, 255–263 CrossRef CAS.
- K. Dai, Z. Wang, G. Ai, H. Zhao, W. Yuan, X. Song, V. Battaglia, C. Sun, K. Wu and G. Liu, J. Power Sources, 2015, 298, 349–354 CrossRef CAS.
- Mint Innovation, 2022, https://www.mint.bio/about-us.
- Envirostream, 2024, https://envirostream.com.au/.
Footnote |
| † Electronic supplementary information (ESI) available. See DOI: https://doi.org/10.1039/d4su00094c |
| This journal is © The Royal Society of Chemistry 2024 |