Ethylenediamine modified ZnAlCu-LDO with high adsorption for phosphate†
Na
Qin
a,
Weiwei
Lin
a,
Jianhua
Chen
 *ab,
Dingling
Gao
a,
Yuxiang
Liu
a,
Yayuan
Zhang
a and
Qian
Yang
 *ab
*ab
aCollege of Chemistry, Chemical Engineering and Environment, Minnan Normal University, Zhangzhou 363000, P. R. China. E-mail: jhchen73@126.com
bFujian Province University Key Laboratory of Modern Analytical Science and Separation Technology, Minnan Normal University, Zhangzhou 363000, P. R. China
First published on 14th May 2024
Abstract
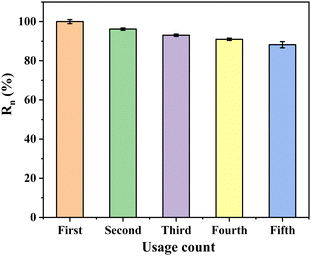
Layered double hydroxides (LDHs) have emerged as an efficient and easily prepared class of anion adsorbents, showcasing remarkable potential in the adsorption and recovery of phosphate from wastewater, notably due to their unique “memory effect” post-calcination. This study focuses on the enhancement of phosphate adsorption capabilities of ZnAl layered double hydroxides (ZnAl-LDHs), which are particularly known for their high phosphate affinity, through the incorporation of copper and subsequent modification with ethylenediamine. The resultant ZnAlCu layered trimetallic oxide (ZnAlCu-1%-LDO), post-calcination, was modified with ethylenediamine to produce a novel inorganic metal/organic amine composite adsorbent, designated as ZACen-0.5. Characterization of ZACen-0.5 demonstrated an improvement in surface hydrophilicity, alongside a notable alteration in the adsorbent's skeletal structure, which manifested as degraded granular layers, an increased pore volume, and an enhanced specific surface area. The specific surface area of ZACen-0.5 was found to be 104.61 m2 g−1, marking a 51% increase compared to ZnAlCu-1%-LDO (69.27 m2 g−1). The adsorption capacity of ZACen-0.5 for phosphate was significantly elevated to 271.00 mg P g−1, maintaining an efficiency of 88.2% over four regeneration cycles. The study elucidated the adsorption mechanism of ZACen-0.5, attributing it to monolayer and chemical adsorption processes, which involve electrostatic attraction, ligand exchange, and surface precipitation. In practical wastewater treatment, ZACen-0.5 achieved a phosphate removal efficiency of over 98% from wastewater with an initial phosphate concentration of 3.43 mg P L−1, reducing the phosphate level to 0.0531 mg P L−1, thereby surpassing the stringent first-level standard of GB 8978–1996 (0.5 mg P L−1). The findings of this research underscore the effectiveness of ethylenediamine modification of ZnAlCu-1%-LDO in significantly enhancing the phosphate adsorption efficiency of LDH-based materials, presenting a promising avenue for the development of advanced wastewater treatment technologies.
1. Introduction
Nowadays, phosphate finds extensive application across various domains of life, inevitably leading to the generation of wastewater with elevated phosphate concentrations. Furthermore, a large number of phosphates as cathode materials for lithium-ion batteries can be obtained by molten salt method.1 However, a large number of waste lithium-ion batteries also cause serious environmental pollution problems. Failure to adequately treat phosphate-containing wastewater can result in eutrophication of water bodies.2 To prevent the water quality from getting worse, reducing the concentration of phosphate in wastewater and developing effective means of phosphate recovery are of great significance. Therefore, various phosphate removal techniques have been devised, including adsorption, chemical precipitation, electrolysis, ion exchange, membrane separation, and biological treatment.3–8 However, many phosphate removal methods exhibit inherent limitations, including elevated costs and susceptibility to secondary pollution. In contrast, the adsorption technique enjoys widespread adoption due to its simplicity, cost-effectiveness, high removal efficiency, and absence of secondary pollutants.9,10The adsorption method relies on the principle of phosphate removal, wherein phosphate ions undergo physical adsorption, ligand exchange, electrostatic attraction, and surface precipitation onto the surface of a solid adsorbent. Subsequently, the enriched phosphate is separated from the sewage through solid–liquid separation processes.11 The key to phosphate removal by adsorption is the creation of adsorbents with high efficiency, high adsorption capacity, and reusability. Ideally, an adsorbent should exhibit superior adsorption selectivity, rapid adsorption kinetics, stability, absence of secondary pollution, high recyclability efficiency, and economical raw material costs.12 In wastewater treatment, commonly used phosphate removal adsorbents include natural minerals (dolomite, zeolite, montmorillonite, etc.), carbon materials (activated carbon, biochar, etc.), and synthetic materials (metal–organic frameworks, metal oxides and metal hydroxides, etc.).13–18 While natural and carbonaceous materials offer cost-effectiveness, they often require combination with metals to enhance phosphate removal efficacy. Metal–organic framework materials, a widely employed phosphate removal adsorbent, boast large specific surface areas, yet suffer from expensive synthetic processes and potential release of toxic organic ligands during adsorption, posing risks of secondary pollution to the environment.19–21 Metal hydroxides, abundant and easily obtainable in nature, present a viable alternative. Their substantial positive charge facilitates strong adsorption of phosphate anions, rendering them frequently utilized as phosphate removal adsorbents.22
A novel kind of adsorption material is layered double hydroxides (LDHs), which are widely used in various neighborhoods,23–26 especially used to remove anionic pollutants due to their rich species, controllable interlayer spacing, positive charge of laminates, and negative charge between the layers.27–29 Upon calcination within the temperature range of 200–500 °C, the LDHs undergo a transformation where hydroxyl groups are gradually eliminated as water molecules, leading to an increase in specific surface area and pore volume. At these temperatures, the material becomes an amorphous metastable mixed solid oxide.30,31 This process results in the formation of relatively stable layered double metal oxides (LDOs) exhibiting enhanced alkalinity. There is a “memory effect” with the LDOs in this state, that is LDOs can be reformed to partially restore the layered structure of LDHs in the presence of anions in an aqueous solution.32 Using this property, it is beneficial to adsorb more phosphate.
It has been observed that the adsorption capacity of LDHs with different metal compositions to phosphate differs significantly. Among these, ZnAl layered double hydroxides (ZnAl-LDHs) generally exhibit superior phosphate adsorption capabilities compared to other hydrotalcite variants.33 The common LDHs flakes have a diameter of 0.5–2 μm and a thickness of 15–20 nm.34,35 To further improve the adsorption capacity of ZnAl-LDHs, previous studies predominantly focused on the partial substitution of M3+ for Al3+, while the use of M2+ to partially replace Zn2+ for phosphate removal is rare. Jahn–Teller effect is an electronic effect describing the geometric distortion of molecules and ions, which is related to some electronic configurations. It shows that any nonlinear molecule with a spatially degenerate electron ground state will undergo geometric distortion, thereby eliminating degeneracy and reducing energy. This distortion is usually observed in the octahedral complex, and the d-orbital theoretical electron number of Cu2+ is 9, which can cause the Jahn–Teller effect. Therefore, our research group has carried out relevant modification work, producing ZnAlCu layered trimetallic oxide (ZnAlCu-1%-LDO) to enhance the phosphorus removal efficiency of ZnAl hydrotalcite by utilizing the “Jahn–Teller effect” of Cu2+ and the “memory effect” of LDHs.36 Upon replacing a portion of Zn2+ with Cu2+ in ZnAl hydrotalcite-like layers, a fraction of the Zn–O octahedra transforms into elongated Cu–O octahedra, resulting in reduced layer regularity and crystallinity. Consequently, hydroxyl ligands on the layers become more susceptible to phosphate exchange. This deformation of the layers not only enlarges the interlayer space, facilitating easier penetration of phosphate ions, but also enhances surface irregularity, thereby augmenting specific surface area and significantly increasing phosphate adsorption sites.
Surface modification and enhancement of specific surface area are effective means to improve the adsorption capacity of ZnAlCu-1%-LDO. Recent investigations elucidate that the introduction of ethylenediamine onto the surfaces of transition metal substrates engenders novel surface states. Specifically, the incorporation of amino functionalities significantly enhances hydrophilicity, as documented in literature.37–39 In addition, the strong bonding between ethylenediamine and metal can destroy the unstable metal–organic ligand bonds in metal–organic frameworks (MOFs), increasing the specific surface area and making the surface rough. Vrtovec et al. experiment indicated that after ethylenediamine modification, the Cu-based metal organic framework (copper 1,3,5-benzenetricarboxylate, HKUST-1) crystal skeleton was partially degraded to form a microporous/mesoporous system, which improved the specific surface area and diffusion adsorption of HKUST-1 adsorbate.40 Other transition metal MOFs (Cu-BTTri, Ni-MOF-74, Co-MOF-74, Zn-MOF-74) also exhibit affinity towards ethylenediamine,41,42 substantially boosting their adsorption potential for diminutive gas molecules (such as CO, SO2, CO2etc.) Ethylenediamine can not only provide amino functional groups for the adsorbent, but also enhances its hydrophilicity. Even the metal–ligand link with modest binding force can be destroyed by the strong bonding impact of ethylenediamine and the metal on the surface of the adsorbent, thereby increasing the specific surface area and inducing surface roughening. Consequently, employing ethylenediamine-modified hydrotalcite as an adsorbent adeptly fulfills both criteria of amino modification and specific surface area augmentation, underscoring its utility in advanced adsorption applications.
In this study, we synthesized an inorganic-metal–organic amine composite adsorbent, denoted as ZACen-0.5, through the modification of ZnAlCu layered trimetallic oxide (ZnAlCu-1%-LDO), itself derived from the calcination of copper-doped ZnAl-LDHs, utilizing ethylenediamine as a modifying agent. The surface transition metals (Zn and Cu) within ZnAlCu-1%-LDO react with ethylenediamine, engendering novel surface conditions that significantly enhance the hydrophilicity of ZACen-0.5, thereby promoting its homogeneous dispersion in aqueous environments. Concurrently, the protonation of amino groups under acidic environments augments the surface positive charge on ZACen-0.5, improving its electrostatic interactions with phosphate ions. Most importantly, ethylenediamine modification leads to the partial decomposition of the hydrotalcite framework into a granular layer structure, resulting in an expanded specific surface area and pore volume. This transformation escalates the availability of adsorption sites and facilitates the diffusion adsorption of phosphate ions. Comparative analysis reveals that ZACen-0.5 exhibits superior adsorption capacity relative to its precursor, ZnAlCu-1%-LDO, underscoring the effectiveness of ethylenediamine modification in enhancing adsorbent performance.
2. Experimental section
2.1. Materials and characterization
The relevant materials and instruments used in this experiment are shown in the ESI† Text S2.2.2. Synthesis of ZACen-0.5 adsorbents
CuZnAl-1%-LDO was modified by ethylenediamine using a solvothermal method. The detailed synthesis process of CuZnAl-1%-LDO is described in the ESI† Text S2, with Fig. S1 (ESI†) illustrating the preparation process. Firstly, 200 mg of ZnAlCu-1%-LDO was introduced into 20 mL of ethylenediamine. Following ultrasonic dispersion to ensure homogeneity, the mixture was subjected to heating at 120 °C for 30 minutes within an oil bath, with continuous agitation provided by magnetic stirring. Subsequent to the solvothermal treatment, the mixture was allowed to cool to ambient temperature and then centrifuged at 6000 rpm to facilitate the collection of the precipitate. The precipitate was washed with ethanol to remove residual ethylenediamine adhering to the adsorbent's surface. The final step involved drying the washed precipitate at 60 °C in a forced-air drying oven, yielding the ethylenediamine-modified ZnAlCu-1%-LDO, designated as ZACen-0.5.2.3. Adsorption phosphate removal experiment
3. Results and discussion
3.1. Characterization
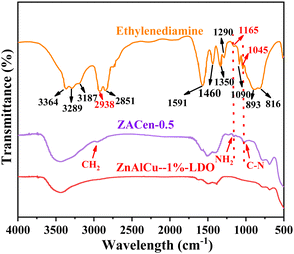
Compared with ZnAlCu-1%-LDO, the infrared spectrum of ZACen-0.5 exhibits additional absorption peaks at 2961 cm−1, 1165 cm−1 and 1045 cm−1. Among these, the absorption peak at 2961 cm−1 is attributed to the stretching vibration of –CH2 groups, which shifts to higher frequencies compared to the stretching vibration frequency of –CH2 in ethylenediamine. The stretching vibration of C–N is represented by the absorption peaks at 1045 cm−1 and 1165 cm−1, respectively, which are associated with ethylenediamine, indicating that ethylenediamine has been successfully modified on the ZACen-0.5 adsorbent. Furthermore, upon modification with ethylenediamine, the absorption bands in the regions of 3600–3100 cm−1, 1700–1300 cm−1, and 900–600 cm−1 exhibit broadening, possibly due to the overlap of infrared absorption peaks from the ethylenediamine group with the original infrared absorption peaks of the adsorbent.
3.2. Research on adsorption
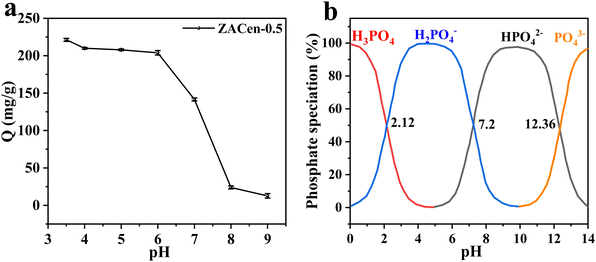 | ||
| Fig. 6 (a) The impact of initial pH value on phosphate adsorption performance of ZACen-0.5; (b) the existence forms of phosphate under different pH values. | ||
(1) Phosphate exists in different forms depending on the pH of the solution. According to Fig. 6b, the primary form of phosphate was H2PO4− in a pH range of 3.5 to 6,49 and H2PO4− was easier to adsorb than HPO42− due to lower adsorption free energy.50 When pH > 6, H2PO4− gradually transformed into HPO42−, resulting in decreased adsorption capacity.
(2) The Zeta potential of the adsorbent is different with the different pH of the solution. According to Zeta potential analysis, the pHPZC of ZACen-0.5 is 9.90. When pH < 9.90, ZACen-0.5 has a positively charged surface that can attract negatively charged phosphate ions via electrostatic interaction. However, as the solution pH increases, the positive charge on the surface diminishes, leading to reduced phosphate ion adsorption capacity.
(3) The pH of the solution affected the concentration of OH−. The concentration of OH− increased as the solution pH increased. If the pH is greater than 6, the adsorption capacity of ZACen-0.5 to phosphate sharply reduced. This may be attributed to OH− and phosphate competitive adsorption on the surface of ZACen-0.5.
The thermodynamic properties of ZACen-0.5 were determined by three thermodynamic data: ΔS, ΔH and ΔG. Through the van't Hoff plot of ln(qe/Ce) to 1/T, Fig. S7b (ESI†) can be obtained. According to the slope and intercept of the fitted line, it is possible to calculate ΔH and ΔS and to derive ΔG.51
As determined by the thermodynamic parameter calculations in Table S2 (ESI†), ΔG < 0, and with a rise in temperature, the |ΔG| value drops, indicating that the adsorption process is spontaneous and the temperature rise is not conducive to the reaction. ΔH < 0 signifies an exothermic reaction during the adsorption process, and adsorption is not facilitated by raising the temperature.52 ΔS < 0, showing that solid–liquid interface confusion increases, which is not conducive to adsorption.53
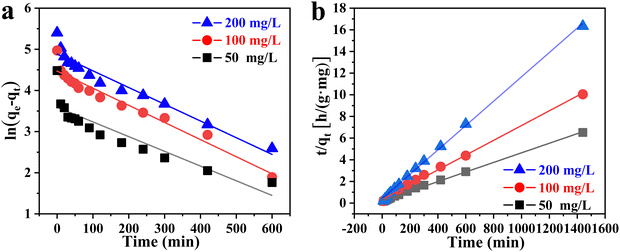
Fig. 8 displays the fitting curve for the adsorption kinetics. The adsorption process was fitted by pseudo-first-order and pseudo-second-order kinetic equations, respectively. The fitting parameters are depicted in Table S3 (ESI†). Compared with the pseudo-first-order kinetic fitting curve, the R2 value of the pseudo-second-order kinetic fitting curve is closer to 1, and the theoretical adsorption capacity is closer to the actual adsorption capacity. Therefore, the phosphate adsorption by ZACen-0.5 is better described by the pseudo-second-order kinetic model, indicating the main role in the adsorption process is chemical adsorption.
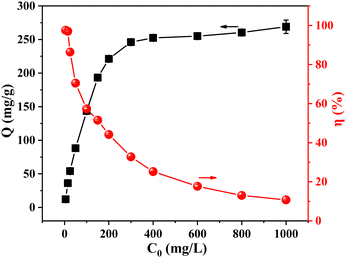
Fig. S8 and Table S4 (ESI†) are the fitting findings for the Langmuir model and the Freundlich model, respectively. Compared to the R2 value of the Freundlich model (0.9538), the R2 value of the Langmuir model was 0.9985, indicating that the adsorption process of the adsorbent to phosphate was more in line with the Langmuir model, and monolayer adsorption was the primary type of adsorption that occurred. The saturated adsorption capacity, which was determined to be 271.0 mg P g−1, was comparable to the adsorption capacity at C0 = 1000 mg P L−1 (269.03 mg P g−1). In addition, ZACen-0.5 showed superior adsorption capacity compared to reported adsorbents (Table S5, ESI†). The 1/n value obtained by Freundlich model fitting is 0.3345, which is between 0.1 and 0.5, indicating that ZACen-0.5 is easy to adsorb phosphate.54
3.3. Adsorption mechanism
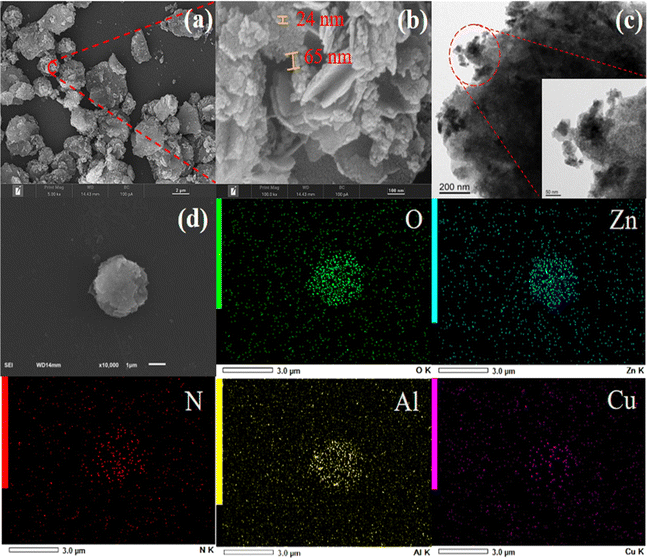
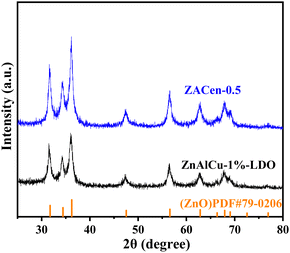
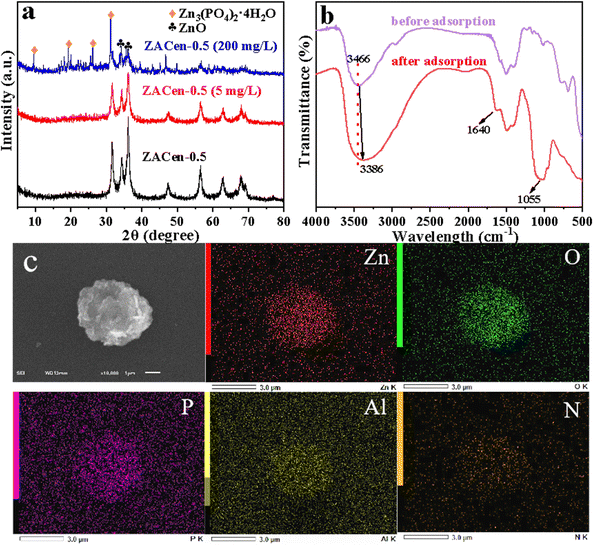
The alteration in the crystal structure of ZACen-0.5 before and after phosphate adsorption is shown in Fig. 11a. After adsorption of a low concentration (5 mg P L−1) of phosphate, ZACen-0.5 exhibited no restoration of the hydrotalcite structure, and its characteristic diffraction peak intensity decreased. Notably, there was an absence of characteristic diffraction peaks associated with LDHs, suggesting the loss of memory effect in ZACen-0.5 following ethylenediamine modification. Moreover, the distinctive diffraction peak related to ZnO associated with ZACen-0.5 diminished after adsorbing 200 mg P L−1 phosphate, while the appearance of the diffraction peak corresponding to Zn3(PO4)2·4H2O indicated the formation of a precipitate between the adsorbed phosphate ions and Zn2+ present on the surface of ZACen-0.5.The infrared spectrum of ZACen-0.5 is shown in Fig. 11b. After the adsorption of phosphate, ZACen-0.5 shows an obvious broad band at 1055 cm−1, corresponding to the PO43− stretched vibration band.55 The stretching vibration of –OH in crystal water and the bending vibration of –OH, respectively, are represented by the absorption peaks at 3466 cm−1 and 1640 cm−1.56 Notably, after phosphate adsorption, the intensity of both peaks enhances, indicating the formation of Zn3(PO4)2·4H2O precipitate. After the adsorption of phosphate, the absorption peak at 3466 cm−1 shifted to 3386 cm−1, indicating a ligand exchange between phosphate and the surface hydroxyl of ZACen-0.5.57Fig. 11c shows the SEM diagram and the corresponding EDS diagram after the adsorption of phosphate by ZACen-0.5. Obviously, compared with the SEM and EDS of the Fig. 1d, the results showed that the elemental composition of ZACen-0.5 adsorbent did not change before and after adsorption. In addition, there was a large amount of P element on the surface of ZACen-0.5 after adsorption, indicating that phosphate was adsorbed by ZACen-0.5.
The principle of surface precipitation as can be seen from Fig. S11 (ESI†). The adsorbed phosphate ions and the metal ions (such as Zn2+) that have leached from the hydrotalcite layer form a surface precipitate Zn3(PO4)2·4H2O:
| ZnO + 2H+ → Zn2+ + H2O | (1) |
| 2HPO42− + 3Zn2+ + 4H2O → Zn3(PO4)2·4H2O↓ + 2H+ | (2) |
| 2HPO4− + 3Zn2+ + 4H2O → Zn3(PO4)2·4H2O↓ + 4H+ | (3) |
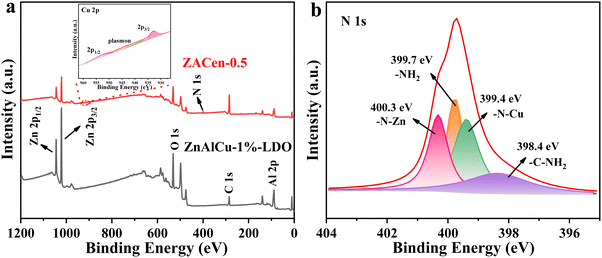
The mechanism of phosphate adsorption by ZACen-0.5 was further explored by XPS. Fig. S12 (ESI†) is the XPS full spectrum of ZACen-0.5 before and after adsorption of phosphate. After adsorption, the characteristic peak of P 2p at 133.8 eV,54 indicating that ZACen-0.5 successfully adsorbed phosphate.
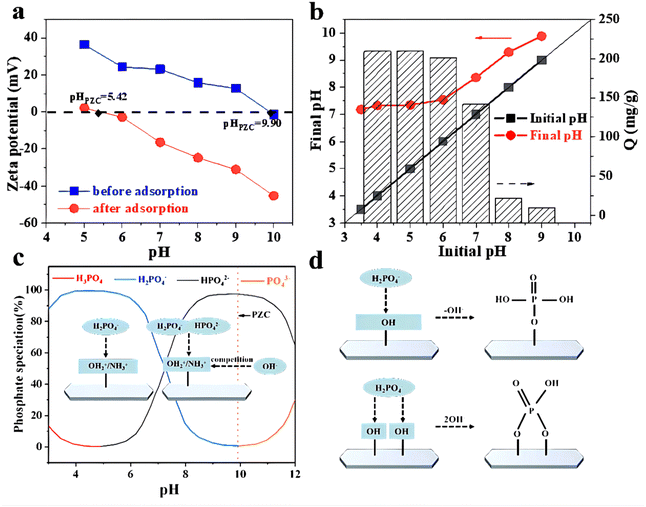
In addition, the adsorption mechanism was studied using Zeta potential analysis. Fig. 12a demonstrates that the point of zero charge (PZC) of ZACen-0.5 is 9.90. As the pH of the solution decreases, the surface positive charge of ZACen-0.5 intensifies, leading to enhanced electrostatic interaction with phosphate anions in the water. The zero charge point of ZACen-0.50 decreases to about 5.42 after phosphate adsorption. This alteration can be attributed to the protonation and deprotonation of hydroxyl groups on the surface of mixed metal oxides, which influence the point of zero charge.58 It's noteworthy that the chemical reaction of the surface charge of the adsorbent remains unaffected by the electrostatic interaction between the adsorbate and the adsorbent surface, thereby keeping the zero charge point unchanged.59 This observation strongly suggests the occurrence of chemical adsorption rather than pure electrostatic interaction between phosphate and ZACen-0.5.60
From Fig. 12b, it can be seen that when the solution pH is between 3.5 and 9, ΔpH (defined as the final pH minus the starting pH) increases as the initial pH decreases, while the adsorption capacity of phosphate significantly rises. According to the Zeta potential test, the positive charge on the surface of the adsorbent increases as the pH decreases, leading to enhanced protonation of hydroxyl and amino groups. Consequently, the negatively charged phosphate experiences strong electrostatic attraction, thereby augmenting the adsorption capacity. Under weak acidic conditions, the main form of phosphate is H2PO4−. The electrostatic interaction makes H2PO4− move to the surface of the adsorbent, where it engages in monodentate ligand exchange with surface hydroxyl groups.61 This process ensures efficient utilization of adsorption sites, ultimately resulting in a substantial increase in the adsorption capacity. Theelectrostatic interaction and ligand exchange mechanism are shown in Fig. 12c and d. On the contrary, under weak alkaline conditions, the abundance of free hydroxyl groups in the initial solution competes with phosphate ions for adsorption. Consequently, the positive charge on the ZACen-0.5 surface diminishes, weakening the electrostatic attraction. Moreover, the proportion of HPO42− in the solution rises, leading to reduced utilization of adsorption sites due to bidentate ligand exchange with surface hydroxyl groups. Additionally, with increasing pH, hydroxyl ligands become more stable on the adsorbent surface, rendering them less prone to exchange. These factors collectively contribute to a significant reduction in adsorption capacity.
In summary, the adsorption mechanism of ZACen-0.5 mainly includes surface precipitation, electrostatic attraction, and ligand exchange. The processes of electrostatic interaction and ligand exchange are as follows:
Electrostatic interaction:
| –OH + H+ + H2PO4− → −OH2+---H2PO4− | (4) |
| –OH + H+ + HPO42− → −OH2+---HPO42− | (5) |
| –OH + H+ + OH− → −OH2+---OH− | (6) |
| –NH2 + H+ + H2PO4− → −NH3+---H2PO− | (7) |
| –NH2 + H+ + HPO42− → −NH3+---HPO42− | (8) |
| –OH + H2PO4− → −H2PO4 + OH− | (9) |
| –2OH + HPO42− → −HPO4 + 2OH− | (10) |
The adsorption mechanism of ZACen-0.5 mainly includes surface precipitation, electrostatic attraction, and ligand exchange, as summarized as Fig. S13 (ESI†). Although ZACen-0.5 no longer has the memory effect of hydrotalcite, the ethylenediamine modification makes the surface of ZACen-0.5 more hydrophilic as evidenced by a decrease in the water contact angle from 52.8° to 18.84°. Moreover, there is an increase in positive charge, with the Zeta potential rising from 31.93 to 36.38 mV at pH = 5. Concurrently, there is a notable enhancement in specific surface area by 51.02% (from 69.27 m2 g−1 to 104.61 m2 g−1) and pore volume by 51.01% (from 0.1392 cm3 g−1 to 0.2102 cm3 g−1). These modifications compensate for the reduced adsorption capacity resulting from the loss of the memory effect and, in fact, lead to further enhancement of the adsorption capacity.
4. Conclusions
In this study, we introduced ethylenediamine as a novel modifier for ZnAlCu-1%-LDO, resulting in the synthesis of the inorganic metal–organic amine composite adsorbent, ZACen-0.5, which exhibited enhanced adsorption performance for phosphate in wastewater. Our experimental findings highlight several key insights: Firstly, ethylenediamine modification induced a transformative change in ZACen-0.5, creating a new surface state characterized by increased hydrophilicity and improved dispersibility in water. Moreover, the modification process led to the granulation of the adsorbent's structure, along with the enlargement of pores and specific surface area. These alterations not only augmented the adsorption sites but also facilitated the diffusion adsorption of phosphate. Compared to CuZnAl-1%-LDO, ZACen-0.5 exhibited a notably higher adsorption capacity. Secondly, the adsorption mechanism of ZACen-0.5 for phosphate was predominantly governed by monolayer adsorption and chemical adsorption. The kinetics of the adsorption process followed the pseudo-second-order kinetic equation, while the Langmuir isothermal adsorption model accurately described the adsorption behavior. The saturated adsorption capacity reached 271.00 mg P g−1, and the adsorption performance remained promising, retaining 88.2% efficiency even after four cycles of regeneration. Furthermore, when applied to real wastewater containing a phosphate concentration of 3.43 mg P L−1, ZACen-0.5 exhibited exceptional phosphate removal efficiency, surpassing 98%. Post-adsorption analysis revealed a residual phosphate content of 0.0531 mg P L−1, meeting the stringent GB 8978–1996 first-level standard of 0.5 mg P L−1. Overall, the ethylenediamine modification strategy offers a promising avenue for enhancing the phosphate adsorption capabilities of hydrotalcite-like compounds, opening up new possibilities for water treatment applications.Author contributions
Na Qin: investigation, methodology, data curation, writing – original draft. Weiwei Lin: methodology, investigation, resources. Jianhua Chen: conceptualization, methodology, resources, funding acquisition, supervision, project administration, validation, writing – review & editing. Dingling Gao, Yuxiang Liu and Yayuan Zhang: investigation, project administration, methodology. Qian Yang: conceptualization, methodology, resources, funding acquisition, supervision, project administration, validation.Conflicts of interest
The authors declare no conflicts of interest.Acknowledgements
This work was supported by the National Natural Science Foundation of China (No. 21676133) and the Natural Science Foundation of Fujian Province (No. 2021J01990; No. 2021J05192). The author also expresses their sincere appreciation to the anonymous referee for his comments on this manuscript.References
- X. Liu, M. Wang, L. Deng, Y.-J. Cheng, J. Gao and Y. Xia, Ind. Eng. Chem. Res., 2022, 61, 3831–3839 CrossRef CAS.
- Y. Li, X. Nan, D. Li, L. Wang, R. Xu and Q. Li, Iop Conf. Ser.: Earth Environ. Sci., 2021, 647, 012163 CrossRef.
- D. Xu, C. Zhong, K. Yin, S. Peng, T. Zhu and G. Cheng, Bioresour. Technol., 2018, 249, 783–790 CrossRef CAS PubMed.
- B. Gong, Y. Wang, J. Wang, W. Huang, J. Zhou and Q. He, Bioresour. Technol., 2018, 256, 562–565 CrossRef CAS PubMed.
- L. Li, Z. Zhu, J. Shi, Z. Li and X. Zuo, J. Cleaner Prod., 2023, 384, 135591 CrossRef CAS.
- X. Lu, H. Duan, A. Oehmen, G. Carvalho, Z. Yuan and L. Ye, Water Res., 2021, 203, 117563 CrossRef CAS PubMed.
- M. Ownby, D.-A. Desrosiers and C. Vaneeckhaute, npj Clean Water, 2021, 4, 6 CrossRef CAS.
- M. S. Shalaby, H. Abdallah, A. Cenian, G. Sołowski, M. Sawczak, A. M. Shaban and R. Ramadan, Sep. Purif. Technol., 2020, 247, 116994 CrossRef CAS.
- H. Liang, H. Zhang, Q. Wang, C. Xu, Z. Geng, D. She and X. Du, Sci. Total Environ., 2021, 792, 148452 CrossRef CAS PubMed.
- X. Jing, Y. Li, Y. Shen, Q. Li and Q. Fang, Sci. Total Environ., 2023, 859, 160334 CrossRef CAS PubMed.
- B. Liu, J. Nan, R. Jiang, F. Wu, L. Song, Z. Ge, X. Ye, X. Zhang and W. Wang, Chem. Eng. J., 2023, 451, 138509 CrossRef CAS.
- J. Li, L. Cao, B. Li, H. Huang, W. Yu, C. Sun, K. Long and B. Young, J. Cleaner Prod., 2023, 382, 135395 CrossRef CAS.
- R. Liu, L. Chi, X. Wang, Y. Wang, Y. Sui, T. Xie and H. Arandiyan, Chem. Eng. J., 2019, 357, 159–168 CrossRef CAS.
- H. Yin, X. Yan and X. Gu, Water Res., 2017, 115, 329–338 CrossRef CAS PubMed.
- D. Mitrogiannis, M. Psychoyou, I. Baziotis, V. J. Inglezakis, N. Koukouzas, N. Tsoukalas, D. Palles, E. Kamitsos, G. Oikonomou and G. Markou, Chem. Eng. J., 2017, 320, 510–522 CrossRef CAS.
- Y. Wang, X. Xie, X. Chen, C. Huang and S. Yang, J. Hazard. Mater., 2020, 396, 122626 CrossRef CAS PubMed.
- S. Saadat, E. Raei and N. Talebbeydokhti, J. Environ. Manage., 2018, 225, 75–83 CrossRef CAS PubMed.
- H. Qiu, M. Ye, Q. Zeng, W. Li, J. Fortner, L. Liu and L. Yang, Chem. Eng. J., 2019, 360, 621–630 CrossRef CAS.
- Y. Zou, R. Zhang, L. Wang, K. Xue and J. Chen, Appl. Clay Sci., 2020, 192, 105638 CrossRef CAS.
- M. H. Hassan, R. Stanton, J. Secora, D. J. Trivedi and S. Andreescu, ACS Appl. Mater. Interfaces, 2020, 12, 52788–52796 CrossRef CAS PubMed.
- C. Sun, H. Cao, C. Huang, P. Wang, J. Yin, H. Liu, H. Tian, H. Xu, J. Zhu and Z. Liu, Bioresour. Technol., 2022, 362, 127851 CrossRef CAS PubMed.
- L. Zhang, H. Dan, O. T. Bukasa, L. Song, Y. Liu, L. Wang and J. Li, ACS Omega, 2020, 5, 25326–25333 CrossRef CAS PubMed.
- Y. Wang, Q. Pan, Y. Qiao, X. Wang, D. Deng, F. Zheng, B. Chen and J. Qiu, Adv. Mater., 2023, 35, 2210871 CrossRef CAS PubMed.
- Q. Pan, F. Zheng, D. Deng, B. Chen and Y. Wang, ACS Appl. Mater. Interfaces, 2021, 13, 56692–56703 CrossRef CAS PubMed.
- Y. Wang, F. Zheng, Q. Pan, D. Deng, L. Liu and B. Chen, J. Alloys Compd., 2021, 884, 161162 CrossRef CAS.
- W. Tan, T. Gao and Y. Wang, Langmuir, 2020, 36, 3836–3842 CrossRef CAS PubMed.
- Z. Xu, Y. Zhong, Y. Wang, X. Song and W. Huang, Environ. Sci. Pollut. Res., 2022, 29, 74591–74601 CrossRef CAS PubMed.
- Q. Pan, F. Zheng, D. Deng, B. Chen and Y. Wang, ACS Appl. Mater. Interfaces, 2021, 13, 56692–56703 CrossRef CAS PubMed.
- K. Rybka, J. Matusik and M. Marzec, J. Cleaner Prod., 2022, 332, 130084 CrossRef CAS.
- W. Yang, Y. Kim, P. K. T. Liu, M. Sahimi and T. T. Tsotsis, Chem. Eng. Sci., 2002, 57, 2945–2953 CrossRef CAS.
- H.-J. Kim, T.-H. Kim, J.-M. Oh, F. Salles, G. Chevallier, C. Thouron, P. Trens, J. Soulie, S. Cazalbou and C. Drouet, Mater. Sci. Eng. B, 2022, 280, 115704 CrossRef CAS.
- K. Nava-Andrade, G. G. Carbajal-Arízaga, S. Obregón and V. Rodríguez-González, J. Environ. Manage., 2021, 288, 112399 CrossRef CAS PubMed.
- K. Yang, L. Yan, Y. Yang, S. Yu, R. Shan, H. Yu, B. Zhu and B. Du, Sep. Purif. Technol., 2014, 124, 36–42 CrossRef CAS.
- Y. Tokudome, M. Fukui, S. Iguchi, Y. Hasegawa, K. Teramura, T. Tanaka, M. Takemoto, R. Katsura and M. Takahashi, J. Mater. Chem. A, 2018, 6, 9684–9690 RSC.
- S. Jaśkaniec, C. Hobbs, A. Seral-Ascaso, J. Coelho, M. P. Browne, D. Tyndall, T. Sasaki and V. Nicolosi, Sci. Rep., 2018, 8, 4179 CrossRef PubMed.
- D. L. Gao, W. W. Lin, Q. J. Lin, F. F. Dai, Y. X. Xue, J. H. Chen, Y. X. Liu, Y. Huang and Q. Yang, J. Environ. Chem. Eng., 2023, 11, 109472 CrossRef CAS.
- R. S. Zambare, K. B. Dhopte, A. V. Patwardhan and P. R. Nemade, Desalination, 2017, 403, 24–35 CrossRef CAS.
- A. Hernández-Gordillo, S. Oros-Ruiz and R. Gómez, J. Colloid Interface Sci., 2015, 451, 40–45 CrossRef PubMed.
- A. Hernández-Gordillo, E. Maya-Flores and V. Rodríguez-Gonzalez, Mater. Lett., 2015, 148, 9–13 CrossRef.
- N. Vrtovec, M. Mazaj, G. Buscarino, A. Terracina, S. Agnello, I. Arčon, J. Kovač and N. Zabukovec Logar, Cryst. Growth Des., 2020, 20, 5455–5465 CrossRef CAS.
- K. Tan, S. Zuluaga, E. Fuentes, E. C. Mattson, J.-F. Veyan, H. Wang, J. Li, T. Thonhauser and Y. J. Chabal, Nat. Commun., 2016, 7, 13871 CrossRef CAS PubMed.
- A. Demessence, D. M. D’Alessandro, M. L. Foo and J. R. Long, J. Am. Chem. Soc., 2009, 131, 8784–8786 CrossRef CAS PubMed.
- Z. Huang, Z. Huang, L. Feng, X. Luo, P. Wu, L. Cui and X. Mao, Carbohydr. Polym., 2018, 202, 470–478 CrossRef CAS PubMed.
- M. Huang, S. B. Mishra and S. Liu, J. Alloys Compd., 2017, 718, 270–278 CrossRef CAS.
- G. Xue and J. Ding, Appl. Surf. Sci., 1990, 40, 327–332 CrossRef CAS.
- P. Chen, S. Zeng, Y. Zhao, S. Kang, T. Zhang and S. Song, J. Mater. Sci. Technol., 2020, 41, 88–97 CrossRef CAS.
- Md. A. Qaiyum, R. Kumari, J. Mohanta, P. P. Samal, S. Dutta, B. Dey and S. Dey, J. Cluster Sci., 2023, 34, 963–975 CrossRef.
- D. Cosano, J. Hidalgo-Carrillo, D. Esquivel, F. J. Romero-Salguero, C. Jiménez-Sanchidrián and J. R. Ruiz, J. Porous Mater., 2020, 27, 441–450 CrossRef CAS.
- P. J. A. Withers, J. J. Elser, J. Hilton, H. Ohtake, W. J. Schipper and K. C. van Dijk, Green Chem., 2015, 17, 2087–2099 RSC.
- Q. Zheng, L. Yang, D. Song, S. Zhang, H. Wu, S. Li and X. Wang, Chemosphere, 2020, 259, 127469 CrossRef CAS PubMed.
- Z. Wang, X. Zhang, X. Wu, J.-G. Yu, X.-Y. Jiang, Z.-L. Wu and X. Hao, J. Sol–Gel Sci. Technol., 2017, 82, 440–449 CrossRef CAS.
- J. Wang, M. Cao, C. Jiang, Y. Zheng, C. Zhang and J. Wei, Mater. Lett., 2018, 229, 160–163 CrossRef CAS.
- F. Xie, F. Wu, G. Liu, Y. Mu, C. Feng, H. Wang and J. P. Giesy, Environ. Sci. Technol., 2014, 48, 582–590 CrossRef CAS PubMed.
- J. He, Y. Xu, W. Wang, B. Hu, Z. Wang, X. Yang, Y. Wang and L. Yang, Chem. Eng. J., 2020, 379, 122431 CrossRef CAS.
- L. Zhang, Q. Zhou, J. Liu, N. Chang, L. Wan and J. Chen, Chem. Eng. J., 2012, 185–186, 160–167 CrossRef CAS.
- Y. Yu and J. Paul Chen, J. Colloid Interface Sci., 2015, 445, 303–311 CrossRef CAS PubMed.
- H. Liu, S. Deng, Z. Li, G. Yu and J. Huang, J. Hazard. Mater., 2010, 179, 424–430 CrossRef CAS PubMed.
- G. Zhang, H. Liu, R. Liu and J. Qu, J. Colloid Interface Sci., 2009, 335, 168–174 CrossRef CAS PubMed.
- Y. Su, H. Cui, Q. Li, S. Gao and J. K. Shang, Water Res., 2013, 47, 5018–5026 CrossRef CAS PubMed.
- Z. Ren, L. Shao and G. Zhang, Water, Air, Soil Pollut., 2012, 223, 4221–4231 CrossRef CAS.
- R. Li, J. J. Wang, B. Zhou, M. K. Awasthi, A. Ali, Z. Zhang, L. A. Gaston, A. H. Lahori and A. Mahar, Sci. Total Environ., 2016, 559, 121–129 CrossRef CAS PubMed.
Footnote |
| † Electronic supplementary information (ESI) available. See DOI: https://doi.org/10.1039/d4nj01395f |
| This journal is © The Royal Society of Chemistry and the Centre National de la Recherche Scientifique 2024 |

