
 Open Access Article
 This Open Access Article is licensed under a Creative Commons Attribution-Non Commercial 3.0 Unported Licence
Nycterohemeral airborne fungal and bacterial communities and health risks of potential pathogens in Shanghai†
Xueyun
Geng
a,
Changliang
Nie
 *a,
Hui
Chen
a,
Xu
Tang
b,
Min
Wei
c,
Yi
Wang
d,
Huanxiang
Gao
d,
Dan
Li
a,
Mingliang
Fang
a,
Ruiting
Ju
a,
Bo
Li
a,
Haidong
Kan
e,
Renjie
Chen
e,
Jinzhuo
Zhao
e,
Lin
Wang
ab and
Jianmin
Chen
*abf
*a,
Hui
Chen
a,
Xu
Tang
b,
Min
Wei
c,
Yi
Wang
d,
Huanxiang
Gao
d,
Dan
Li
a,
Mingliang
Fang
a,
Ruiting
Ju
a,
Bo
Li
a,
Haidong
Kan
e,
Renjie
Chen
e,
Jinzhuo
Zhao
e,
Lin
Wang
ab and
Jianmin
Chen
*abf
aShanghai Key Laboratory of Atmospheric Particle Pollution and Prevention (LAP3), Department of Environmental Science & Engineering, National Observations and Research Station for Wetland Ecosystems of the Yangtze Estuary, Fudan University, Shanghai 200438, China. E-mail: niechangliang@fudan.edu.cn
bIRDR International Center of Excellence on Risk Interconnectivity and Governance on Weather/Climate Extremes Impact and Public Health, Institute of Atmospheric Sciences, Fudan University, Shanghai 200438, China. E-mail: jmchen@fudan.edu.cn
cCollege of Geography and Environment, Shandong Normal University, Jinan 250014, China
dThermo Fisher Scientific China, 200050, China
ePublic Health School, Fudan University, Shanghai 200, China
fInstitute of Eco-Chongming (IEC), Shanghai 200062, China
First published on 25th December 2023
Abstract
Urbanization-influenced airborne microorganisms and megacity bioaerosols have garnered particular attention due to their importance in the atmospheric environment. Herein, the diurnal variation of airborne microbes in PM2.5 between day and night was unveiled by a culture-independent approach and morphological analyses. The results demonstrated that airborne fungi, with values of 8636 copies per m3 (daytime) and 9443 copies per m3 (nighttime), and bacteria, with values of 38![[thin space (1/6-em)]](https://www.rsc.org/images/entities/char_2009.gif) 725 copies per m3 (daytime) and 38613 copies per m3 (nighttime), were observed under improved air quality. The recurrent diel cycle's airborne fungal and bacterial concentrations had no discernible difference. The airborne microbial community structure displayed robustness, in which Formitopsidaceae, Meruliaceae, Aspergillaceae, Rhizobiaceae, Caulobacteraceae, and Moraxellaceae dominated. The LefSE analysis revealed Sistotrema, Moesziomyces and Acinetobacter as diurnal biomarkers and Cercospora and Blastomonas as nocturnal biomarkers. In assessing the health risks of potential pathogens, the nocturnal samples contained a higher fungal relative abundance (38.52%), and diurnal samples had a higher proportion of potentially pathogenic bacteria (21.92%). SO2 inhibited the fungal concentrations significantly. The observation of fungi by Scanning Electron Microscope (SEM) revealed the intact cell structure presumably annotated to Basidiomycota and Ascomycota and acted as the independent atmospheric particle matters of which surface harboured chemical composition. This study offers important insights into airborne fungi and bacteria in metropolitan cities, coupled with high throughput sequencing technologies and morphological observation under low PM2.5 concentration.
725 copies per m3 (daytime) and 38613 copies per m3 (nighttime), were observed under improved air quality. The recurrent diel cycle's airborne fungal and bacterial concentrations had no discernible difference. The airborne microbial community structure displayed robustness, in which Formitopsidaceae, Meruliaceae, Aspergillaceae, Rhizobiaceae, Caulobacteraceae, and Moraxellaceae dominated. The LefSE analysis revealed Sistotrema, Moesziomyces and Acinetobacter as diurnal biomarkers and Cercospora and Blastomonas as nocturnal biomarkers. In assessing the health risks of potential pathogens, the nocturnal samples contained a higher fungal relative abundance (38.52%), and diurnal samples had a higher proportion of potentially pathogenic bacteria (21.92%). SO2 inhibited the fungal concentrations significantly. The observation of fungi by Scanning Electron Microscope (SEM) revealed the intact cell structure presumably annotated to Basidiomycota and Ascomycota and acted as the independent atmospheric particle matters of which surface harboured chemical composition. This study offers important insights into airborne fungi and bacteria in metropolitan cities, coupled with high throughput sequencing technologies and morphological observation under low PM2.5 concentration.
Environmental significanceAirborne microbiota plays significant roles in causing health and climate effects, and its distribution in urban areas has attracted much attention. The fate of airborne microbiota is associated with environmental factors, including air quality and meteorological parameters. Shanghai is a megacity. Despite the improved air quality, the metropolitan airborne microbial community structure displayed robustness and included many potential pathogens. The understanding can help unveil the megacity's airborne bacteria and fungi community and state the environmental effects, including nycterohemeral changes and air pollution, on the airborne microbiota. |
1. Introduction
Airborne microbiota is ubiquitous and essential in airborne particulates.1 The airborne microbes can not only adhere to PM2.5 but also directly exist as fine particles.2 Atmospheric microbes have attracted attention in recent years3–6 as they influence the ecosystem,7 play a role in climate change,8 and cause potential threats to human health.9 Bioaerosols refer to fungi, bacteria, viruses, plant fragments, protozoa, archaea, and algae,4 of which fungi and bacteria are currently hot hubs owing to their high proportion of 21% and 70% in atmospheric particle matter, respectively.10 The airborne microbiota in metropolitan regions has attracted much attention owing to its potential harmful effects on human health.3,11 As urbanization goes on, over half of the people live in cities, and this trend will predictably grow to 70% by the year 2050.12,13 The civil lifestyle alters the microbial communities to which people are exposed. For instance, a higher rate of asthma and allergies in urban areas is linked to urban microbial communities.12 Different cities, such as Beijing,14 Tianjin,15 Jinan,16etc., can shape specific airborne microbiota. Shanghai is an international megacity with over 24 million permanent residents, and the airborne microboita received little attention.Besides the geographical factors, contemporary research indicated that airborne bacteria and fungi are influenced by air quality.17 More microbes were found in atmospheric particulate matter during polluted days while decreasing under heavily polluted days.17 In Shanghai, the annual average concentration of PM2.5 decreased to 32 μg m−3 in 2020 from 62 μg m−3 in 2013.18 Air pollution control has encouragingly made substantial achievements by significantly dropping annual average particulate matter concentrations, but knowledge gaps are still confronted.19 The contemporary literature mainly focuses on airborne microbial community structure on polluted days,20–22 while the features of airborne microbes on ‘clean’ days are poorly understood. In addition, the urban daily anthropological activities following the nycterohemeral patterns might shape the airborne microbial community.23 Zeng et al. (2019) compared the airborne fungal community from diurnal and nocturnal samples and found a higher species richness at night in Wuhan.24 Hu et al. (2020) reported that the total bacteria community structure turned similarly in the daytime, while pathogenic bacteria became homogeneous during the nighttime in Hangzhou.23 The nycterohemeral changes of the airborne microbiota community in Shanghai during clean days remain unknown.
Therefore, we attempt to profile the characteristics of airborne bacteria and fungi communities on clean days and elucidate the urban effects on their discrepancy. The hourly air quality data were recorded to analyze the association with the airborne bacteria and fungi community. qPCR was employed to quantify the airborne microbial concentration. The community composition of diurnal and nocturnal fungi and bacteria communities was revealed through high throughput sequencing (HTS) aimed at the ITS and 16S rRNA gene. Additionally, microscopic observation can provide direct information on airborne particulates,25 and we used the scanning electron microscope (SEM) to observe the particle matter. The present work would provide scientific insights to understand air microbial communities and the impacts of the nycterohemeral discrepancy in the urban atmosphere.
2. Methods and materials
2.1 Sample collection
PM2.5 samples were collected at urban sites in Shanghai, the Yangtze River Delta Region of China, from September to October 2020. The urban site was on the rooftop of Shanghai Primary School attached to the Shanghai Teachers' Professional College building, a five-storey building in Huangpu district (31.21°N, 121.49°E). This building is located in residential dwellings and a commercial area. We collected fifty-two PM2.5 samples and classified those based on a diurnal or nocturnal period (details in the ESI†). The quartz fibre filters (QM-A, Whatman International Ltd, U.K.) with 47 mm diameter for PM2.5 were obtained using low-volume (16.67 L min−1) air samplers for 11 h 55 min (6:05 to 18:00 for daytime and 18:05 to 6:00 for nighttime), as shown in Table S1.† The filters were baked in a Muffle furnace at 500 °C for five hours and then placed into sterilized aluminium foil before being deposited into a sealed bag. The blank filters were collected by placing a sterilized quartz filter inside the sampler without operation. Before sampling, the sampling filter holder and materials used for changing filters were treated with 75% ethanol. The hourly air quality data, including PM10, PM2.5, O3, NO2, SO2, and CO, were obtained from the real-time air quality system established by China's Environmental Monitoring Station of the Ministry of Ecology and Environment. The collected samples were classified based on PM2.5 concentration, following clean samples (less than 35 μg m−3), slightly polluted samples (from 35 to 75 μg m−3), and polluted samples (more than 75 μg m−3).26 Detailed information is shown in the ESI, Fig. S1.†
2.2 DNA extraction and qPCR
The samples were cut into small pieces. Then, the total genomic DNA was extracted from the filters using the TIANamp Soil DNA Kit based on the manufacturer's instructions. The bacterial 16S rRNA and fungal ITS genes were detected by qPCR. The primers were chosen 341F (5′-CCTAYGGGRBGCASCAG-3′), 806R (5′-GGACTACNNGGGTATCTAAT-3′) and ITS1F (5′-CTTGGTCATTTAGAGGAAGTAA-3′), ITS2R (5′-GCTGCGTTCTTCATCGATGC-3′). The qPCR was conducted using the StepOnePlus™ real-time PCR detection system (Thermo). A 20 μL volume contained 10 μL 2× TB Green Premix Ex Taq II (Takara), 0.4 μL 50× ROX Reference Dye, 0.8 μL of each primer (10 μM), and 2 μL template DNA. The procedure was initiated at 95 °C for 10 min, with 40 cycles of denaturation for 20 s at 95 °C and annealing for 30 s at 55 °C. The last was elongation for 30 s at 72 °C. Three replicates for the qPCR test were carried out, and autoclaved water was chosen as a negative control. We plotted the standard curves using 10-fold serial dilutions of plasmids (10 to 107 copies per mL). A Student's t-test was employed to identify significant differences in bacteria and fungi concentrations under different groups.2.3 PCR amplification
Nested PCR was performed for bacteria and fungi due to the low DNA yield.27,28 Primer details and references are listed in ESI Table S1.† ITS1F/ITS4R and ITS1F/ITS2R served as the first and second PCR amplification for fungi. Primers of 27F/1492R and 331F/806R were carried out for the PCR of bacteria. The PCR mixtures contain 15 μL 2× buffer, 0.6 μL dNTP, 1.2 μL forward primer (5 μM), 1.2 μL reverse primer (5 μM), 0.6 μL DNA polymerase, ten ng template DNA, and finally, ddH2O up to 30 μL. The procedure of the first round was initiated for 3 min at 95 °C, 25 cycles of 95 °C for 15 s, 52 °C for 15 s, and 72 °C for 90 s (for bacteria) or 60 s (for fungi), and extended at 73 °C for 5 min. The second round was initiated for 3 min at 95 °C, 25 cycles of 95 °C for 15 s, 52 °C for 15 s, and 72 °C for 30 s, and extended at 73 °C for 5 min. PCR was performed in triplicate to reduce the amplification variability, and the final PCR product was a mixture of triplicates. The PCR product was extracted from 2% agarose gel and purified using the AxyPrep DNA Gel Extraction Kit (Axygen Biosciences, Union City, CA, USA) according to the manufacturer's instructions and quantified using a Quantus™ Fluorometer (Promega, USA).2.4 Illumina MiSeq sequencing and data processing
Purified amplicons were pooled in equimolar and paired-end sequenced on an Illumina MiSeq PE300 platform (Illumina, San Diego, USA) according to the standard protocols by Majorbio Bio-Pharm Technology Co. Ltd (Shanghai, China). The raw 16S rRNA and ITS gene sequencing reads were demultiplexed, quality-filtered using fastp version 0.20.0 (ref. 29) and merged using FLASH version 1.2.7.30 The 300 bp reads were truncated at any site receiving an average quality score of <20 over a 50 bp sliding window, and the truncated reads shorter than 50 bp were discarded, and reads containing ambiguous characters were also discarded. Only overlapping sequences longer than ten bp were assembled according to their overlapped sequence. The maximum mismatch ratio of the overlap region is 0.2. Reads that could not be assembled were discarded. Samples were distinguished according to the barcode and primers. The sequence direction was adjusted, and the exact barcode matching and two nucleotide mismatches were in primer matching. Operational taxonomic units (OTUs) with a 97% similarity cutoff31,32 were clustered using UPARSE version 7.1,32 and chimeric sequences were identified and removed. The taxonomy of each OTU representative sequence was analyzed using RDP Classifier version 2.2 (ref. 33) against the 16S rRNA database (SILVA) and fungal database (UNITE) using a confidence threshold of 0.7.2.5 Data analysis
Significantly different bacterial and fungal concentrations between day and night were analyzed by a one-way ANOVA test at 95% confidence intervals (*p < 0.05). Subsequent analyses of alpha and beta diversity were performed based on normalised data. Alpha diversity will reveal the complexity of species diversity, including Sobs, Chao1, Shannon, and Good-coverage.17 Beta diversity analysis was used to evaluate the differences of samples in species complexity. LEfSe analysis was employed to detect the differential abundant features in the two groups and estimate the effect size of each differentially abundant feature by using linear discriminant analysis (LDA > 3.0). Spearman correlations between the microbiota and air quality were analyzed. The metabolic function of the bacterial community can be predicted according to the FAPROTAX database. FUNGuild is an environmental function database of fungi. Based on the existing literature's support, fungal ecological functions were classified.342.6 The individual particle sample collection
Individual particle samples were collected on copper (Cu) TEM grids coated with carbon film (carbon type-B, 300-mesh copper; Tianld Co., China) by a single-stage cascade impactor called the DKL-2 sampler (Genstar Electronic Technology, China).25 We collected one sample for 15 min, and the sample details are shown in the ESI.†2.7 Scanning electron microscopy analysis
Scanning electron microscopy (SEM) was performed using an electron microscope that can determine the particle surface by scanning it with a high-energy beam of electrons in a raster scan pattern. An SEM system (Apreo, Thermo Fisher) with a field emission gun operating at 3–4 kV was used to obtain detailed information on the surfaces of individual aerosol particles. The SEM can efficiently obtain coarse particles' surface morphology and size without any coating process on the substrate. We used SEM to observe the surface morphology of the particles.2.8 Daily inhalation evaluation
The human inhalation daily intake (DI) of the airborne microorganism, including potential pathogens, was estimated by using the following equations:| DIITS(copies per day) = fungal genetic concentrations(copies per m3) × inhalation rate(m3 day−1) | (1) |
| DI16S(copies per day) = bacterial genetic concentrations(copies per m3) × inhalation rate(m3 day−1) | (2) |
| DIpathogen(copies per day) = genetic concentration(copies per m3) × relative abundance(%) × inhalation rate(m3 day−1) | (3) |
The ITS and 16S rDNA concentrations were quantified by qPCR, and the relative abundance was obtained from HTS. The inhalation air rate was set at 20 m3 day−1.35,36
3. Results and discussion
3.1 The variation in microbial concentration
The ITS and 16S rRNA gene concentration revealed the airborne microbial concentration by qPCR determination, as shown in Fig. 1. The diurnal fungal ITS gene concentration ranged from 995 to 23529 copies per m3, with an average value of 8636 copies per m3, lower than that in the nocturnal sample that fluctuated between 634 and 28669 copies per m3, with an average value of 9443 copies per m3. Fungal ITS gene concentration did not exhibit a significant difference between day and night (p > 0.05), although some scholars reported that fungi could become dominant at nighttime when relative humidity rose and temperature declined.23,37 The bacterial 16S rRNA gene concentration ranged from 31882 and 43048 copies per m3 in the diurnal samples and 32426 and 43493 copies per m3 in the nighttime. The average values of the 16S rRNA gene were 38725 and 38613 copies per m3, corresponding to the diurnal and nocturnal samples. Due to anthropogenic activities, they have reported a higher total bacterial concentration in diurnal samples than in nocturnal samples.23 However, it was not apparent in the present study (p > 0.05).
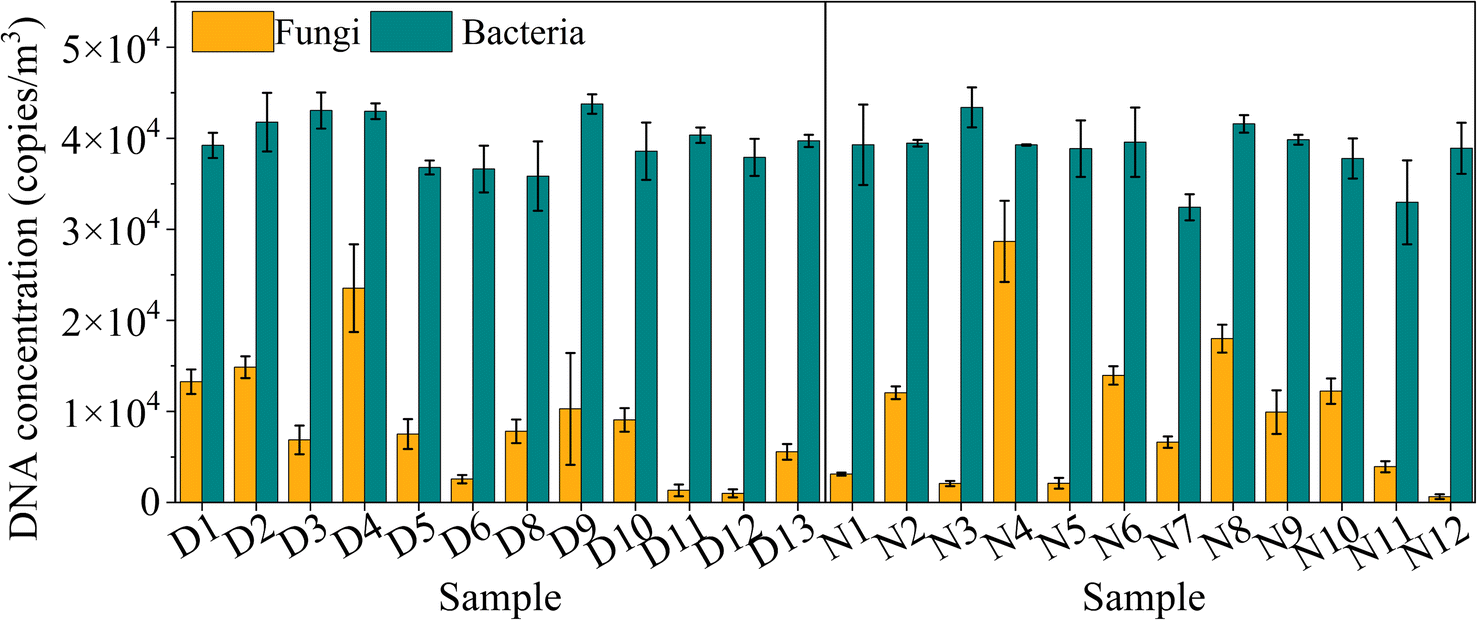 | ||
| Fig. 1 The airborne fungal ITS gene and bacterial 16S rRNA gene concentrations (copies per m3) for diurnal and nocturnal samples using qPCR tests. The line represents the PM2.5 concentration. | ||
The fungal ITS gene concentration was lower than the bacterial 16S rRNA gene because the size of fungal particles was generally more prominent than bacterial particles. The suspended fungi often refer to the intact spores or hyphal fragments, and some multicellular spores exceed ten μm.2 The diameters of unicellular fungal spores usually range from 1 to 10 μm, with only fractions of airborne fungi with a diameter of less than one μm.2 Conversely, the bacterial size was smaller from 0.1 to 5 μm and easier to attach to fine particles.2 Consequently, the fine particles possess lower fungal concentrations.
Compared to the references (seen in Table 1), the bacterial 16S rRNA gene copy number was similar to the concentration detected in Hangzhou, where the total bacterial DNA copy number was in the order of 104 copies per m3 (ref. 23) but far lower than that (105 cells per m3) during heavy and severe pollution.17 However, copies of the 16S rRNA gene could vary significantly in different cities. Ma et al. (2023) compared the 16S rDNA copy variation of PM2.5 in Harbin, following a seasonal and air quality pattern collection.38 They found that the lowest 16S rDNA concentration occurred in winter with a high PM2.5 concentration, and the highest value occurred in spring.38 The spring, summer, and autumn results showed that the increased PM2.5 induced a high 16S rDNA concentration. However, some unexpected factors altered the trend. For example, the low temperature lowered microbial metabolism, and the covered snow surface inhibited soil-associated bacteria emission, which resulted in low airborne bacteria concentration.38 The concentration of fungal spores ranged from 103 to 105 particles per m3 in the atmosphere,39–41 which exceeded the fungal concentration in the present work. The bacterial and fungal concentration in the present work suggested that clean days in Shanghai effectively control airborne fungal counts.
| Location | 16S rDNA concentration | ITS DNA concentration | Sample type | Method | Ref. |
|---|---|---|---|---|---|
| Shanghai | 3.87 × 10⁴ copies per m3 | 8.63 × 10³ copies per m3 | PM2.5 (daytime) | qPCR | This study |
| 3.86 × 10⁴ copies per m3 | 9.44 × 10³ copies per m3 | PM2.5 (nighttime) | qPCR | ||
| Harbin | 8.76 × 10⁵ copies per m3 | PM2.5 | qPCR | 38 | |
| 1.03 × 10⁵ copies per m3 | PM2.5 | qPCR | |||
| 4.74 × 10⁴ copies per m3 | PM2.5 | qPCR | |||
| Hefei | 2.98 × 10³ to 2.86 × 10⁴ copies per m3 | 1.75 × 10³ copies per m3 | PM1.0 | qPCR | 5 |
| 2.29 × 10² to 1.68 × 10³ copies per m3 | 84.1 copies per m3 | PM2.5 | qPCR | ||
| 2.34 × 10² to 2.54 × 10³ copies per m3 | 4.90 × 10² copies per m3 | PM10 | qPCR | ||
| Qi'ao Island | 3.36 × 10⁴ cells per m3 | 1.9 × 10² cells per m3 | TSP | qPCR | 71 |
| Jinan | 106 cells per m3 | PM2.5 | qPCR | 17 | |
| Weihai | 105 cells per m3 | PM2.5 | qPCR | ||
| Hangzhou | 3.06 × 10⁴ copies per m3 | PM2.5 | qPCR | 23 | |
| 2.64 × 10⁴ copies per m3 | PM2.5 | qPCR | |||
| Yucheng | 1.9 × 10⁴ cells per m3 | 1.4 × 10³ cells per m3 | PM2.5 | qPCR | 34 |
| 1.2 × 10⁵ cells per m3 | 4.2 × 10⁴ cells per m3 | PM2.5 | qPCR | ||
| Beijing | 1.31 × 10⁵ copies per m3 | TSP (winter) | qPCR | 60 | |
| 1.85 × 10⁶ copies per m3 | TSP (spring) | qPCR | |||
| 4.66 × 10⁴ copies per m3 | TSP (summer) | qPCR | |||
| 7.15 × 10⁵ copies per m3 | TSP (autumn) | qPCR |
3.2 The airborne fungal and bacterial community
Basidiomycota and Ascomycota predominated the airborne fungal communities at the phylum level (Fig. 2). Similar results occur in several domestic megacities like Beijing,42 Tianjin,15 and Wuhan.24 These fungal phyla are ubiquitous in foreign international megacities, like Lecce in Italy43 and Madrid in Spain.3 Some research indicated that Ascomycota is more abundant than Basidiomycota, as shown in Table 1. However, the Basidiomycota proportion in the present work was higher than that of Ascomycota, which was in line with Frohlich-Nowoisky's study.44 It speculated that the Basidiomycota mainly originated from the atmosphere–biosphere interface, namely, the soil and vegetation surface, and the efficiency of spore dispersion was reinforced in the autumn period.44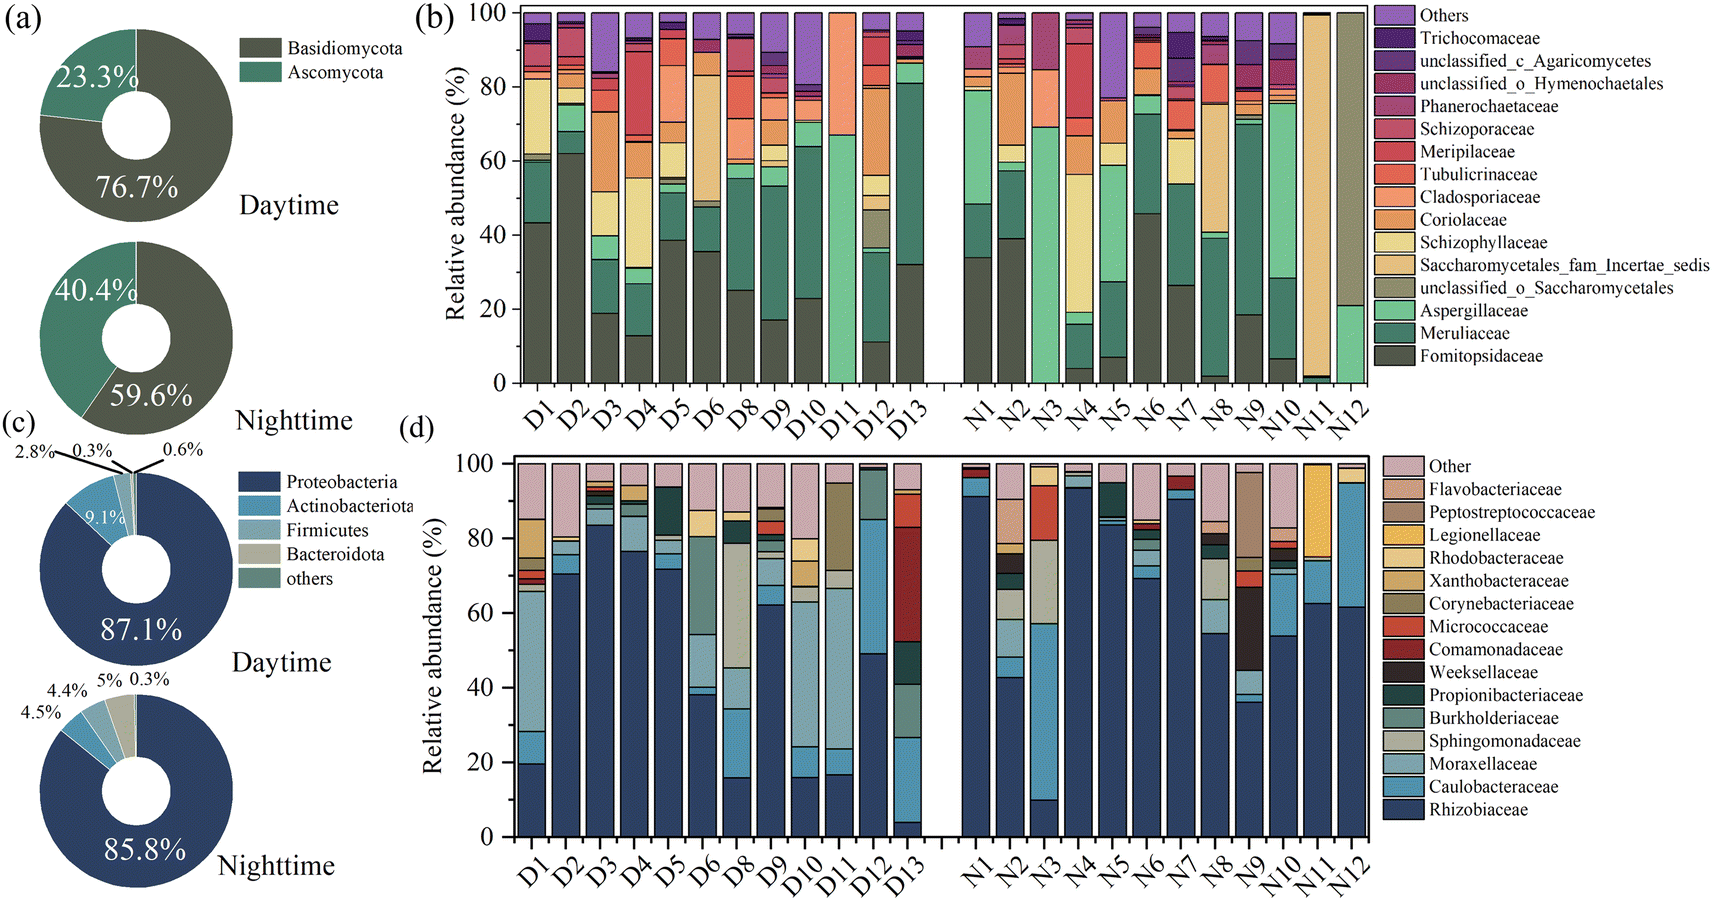 | ||
| Fig. 2 The characteristics of airborne fungi and bacteria at phylum and family (top 15 genera only) levels in diurnal and nocturnal samples. (a) and (b) represent the airborne fungi community. (c) and (d) represent the airborne bacteria community. | ||
Fig. 2(b) and (d) display airborne microbial communities at the family level. Formitopsidaceae, Meruliaceae, and Aspergillaceae were the mainly detected genera at the family level, with 26.60%, 21.34%, and 9.14% in diurnal samples and 15.25%, 19.28%, and 17.75% in nocturnal samples. Formitopsidaceae and Meruliaceae were abundant and belong to Agaricomycetes. Agaricomycetes include many mushroom species and are abundant in wet deposition.15 Some fungal species belonging to Agaricomycetes prefer to release spores under precipitation. For instance, Schizophyllum, a typical Agaricomycetes, was frequently detected, with average values of 6.15% (daytime) and 5.17% (nighttime). It is often found in fallen leaves and wood.45 It survives in a saprophytic manner and is prone to grow in humid environments.15 This could explain the high Agaricomycetes proportion in the present work. As Fig. S6† depicts, based on FUNGuild analysis, the fungal function was mainly classified as an undefined saprotroph, which occupied 52.41% and 62.51%, corresponding to the day and night samples, and a wood saprotroph, which accounted for 33.80% and 24.29%, corresponding to the day and night samples.
Proteobacteria was the representative phyla in diurnal (an average value of 87.1%) and nocturnal (an average value of 85.8%) samples, followed by Actinobacteriota, Firmicutes, and Bacteroidota, as shown in Fig. 2(c). Proteobacteria are reported as the most abundant phylum in the atmospheric samples,4 whereas the relative abundance varied with different sampling locations, as shown in Table 1. For example, Yu et al. (2019) revealed that the Proteobacteria occupied 95.6% of fine particles during the non-hazy days in Changsha.46 Liu et al. (2018) reported that the average relative abundance of Proteobacteria in Hangzhou was 32.2%.47 Rhizobiaceae, Caulobacteraceae, and Moraxellaceae were the top three widely detected families, Fig. 2(d). Rhizobiaceae belongs to Rhizobiales, known as plant-associated bacteria,48 and spread in soil.49 The high fraction of these bacteria implied a significant influence of plant sources on shaping the airborne bacterial community. Urban parks can provide plant and soil-related niches.50 Moreover, the seasonal variability also affected the bacterial community structure. As the samples were collected in autumn, agricultural practices such as crop harvesting and ploughing may lead to the plant or soil-associated bacteria being abundant in the airborne particle matter.5,10 The peak of soil-derived bacteria commonly occurred in late summer and fell as low soil moisture and increased temperatures resulted in high dust loads,5 which could explain the bacterial community structure.
3.3 The diversity of the airborne microbiota community
The fungal and bacterial α-diversity index, including Sobs, Shannon, Chao, and Coverage, is shown in ESI Fig. S2.† Non-metric multidimensional scaling (NMDS) analysis revealed the discrepant characteristics of fungi and bacteria in community composition based on Bray–Curtis. The diurnal fungal (Fig. 3(a)) and nocturnal bacterial samples (Fig. 3(c)) are inclined to cluster. Moreover, the two groups (day and night samples) shared a major area, implying that the nycterohemeral discrepancy of the fungal and bacterial communities is not apparent, with stress values of 0.162 and 0.112, respectively. The distinction is partly explained when the stress value is between 0.1 and 0.2. The shared or exclusive fungal and bacterial genus distribution of diurnal and nocturnal samples is shown in Fig. 3(b) and (d). The results illustrated that 71 fungal and 44 bacteria genera conjointly exist in diurnal and nocturnal samples. The daily sample contained 26 fungi and 23 bacteria, less than the nocturnal sample, with 40 fungi and 35 bacteria. The taxonomic diversity of day-to-day or month-to-month samples tended to the robustness of the community structure in one sample site.37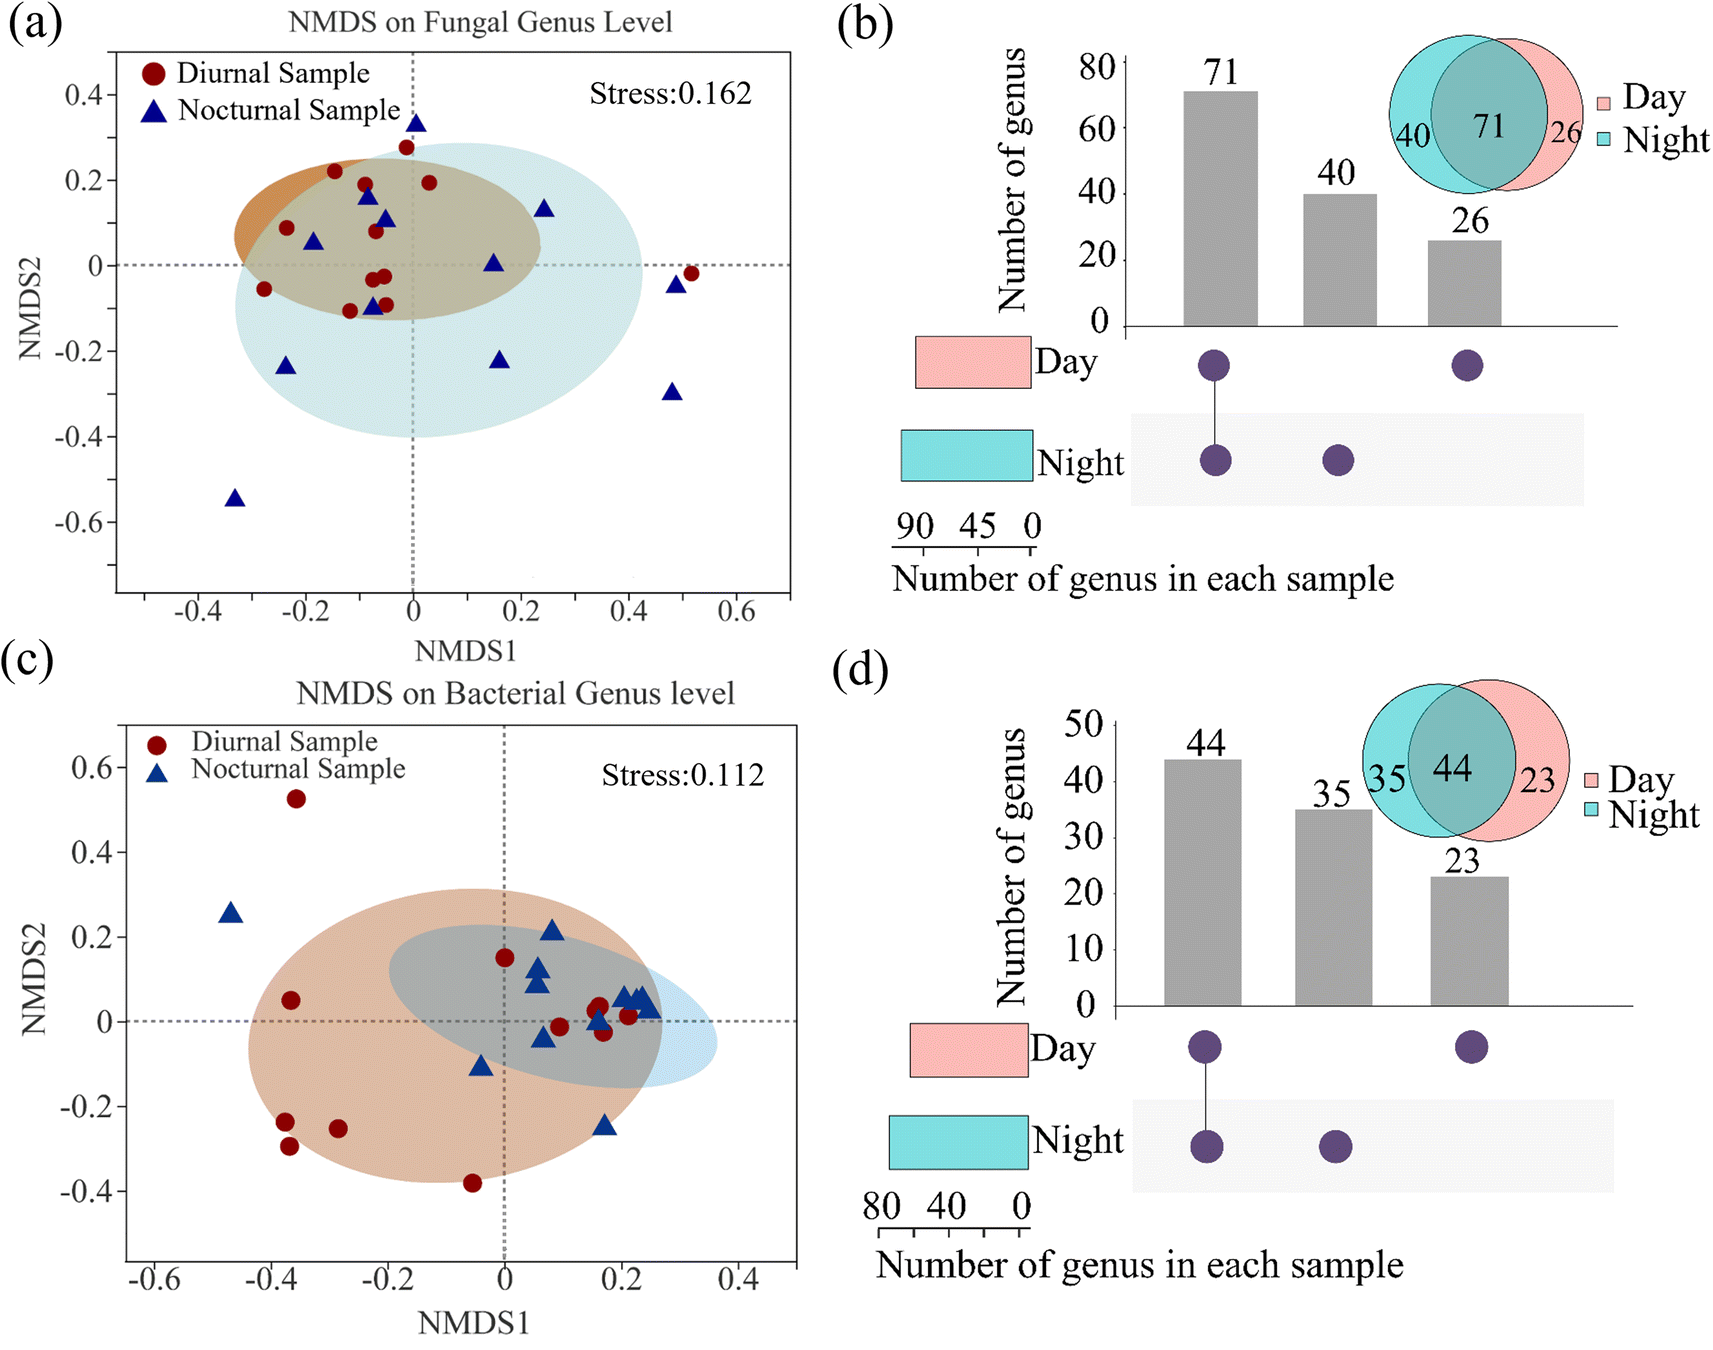 | ||
| Fig. 3 The NMDS analysis of the diurnal and nocturnal distinction in (a) fungi and (c) bacteria community. (b) and (d) represent the distribution of airborne fungi and bacteria at the genus level. The bar chart above represents the number of genera contained in each type of group. The bar chart at the bottom left represents the number of genera included in the day and night samples. | ||
The linear discriminant analysis effect size (LEfSe) was performed to determine the biomarker of diurnal and nocturnal samples from the phylum to the genus level (LDA scores greater than or equal to 3). Fig. S2(c) and (d)† show that two fungal taxa were significantly enriched in the diurnal samples, including Sistotrema and Moesziomyces, at the genus level. Cercospora was enhanced considerably in the nocturnal sample. Seven bacterial taxa were significantly enriched in the daytime, including a taxon at the class level (Gammaproteobacteria), two taxa at the order level (Burkholderiales and Pseudomonadales), two taxa at the family level (Burkholderiaceae and Moraxellaceae), and two taxa at the genus level (Acinetobacter and Blautia). Blastomonas was characterized as the significantly enriched taxa in the nocturnal samples. The phenomenon can reflect the difference between diurnal and nocturnal microbiota induced by anthropological activities, with an example of the biomarker genus Acinetobacter, which is prevalently found in association with the human microbiota.51
3.4 The potential pathogens
Airborne potential pathogenic or allergic fungi and bacteria adversely affect human health. Owing to the limitation of the next generation high throughput sequencing technologies, Fig. 4 shows the potentially pathogenic fungi and bacteria at the genus level. Through sequence alignment, we found ten potential pathogenic fungi genera with a relative abundance of 24.45% in the daytime and twelve potentially pathogenic genera (38.52%) in the nighttime. The dominant genera in diurnal samples included Schizophyllum (6.15%), Cladosporium (5.81%), Penicillium (4.97%), Aspergillus (3.47%), and Candida (3.07%). The nocturnal sample was predominantly composed of Candida (11.00%), Aspergillus (10.53%), Penicillium (7.11%), Schizophyllum (5.17%), Cladosporium (1.92%), and Stachybotrys (1.56%). Candida species, such as albicans and tropicalis, are responsible for causing opportunistic human infections.52Cladosporium, Aspergillus, and Penicillium are the sources that cause allergic rhinitis or asthma.53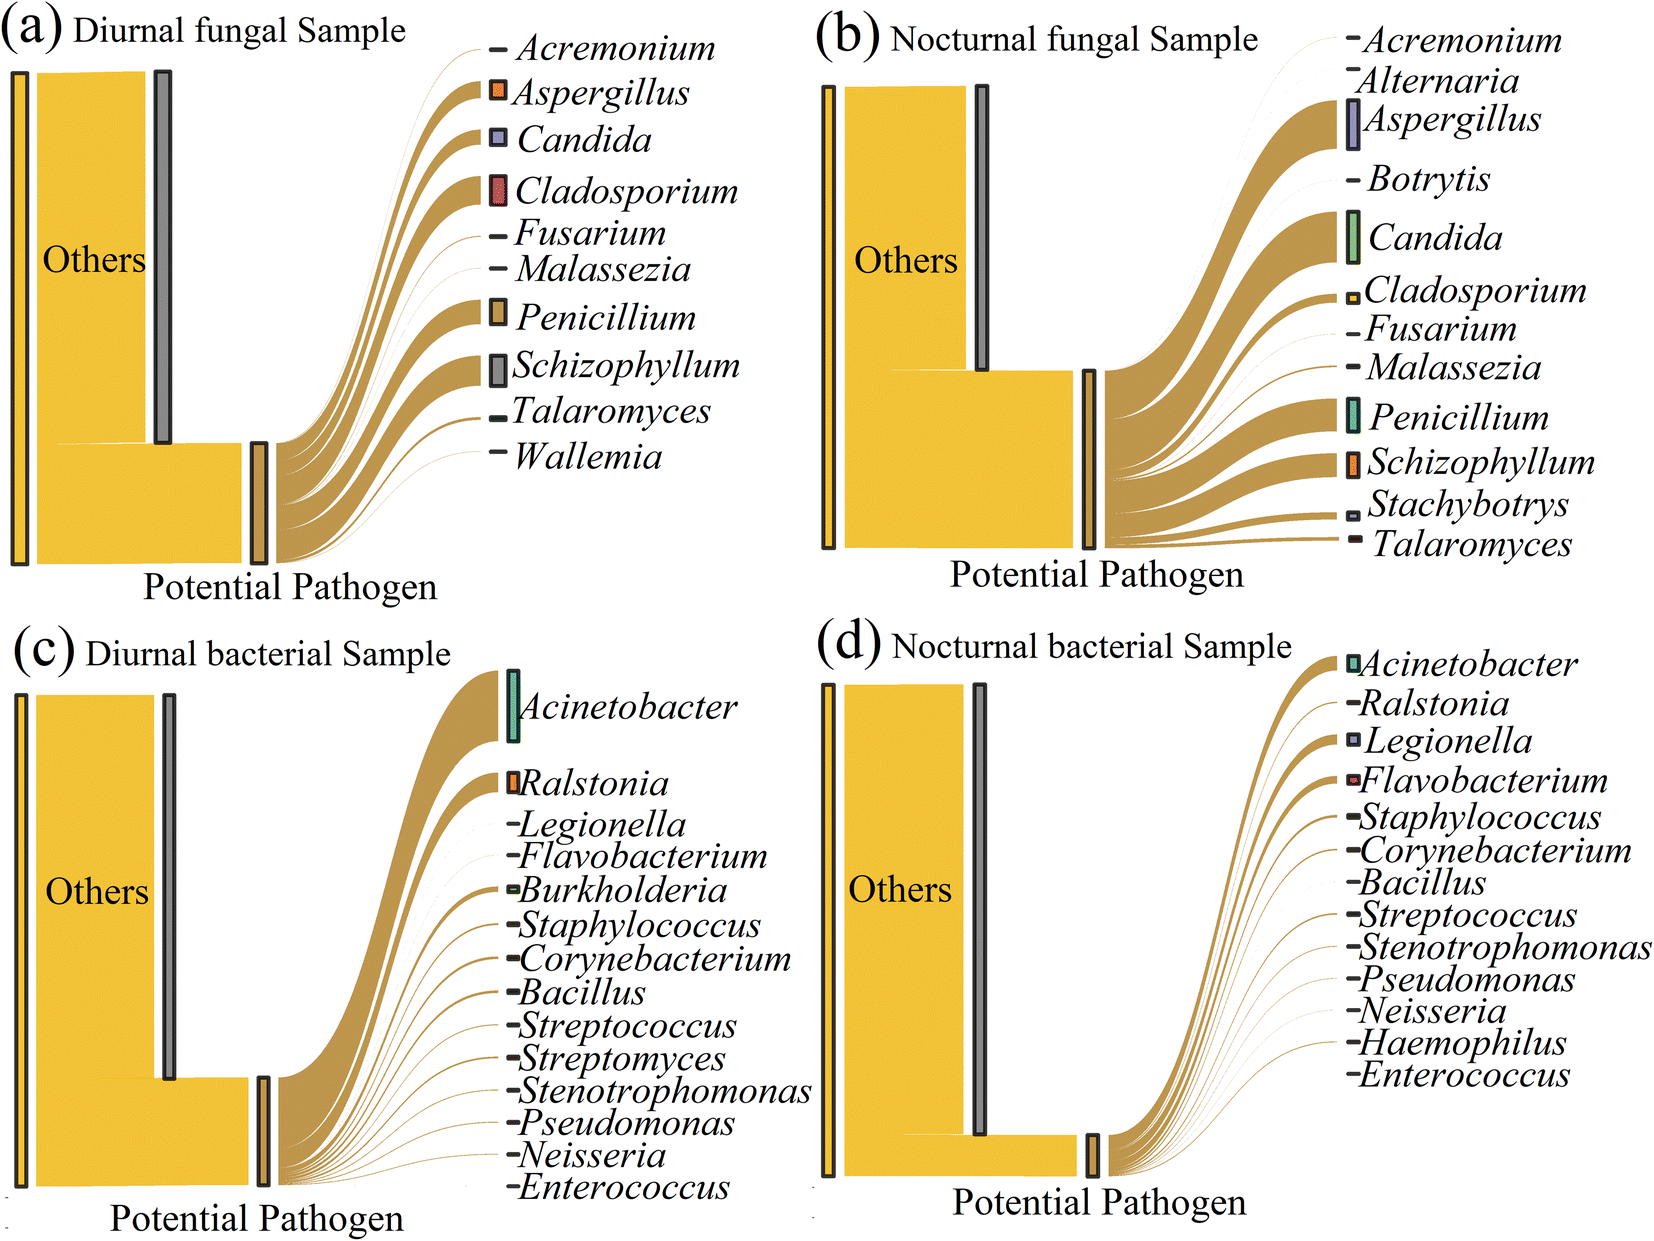 | ||
| Fig. 4 The potential pathogen at the genus level in diurnal and nocturnal samples. (a) and (b) represent the potential pathogenic fungi. (c) and (d) represent the potential pathogenic bacteria. | ||
Regarding the potentially pathogenic bacteria, the result displayed 14 bacterial genera detected with a relative abundance of 21.92% in the daytime and 13 potential pathogenic genera (8.42%) in the nighttime. The potentially pathogenic bacteria accounted for a higher percentage during the day than the nighttime. Acinetobacter (14.37%), Ralstonia (4.00%), and Burkholderia (1.11%) were the dominant genera in the diurnal samples (with relative abundance >1%). The pathogenic bacterial community in nocturnal samples was represented by the abundant Acinetobacter (2.96%), Legionella (2.06%), and Flavobacterium (1.55%). Acinetobacter is an opportunistic pathogenic bacteria that can cause infection in different human body parts, such as lung infection and pneumonia.54Ralstonia is a potential opportunistic plant pathogen.55 Some Burkholderia strains are known as pathogens of animals, plants, and humans.56 Compared to the daytime, the nocturnal samples were more enriched in Legionella, which can cause a troublesome Legionnaries' disease and Pontiac fever,57 and Flavobacterium, which is an opportunistic or true pathogen and induces disease in a variety of organisms, including fish, plants, and humans.58
We also used the daily inhalation equation to estimate the total inhalation of airborne fungi, bacteria concentration, and potential pathogens, as shown in Table 2. In line with the relative abundance, the average fungal inhalation concentration reached 86364 copies, lower than the value (94425 copies) in the nighttime. The bacteria showed a high value of 387254 copies in the daytime compared to that (386134 copies) in the nighttime. Regarding the potential pathogens, Schizophyllum (5311 copies), Cladosporium (5015 copies), and Penicillium (4296 copies) were the top 3 in diurnal samples, and Candida (10390 copies), Aspergillus (9942 copies), and Penicillium (6709 copies) were the top 3 in nocturnal samples. Acinetobacter (55650 copies) was the most abundant, followed by Ralstonia (15482 copies) and Burkholderia (4280 copies) in the daytime. Acinetobacter (11424 copies) was still the most abundant genus in the nighttime, followed by Legionella (7953 copies) and Flavobacterium (5994 copies).
| Inhalation types | Daytime (copies) | Nighttime (copies) |
|---|---|---|
| Fungal ITS DNA | 86364 |
94425 |
| Acremonium | 103 | 34 |
| Alternaria | 0 | 4 |
| Aspergillus | 2992 | 9942 |
| Botrytis | 0 | 11 |
| Candida | 2655 | 10390 |
| Cladosporium | 5015 | 1815 |
| Fusarium | 147 | 33 |
| Malassezia | 41 | 335 |
| Penicillium | 4296 | 6709 |
| Schizophyllum | 5311 | 4885 |
| Stachybotrys | 1118 | 1476 |
| Talaromyces | 499 | 739 |
| Wallemia | 54 | 0 |
| Bacterial 16S rDNA | 387254 |
386134 |
| Acinetobacter | 55650 |
11424 |
| Ralstonia | 15482 |
980 |
| Legionella | 27 | 7953 |
| Flavobacterium | 115 | 5994 |
| Burkholderia | 4280 | 0 |
| Staphylococcus | 1446 | 2078 |
| Corynebacterium | 2057 | 1162 |
| Bacillus | 2010 | 15 |
| Streptococcus | 699 | 1193 |
| Streptomyces | 1332 | 0 |
| Stenotrophomonas | 609 | 569 |
| Pseudomonas | 632 | 354 |
| Neisseria | 532 | 130 |
| Haemophilus | 0 | 660 |
| Enterococcus | 2 | 1 |
The potential pathogenic fungi possessed higher relative abundance in the nocturnal samples compared to the daytime. This phenomenon can probably be ascribed to the prevalence of fungi in the nighttime. The more abundant fungi appeared at night, and the possibility of potentially pathogenic fungi increased. The diurnal sample contained a higher pathogenic bacterial relative abundance. It might be attributed to the high proportion of human-associated genera, Acinetobacter,51 spreading by anthropological activities during the daytime. The 16S rRNA gene function prediction based on FAPROTAX indicated a higher human pathogenic gene in the daytime samples with a significant difference (p < 0.05), as shown in ESI Fig. S7.†
3.5 The correlation between the environmental factors and airborne microbiota
Environmental factors play an essential role in airborne microbes. Gaseous pollutant levels (PM2.5, PM10, NO2, SO2, and CO) probably increase the similarity of airborne microbial communities in the urban atmosphere,19 and the pollutants can benefit the growth of pollutant-degrading strains, resulting in higher relative abundances.3 However, there is a view that the effects of air pollution are limited but still have different effects on airborne microorganisms.59 Furthermore, the meteorological factors, including temperature, relative humidity, and wind, also determined the airborne microorganism distribution. We constructed the correlation analysis based on the airborne microbiota and environmental parameters, as shown in ESI Fig. S3–S5.† The air quality was recorded as shown in Fig. S1.†Some work indicated that meteorological parameters played a more critical role in shaping the airborne microbiota, owing to the apparent meteorological variation.60 The meteorological factors, including temperature, relative humidity, and wind speed, exerted limited effects on airborne microbes in this work, perhaps influenced by the narrow deviation of environmental parameters. Specifically, the diurnal temperature was only 0.96–1.29 times higher than that of nighttime. The relative humidity ratio between day and night ranged from 0.88 to 1.38. The deviation was too close to differentiate the airborne microbe distribution. All the same, Paracoccus, Acinetobacter, Cladosporium, Amyloporia, and Crustoderma were significantly positively associated with temperature.
The clean air quality follows a standard (lower than 35 μg m−3).17,48 The average PM2.5 concentrations were 22.68 μg m−3 for diurnal samples and 24.09 μg m−3 for nocturnal samples (ESI Fig. S1). ESI Fig. S5† indicates a positive correlation between the fungi and bacterial concentrations and PM2.5 (0.11 and 0.36), but not significantly, probably due to the narrow variation range of PM2.5 concentration. Wei et al. (2020) compared the 16S rDNA copy concentration under different air qualities based on the PM2.5 concentrations and demonstrated an uptrend of bacteria concentration accompanied by the pollution increase, but the highest concentration was observed in moderate pollution (up to 106 cells per m3). Subsequently, the bacterial concentration (105 cells per m3) decreased during heavy and severe pollution.17 PM2.5 usually comes from local fugitive dust emissions and regional transportation61 or as vehicles to carry the microorganism. The airborne microbiota concentration and diversity are profoundly subjected to the location sources and, in turn, affect local climate, atmosphere, and health.62 The responses to the pollutant level of relative abundance are species-dependent. PM2.5 was positively linked with Schizophyllum and Phanerodontia, respectively, and negatively related to six fungal genera, such as Ceriporia, Bjerkandera, and Sistotremastrum. Two bacterial genera (Ochrobactrum and Micrococcus) correlated negatively with PM2.5.
SO2, which is toxic to microorganisms,3,43 exerted adverse effects on fungal concentration, with a value of −0.46 at a significant level (p < 0.05), while it played a minor role in shaping the airborne bacteria concentration and community. It adversely affected fungi like Flavodon, Trametes, and Schizophyllum. O3 commonly inhibits the airborne microbes, but low concentration delivers no evident impact on the airborne microbes.63 NO2 was positively related to fungi (e.g. Emmia, unclassified_Meruliaceae, Sistotrema), partly because it could be the nitrogen source for supporting the microorganisms.63 The CO emitted by fossil fuel combustion and vehicle exhaust64 promoted fungal and bacterial genera, e.g., Emmia, Lentinus, Diplomitoporus, Sphingobacterium, Allorhizobium–Neorhizobium–Pararhizobium–Rhizobium, and Staphylococcus.
3.6 The airborne microbe morphology
The high throughput sequence can help identify the airborne microbiota and the microscopic observation benefits from understanding the airborne microbes' physiological features. Detailed microscopic characteristics can help to distinguish microbiological features, including apical apparatus in the ascus, position, size, and shape. Researchers highlighted the importance of combining HTS and morphological approaches to reveal airborne fungal diversity.65,66 We observed the intact cells of airborne fungal spores, which were bigger than two μm, suggesting that the fungal spore was suspended in the air as an independent particle. The detected airborne fungi in more fine particle matter, such as PM1.0, were likely to be segments of fungal cells. The separate fungal particle also acted as a vehicle that can carry some chemical composition, as shown in the position with yellow arrows in Fig. 5(B). The bacteria could hardly be recognized by direct observation as they are usually globular, rodlike, or fusiform.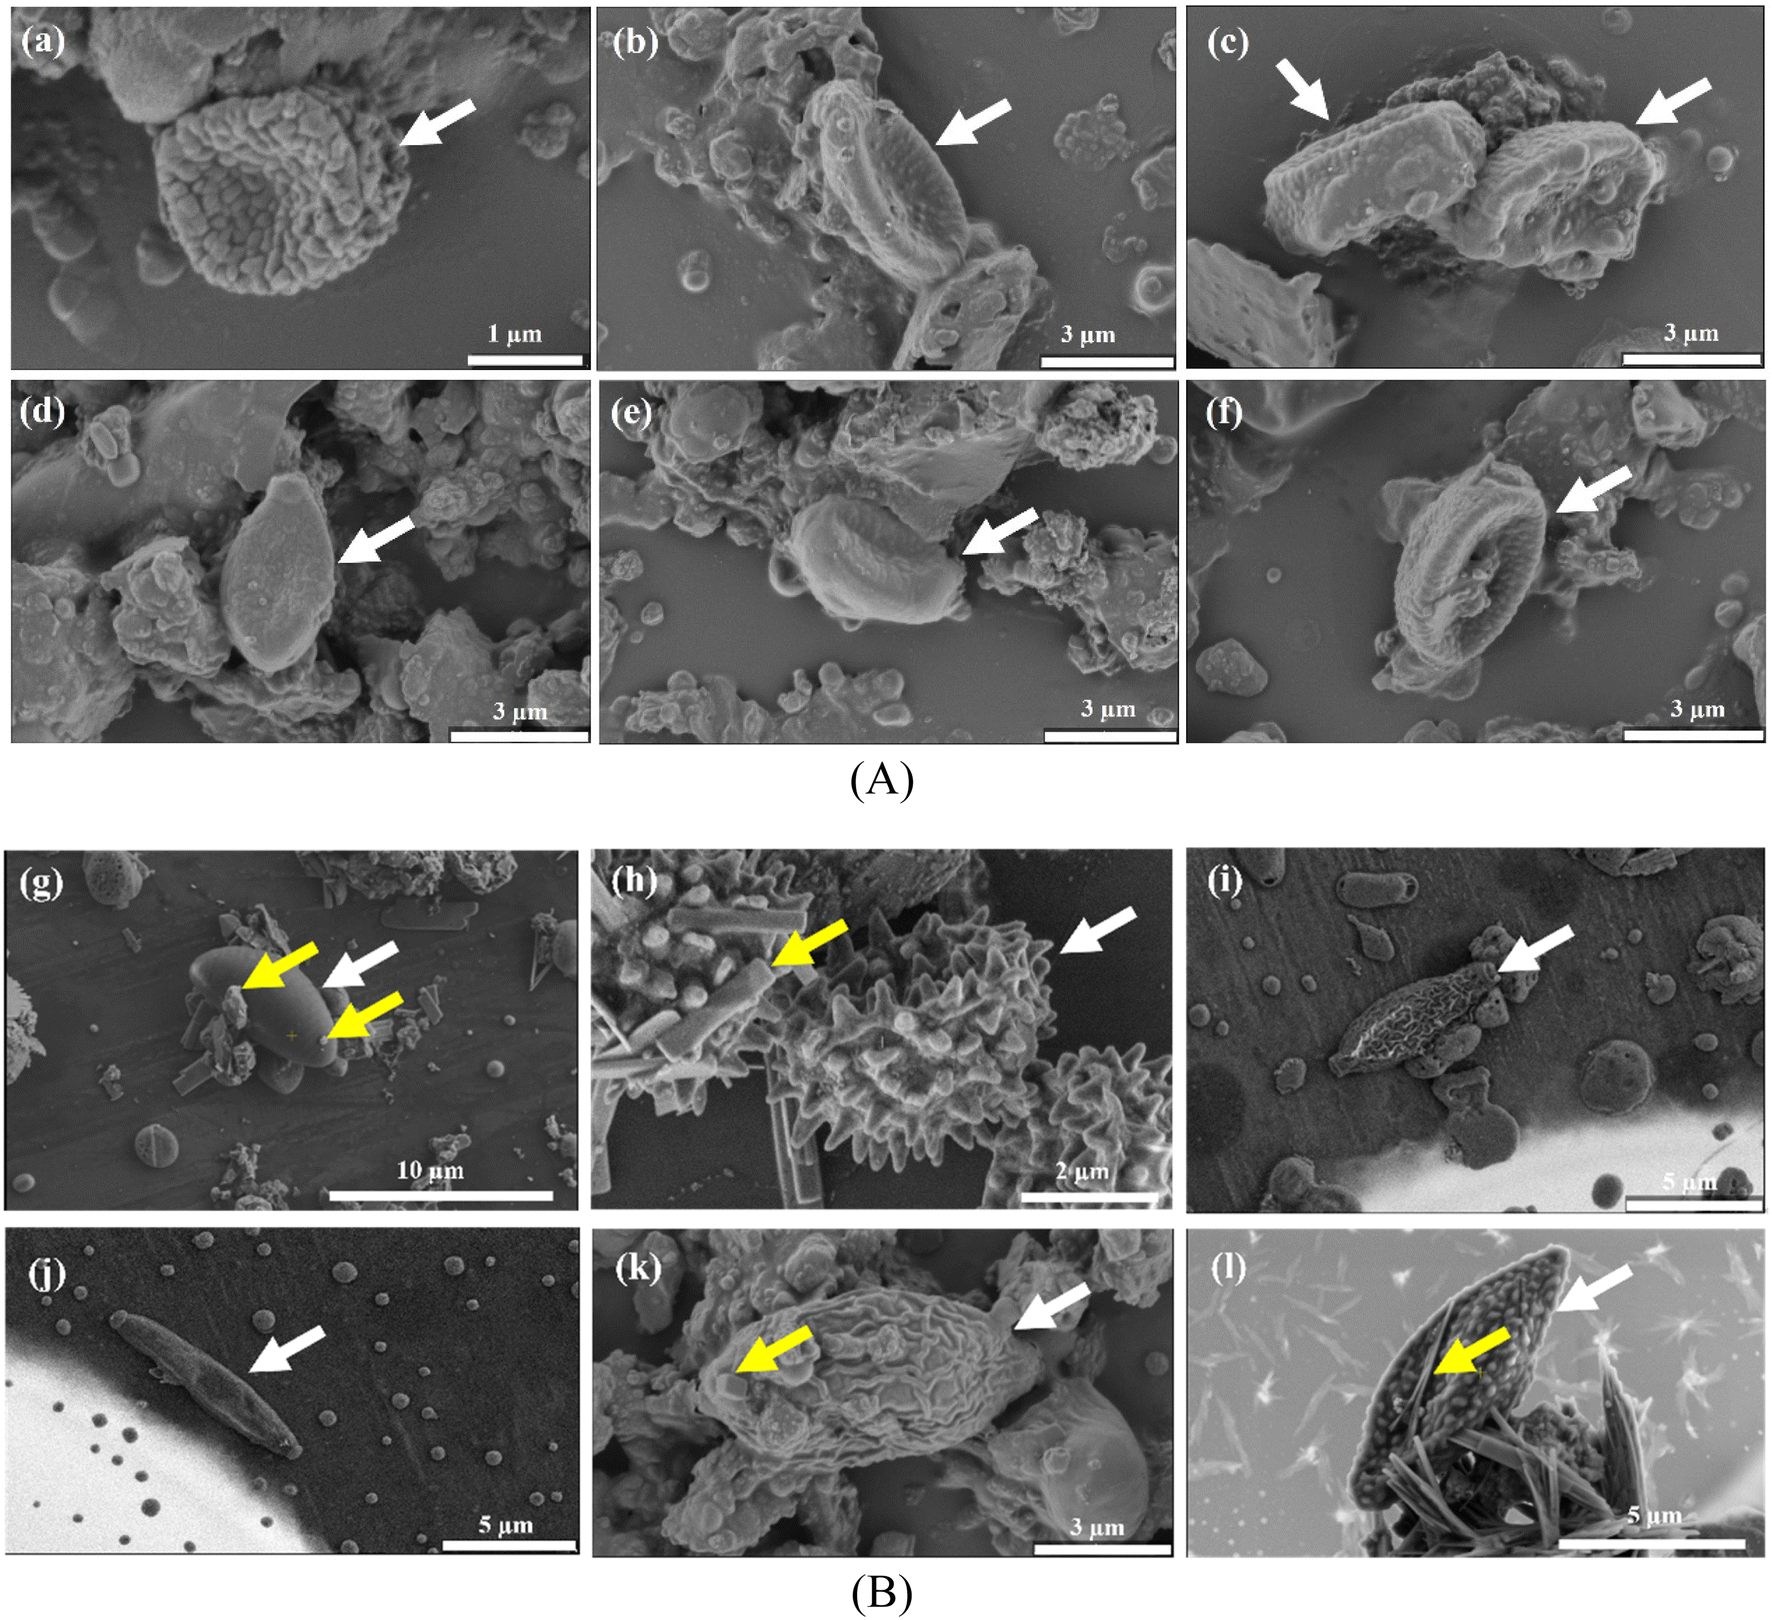 | ||
| Fig. 5 Scanning electron microscopic images of fungal spores that were speculated to be (A) Basidiomycota and (B) Ascomycota. Spores were of varying sizes and shapes. The scale varies for each panel and is shown at the bottom. | ||
Some fungal genera (with white arrows) could be identified based on the cell size and morphological characteristics. Most spores appeared single, as shown in Fig. 5, while some were either aggregated or in chains (Fig. S8†). Fig. 5(A) indicates that spores are presumably categorized as Basidiospores based on their distinct morphological characteristics. They mostly appeared in ovoid, subglobular, or elongated shapes with slightly wrinkled surfaces and an apiculus at one end. General morphology further suggested that these spores were Agaricomycetes.67,68 Ascospores are shown in Fig. 5(B) and exhibited versatile morphology. We speculated that the spore (Fig. 5(g)) belonged to the genus Daldinia. The morphological characteristics of Daldinia are that it has an ellipsoidal shape with narrowly rounded ends and transverse striation on its surface.68,69Fig. 5(h) can tentatively be attributed to the conidia of a Penicillium or an Aspergillus species following Wittmaack studies.70Fig. 5(i)–(l) showed spores which could presumably belong to the Cladosporium.68,70
4. Conclusion
This study unveiled the airborne fungi and bacteria in PM2.5 in the megacity Shanghai, and nycterohemeral cycle effects on airborne microbiota under good air quality. The improved air quality effectively resulted in low airborne fungal and bacteria counts. For nycterohemeral comparison, no apparent discrepancy was found in fungal and bacterial DNA concentration. The airborne microbial community structure displayed similarities, dominated by Formitopsidaceae, Meruliaceae, Aspergillaceae, Rhizobiaceae, Caulobacteraceae, and Moraxellaceae. In assessing the health risks of potential pathogens, the nocturnal samples contained a higher fungal relative abundance, and diurnal samples had a higher proportion of potentially pathogenic bacteria. The air quality exerted limited effects, except SO2, which inhibited the fungal concentrations significantly. The observation of fungi by SEM revealed the intact cell structure and the surface harboured chemical composition. This study provides important insights into airborne fungi and bacteria.Author contributions
Xueyun Geng: conceptualization, methodology, formal analysis, methodology, writing – original draft. Changliang Nie: software, formal analysis, writing – review & editing. Hui Chen: formal analysis, Xu Tang: writing – review & editing, Min Wei: formal analysis, writing – review & editing, Yi Wang: formal analysis, Huanxiang Gao: formal analysis, Dan Li: formal analysis, Mingliang Fang: writing – review & editing, Ruiting Ju: formal analysis, Bo Li: writing – review & editing, Haidong Kan: writing – review & editing, Renjie Chen: writing – review & editing, Jinzhuo Zhao: formal analysis, writing – review & editing, Lin Wang: writing – review & editing, Jianmin Chen: supervision, writing – review & editing, and funding acquisition. All of the authors were involved in the writing and review of the manuscript, and approved the final version of the manuscript.Conflicts of interest
The authors declare that they have no known competing financial interests or personal relationships that could have appeared to influence the work reported in this paper.Acknowledgements
This work was sponsored by the National Key Research and Development Program of China (2023YFC3708203), the National Natural Science Foundation of China (Grant No. 91843301 and 92043301), and Science & Technology Commission of Shanghai Municipality (No. 21DZ1202300 and 21230780200).References
- R. Jaenicke, Abundance of cellular material and proteins in the atmosphere, Science, 2005, 308(5718), 73 CrossRef CAS PubMed.
- Y. Zhai, X. Li, T. Wang, B. Wang, C. Li and G. Zeng, A review on airborne microorganisms in particulate matters: composition, characteristics and influence factors, Environ. Int., 2018, 113, 74–90 CrossRef PubMed.
- A. Núñez, A. M. García, D. A. Moreno and R. Guantes, Seasonal changes dominate long-term variability of the urban air microbiome across space and time, Environ. Int., 2021, 150, 106423 CrossRef PubMed.
- T. Ruiz-Gil, J. J. Acuña, S. Fujiyoshi, D. Tanaka, J. Noda and F. Maruyama, et al., Airborne bacterial communities of outdoor environments and their associated influencing factors, Environ. Int., 2020, 145, 106156 CrossRef PubMed.
- S. Jiang, B. Sun, R. Zhu, R. Wang and H. Dai, Airborne microbial community structure and potential pathogen, Sci. Total Environ., 2022, 154665 CrossRef CAS PubMed.
- C. Nie, X. Geng, H. Ouyang, L. Wang, Z. Li and M. Wang, et al., Abundant bacteria and fungi attached to airborne particulates in vegetable plastic greenhouses, Sci. Total Environ., 2023, 857, 159507 CrossRef CAS PubMed.
- J. Fröhlich-Nowoisky, C. J. Kampf, B. Weber, J. A. Huffman, C. Pöhlker and M. O. Andreae, et al., Bioaerosols in the earth system: climate, health, and ecosystem interactions, Atmos. Res., 2016, 182(182), 346–376 CrossRef.
- C. E. Morris, D. C. Sands, M. Bardin, R. Jaenicke, B. Vogel and C. Leyronas, et al., Microbiology and atmospheric processes: research challenges concerning the impact of airborne micro-organisms on the atmosphere and climate, Biogeosciences, 2011, 8(1), 17–25 CrossRef CAS.
- M. Yao, Bioaerosol: a bridge and opportunity for many scientific research fields, J. Aerosol Sci., 2018, 115, 108–112 CrossRef CAS.
- R. M. Bowers, N. Clements, J. B. Emerson, C. Wiedinmyer, M. P. Hannigan and N. Fierer, Seasonal variability in bacterial and fungal diversity of the near-surface atmosphere, Environ. Sci. Technol., 2013, 47(21), 12097–12106 CrossRef CAS PubMed.
- H. Li, X. Zhou, X. Yang, Y. Zhu, Y. Hong and J. Su, Spatial and seasonal variation of the airborne microbiome in a rapidly developing city of China, Sci. Total Environ., 2019, 665, 61–68 CrossRef CAS PubMed.
- E. J. Flies, L. J. Clarke, B. W. Brook and P. Jones, Urbanisation reduces the abundance and diversity of airborne microbes-but what does that mean for our health? A systematic review, Sci. Total Environ., 2020, 738, 140337 CrossRef CAS PubMed.
- The World Bank, Urban population data, Prospect, United Nations, World Urban, 2015, http://data.worldbank.org/indicator/SP.URB.TOTL.IN.ZS, accessed date: 25 November 2016 Search PubMed.
- F. Shen, Y. Zheng, M. Niu, F. Zhou, Y. Wu and J. Wang, et al., Characteristics of biological particulate matters at urban and rural sites in the North China Plain, Environ. Pollut., 2019, 253, 569–577 CrossRef CAS PubMed.
- M. Niu, W. Hu, B. Cheng, L. Wu, L. Ren and J. Deng, et al., Influence of rainfall on fungal aerobiota in the urban atmosphere over Tianjin, China: a case study, Atmos. Environ.:X, 2021, 12, 100137 CAS.
- X. Zhang, Z. Li, J. Hu, L. Yan, Y. He and X. Li, et al., The biological and chemical contents of atmospheric particulate matter and implication of its role in the transmission of bacterial pathogenesis, Environ. Microbiol., 2021, 23(9), 5481–5486 CrossRef CAS PubMed.
- M. Wei, H. Liu, J. Chen, C. Xu, J. Li and P. Xu, et al., Effects of aerosol pollution on PM2.5-associated bacteria in typical inland and coastal cities of northern China during the winter heating season, Environ. Pollut., 2020, 262, 114188 CrossRef CAS PubMed.
- L. Zhang, H. Xu, C. Guo, J. Chen, C. Dong and J. Zhang, et al., Constructing an air quality health index for children: a case study in Shanghai, China, Atmos. Environ., 2021, 267, 118765 CrossRef CAS.
- Q. Ma, Y. Qi, Q. Shan, S. Liu and H. He, Understanding the knowledge gaps between air pollution controls and health impacts including pathogen epidemic, Environ. Res., 2020, 189, 109949 CrossRef CAS PubMed.
- X. Sun, D. Li, B. Li, S. Sun, J. Geng and L. Ma, et al., Exploring the effects of haze pollution on airborne fungal composition in a cold megacity in Northeast China, J. Clean. Prod., 2021, 280, 124205 CrossRef CAS.
- Z. Xie, S. Du, T. Ma, J. Hou, X. Zeng and Y. Li, High time–resolved characterization of airborne microbial community during a typical haze pollution process, J. Hazard. Mater., 2021, 415, 125722 CrossRef CAS PubMed.
- Z. Xie, C. Fan, R. Lu, P. Liu, B. Wang and S. Du, et al., Characteristics of ambient bioaerosols during haze episodes in China: a review, Environ. Pollut., 2018, 243, 1930–1942 CrossRef CAS PubMed.
- Z. Hu, H. Liu, H. Zhang, X. Zhang, M. Zhou and L. Lou, et al., Temporal discrepancy of airborne total bacteria and pathogenic bacteria between day and night, Environ. Res., 2020, 186, 135027 Search PubMed.
- X. Zeng, S. Kong, S. Zheng, Y. Cheng, F. Wu and Z. Niu, et al., Variation of airborne DNA mass ratio and fungal diversity in fine particles with day–night difference during an entire winter haze evolution process of Central China, Sci. Total Environ., 2019, 694, 133802 CrossRef CAS PubMed.
- W. Li, L. Liu, L. Xu, J. Zhang, Q. Yuan and X. Ding, et al., Overview of primary biological aerosol particles from a Chinese boreal forest: insight into morphology, size, and mixing state at microscopic scale, Sci. Total Environ., 2020, 719, 137520 CrossRef CAS PubMed.
- M. Wei, M. Li, C. Xu, P. Xu and H. Liu, Pollution characteristics of bioaerosols in PM2.5 during the winter heating season in a coastal city of northern China, Environ. Sci. Pollut. Res., 2020, 27(22), 27750–27761 CrossRef CAS PubMed.
- M. Wei, Z. Yu and H. Zhang, Microbial diversity and abundance in a representative small-production coal mine of central China, Energy Fuel, 2013, 27(7), 3821–3829 CrossRef CAS.
- M. Wei, Z. Yu and H. Zhang, Molecular characterization of microbial communities in bioaerosols of a coal mine by 454 pyrosequencing and real-time PCR, J. Environ. Sci.-China, 2015, 30, 241–251 CrossRef CAS PubMed.
- S. Chen, Y. Zhou, Y. Chen and J. Gu, Fastp: an ultra-fast all-in-one FASTQ preprocessor, Bioinformatics, 2018, 34(17), i884–i890 CrossRef PubMed.
- T. Magoc and S. L. Salzberg, FLASH: fast length adjustment of short reads to improve genome assemblies, Bioinformatics, 2011, 27(21), 2957–2963 CrossRef CAS PubMed.
- E. Stackebrandt and B. M. Goebel, Taxonomic note: a place for DNA-DNA reassociation and 16S rRNA sequence analysis in the present species definition in bacteriology, Int. J. Syst. Bacteriol., 1994, 44(4), 846–849 CrossRef CAS.
- R. C. Edgar, UPARSE: highly accurate OTU sequences from microbial amplicon reads, Nat. Methods, 2013, 10(10), 996–998 CrossRef CAS PubMed.
- Q. Wang, G. M. Garrity, J. M. Tiedje and J. R. Cole, Naive bayesian classifier for rapid assignment of rRNA sequences into the new bacterial taxonomy, Appl. Environ. Microb., 2007, 73(16), 5261–5267 CrossRef CAS PubMed.
- M. Wei, C. Xu, X. Xu, C. Zhu, J. Li and G. Lv, Characteristics of atmospheric bacterial and fungal communities in PM2.5 following biomass burning disturbance in a rural area of North China Plain, Sci. Total Environ., 2019, 651, 2727–2739 CrossRef CAS PubMed.
- J. Xie, L. Jin, T. He, B. Chen, X. Luo and B. Feng, et al., Bacteria and antibiotic resistance genes (ARGs) in PM2.5 from China: implications for human exposure, Environ. Sci. Technol., 2019, 53(2), 963–972 CrossRef CAS PubMed.
- M. Gao, A. Yu, M. Chen, T. Qiu, Y. Guo and X. Sun, et al., Airborne fungi and human exposure in different areas of composting facilities, Ecotoxicol. Environ. Saf., 2022, 243, 113991 CrossRef CAS PubMed.
- E. S. Gusareva, E. Acerbi, K. J. X. Lau, I. Luhung, B. N. V. Premkrishnan and S. Kolundžija, et al., Microbial communities in the tropical air ecosystem follow a precise diel cycle, Proc. Natl. Acad. Sci. U. S. A., 2019, 116(46), 23299–23308 CrossRef CAS PubMed.
- L. Ma, S. D. Yabo, L. Lu, J. Jiang, F. Meng and H. Qi, Seasonal variation characteristics of inhalable bacteria in bioaerosols and antibiotic resistance genes in Harbin, J. Hazard. Mater., 2023, 446, 130597 CrossRef CAS PubMed.
- W. Elbert, P. E. Taylor, M. O. Andreae and U. Pöschl, Contribution of fungi to primary biogenic aerosols in the atmosphere: wet and dry discharged spores, carbohydrates, and inorganic ions, Atmos. Chem. Phys., 2007, 7(17), 4569–4588 CrossRef CAS.
- Y. Igarashi, K. Kita, T. Maki, T. Kinase, N. Hayashi and K. Hosaka, et al., Fungal spore involvement in the resuspension of radiocaesium in summer, Sci. Rep.-UK, 2019, 9, 1954 CrossRef PubMed.
- Y. Pan, L. Luo, H. Xiao, R. Zhu and H. Xiao, Spatial variability of inhalable fungal communities in airborne PM2.5 across Nanchang, China, Sci. Total Environ., 2020, 746, 141171 CrossRef CAS PubMed.
- C. Cao, W. Jiang, B. Wang, J. Fang, J. Lang and G. Tian, et al., Inhalable microorganisms in Beijing's PM2.5 and PM10 pollutants during a severe smog event, Environ. Sci. Technol., 2014, 48(3), 1499–1507 CrossRef CAS PubMed.
- M. Fragola, M. R. Perrone, P. Alifano, A. Talà and S. Romano, Seasonal variability of the airborne eukaryotic community structure at a coastal site of the central mediterranean, Toxins, 2021, 13(8), 518 CrossRef CAS PubMed.
- J. Fröhlich-Nowoisky, D. A. Pickersgill, V. R. Després and U. Pöschl, High diversity of fungi in air particulate matter, Proc. Natl. Acad. Sci. U. S. A., 2009, 106(31), 12814–12819 CrossRef PubMed.
- J. Wessels, O. De Vries, S. A. Asgeirsdottir and F. Schuren, Hydrophobin genes involved in formation of aerial hyphae and fruit bodies in Schizophyllum, Plant Cell, 1991, 3(8), 793–799 CrossRef CAS.
- R. Yu, S. Wang, X. Wu, L. Shen, Y. Liu and J. Li, et al., Community structure variation associated with airborne particulate matter at central south of China during hazy and nonhazy days, Atmos. Pollut. Res., 2019, 10(5), 1536–1542 CrossRef.
- H. Liu, X. Zhang, H. Zhang, X. Yao, M. Zhou and J. Wang, et al., Effect of air pollution on the total bacteria and pathogenic bacteria in different sizes of particulate matter, Environ. Pollut., 2018, 233, 483–493 CrossRef CAS PubMed.
- H. Gou, J. Lu, S. Li, Y. Tong, C. Xie and X. Zheng, Assessment of microbial communities in PM1 and PM10 of Urumqi during winter, Environ. Pollut., 2016, 214, 202–210 CrossRef CAS PubMed.
- R. Garrido-Oter, R. T. Nakano, N. Dombrowski, K. Ma, A. C. Mchardy and P. Schulze-Lefert, Modular traits of the Rhizobiales root microbiota and their evolutionary relationship with symbiotic Rhizobia, Cell Host Microbe, 2018, 24(1), 155–167 CrossRef CAS PubMed.
- V. Després, J. A. Huffman, S. M. Burrows, C. Hoose, A. Safatov and G. Buryak, et al., Primary biological aerosol particles in the atmosphere: a review, Tellus B, 2012, 64(1), 15598 CrossRef.
- E. M. Bik, Composition and function of the human-associated microbiota, Nutr. Rev., 2009, 67, S164–S171 CrossRef PubMed.
- J. P. Lopes and M. S. Lionakis, Pathogenesis and virulence of Candida albicans, Virulence, 2022, 13, 89–121 CrossRef CAS PubMed.
- W. E. Horner, A. Helbling, J. E. Salvaggio and S. B. Lehrer, Fungal Allergens, Clin. Microbiol. Rev., 1995, 161–179 CrossRef CAS PubMed.
- M. J. Noto, K. L. Boyd, W. J. Burns, M. G. Varga, R. M. Peek and E. P. Skaar, Toll-like receptor 9 contributes to defense against Acinetobacter baumannii infection, Infect. Immun., 2015, 83(10), 4134–4141 CrossRef CAS PubMed.
- Y. Zhou, Y. Lai, X. Tong, M. H. Y. Leung, J. C. K. Tong and I. A. Ridley, et al., Airborne bacteria in outdoor air and air of mechanically ventilated buildings at city scale in Hong Kong across seasons, Environ. Sci. Technol., 2020, 54(19), 11732–11743 CrossRef CAS PubMed.
- E. Depoorter, M. J. Bull, C. Peeters, T. Coenye, P. Vandamme and E. Mahenthiralingam, Burkholderia: an update on taxonomy and biotechnological potential as antibiotic producers, Appl. Microbiol. Biotechnol., 2016, 100(12), 5215–5229 CrossRef CAS PubMed.
- B. Sánchez-Parra, A. Núñez and D. A. Moreno, Preventing legionellosis outbreaks by a quick detection of airborne Legionella pneumophila, Environ. Res., 2019, 171, 546–549 CrossRef PubMed.
- A. Waśkiewicz and L. Irzykowska, Flavobacterium spp-characteristics, occurrence, and toxicity, in Encyclopedia of Food Microbiology, 2nd edn, 2014, pp. 938–942 Search PubMed.
- F. F. Graham, A. H. M. Kim, M. G. Baker, C. Fyfe and S. Hales, Associations between meteorological factors, air pollution and Legionnaires' disease in New Zealand: time series analysis, Atmos. Environ., 2023, 296, 119572 CrossRef CAS.
- Q. Zhen, Y. Deng, Y. Wang, X. Wang, H. Zhang and X. Sun, et al., Meteorological factors had more impact on airborne bacterial communities than air pollutants, Sci. Total Environ., 2017, 601–602, 703–712 CrossRef CAS PubMed.
- G. H. Wang, B. H. Zhou, C. L. Cheng, J. J. Cao, J. J. Li and J. J. Meng, et al., Impact of Gobi desert dust on aerosol chemistry of Xi'an, inland China during spring 2009: differences in composition and size distribution between the urban ground surface and the mountain atmosphere, Atmos. Chem. Phys., 2013, 13(2), 819–835 CrossRef.
- K. Wei, Y. Zheng, J. Li, F. Shen, Z. Zou and H. Fan, et al., Microbial aerosol characteristics in highly polluted and near-pristine environments featuring different climatic conditions, Sci. Bull., 2015, 60(16), 1439–1447 CrossRef CAS.
- K. Whangchai, K. Saengnil and J. Uthaibutra, Effect of ozone in combination with some organic acids on the control of postharvest decay and pericarp browning of longan fruit, Crop Prot., 2006, 25(8), 821–825 CrossRef CAS.
- H. Wang, B. Zhu, L. Shen, H. Xu, J. An and C. Pan, et al., Regional characteristics of air pollutants during heavy haze events in the Yangtze River Delta, China, Aerosol Air Qual. Res., 2016, 16(9), 2159–2171 CrossRef CAS.
- E. Tordoni, C. G. Ametrano, E. Banchi, S. Ongaro, A. Pallavicini and G. Bacaro, et al., Integrated eDNA metabarcoding and morphological analyses assess spatio-temporal patterns of airborne fungal spores, Ecol. Indic., 2021, 121, 107032 CrossRef.
- N. Abrego, V. Norros, P. Halme, P. Somervuo, H. Ali-Kovero and O. Ovaskainen, Give me a sample of air and I will tell which species are found from your region: molecular identification of fungi from airborne spore samples, Mol. Ecol. Resour., 2018, 18(3), 511–524 CrossRef PubMed.
- D. Ertz, J. D. Lawrey, M. Sikaroodi, P. M. Gillevet, E. Fischer and D. Killmann, et al., A new lineage of lichenized basidiomycetes inferred from a two-gene phylogeny: the Lepidostromataceae with three species from the tropics, Am. J. Bot., 2008, 95(12), 1548–1556 CrossRef CAS PubMed.
- A. E. Valsan, H. Priyamvada, R. Ravikrishna, V. R. Després, C. V. Biju and L. K. Sahu, et al., Morphological characteristics of bioaerosols from contrasting locations in southern tropical India-A case study, Atmos. Environ., 2015, 122, 321–331 CrossRef CAS.
- M. Stadler, M. Baumgartner, K. Ide, A. Popp and H. Wollweber, Importance of ascospore ornamentation in the taxonomy of Daldinia, Mycol. Prog., 2002, 1(1), 31–42 CrossRef.
- K. Wittmaack, H. Wehnes, U. Heinzmann and R. Agerer, An overview on bioaerosols viewed by scanning electron microscopy, Sci. Total Environ., 2005, 346(1–3), 244–255 CrossRef CAS PubMed.
- F. Xue, Y. Yang, S. Zou, Y. Zhang, D. Yue and Y. Zhao, et al., Characterization of airborne bacteria and fungi at a land-sea transition site in Southern China, Sci. Total Environ., 2022, 849, 157786 CrossRef CAS PubMed.
Footnote |
| † Electronic supplementary information (ESI) available. See DOI: https://doi.org/10.1039/d3ea00141e |
| This journal is © The Royal Society of Chemistry 2024 |