DOI:
10.1039/C9RA10073C
(Paper)
RSC Adv., 2020,
10, 12451-12459
CO2 hydrate formation kinetics based on a chemical affinity model in the presence of GO and SDS
Received
2nd December 2019
, Accepted 26th February 2020
First published on 1st April 2020
Abstract
Hydrate generation promotion and kinetic models are key issues in the hydrate utilization technology. The formation kinetics of CO2 hydrates in a graphene oxide (GO) and sodium dodecyl sulfate (SDS) compounding accelerator system was studied experimentally, and the influences of different concentrations on the hydrate formation time and gas consumption were revealed. The results show that with the combination of GO and SDS, the formation rate of CO2 hydrates was accelerated, the induction time and generation time were shortened, and the gas consumption increased. The optimal compounding concentration was 0.005% GO and 0.2% SDS. Compared with the observations for pure water and a single 0.005% GO system, the hydrate formation time was shortened by 69.7% and 12.2%, respectively, and the gas consumption increased by 11.24% and 3.2%. A chemical affinity model of CO2 hydrate formation was established for this system. The effects of the GO and SDS compound ratio, temperature and pressure on the chemical affinity model parameters were studied from the model point of view. On using Matlab to program the model and compare it with the experimental results, very good agreement was achieved. Through research, the chemical affinity model can accurately predict the formation of hydrates in complex systems.
1 Introduction
Gas hydrates are non-stoichiometric ice clathrates1 formed by host molecules (water) and guest molecules (gas molecules) at a low temperature and high pressure. Usually, 1 cubic meter of hydrates can decompose 160–180 cubic meters of gas.2 Due to the high gas storage characteristics of hydrates and the different temperature and pressure equilibrium conditions of different gas-forming hydrates, they have broad application prospects in natural gas storage and transportation,3,4 refrigeration technology,5 seawater desalination,6 gas separation,7 etc. The key to this technology is how to reduce the generation conditions, increase the generation speed by various means, and establish the corresponding dynamics calculation model.
At present, the methods for enhancing the formation of gas hydrates are mainly classified into physical strengthening and chemical strengthening. The physical strengthening method involves increasing the contact area of gas–liquid, enhancing the mass transfer and heat transfer to realize the rapid formation of gas hydrates.8 Common methods include the stirring method,9 bubbling method,10 spray method11 and field method.12 The chemical strengthening method involves promoting the formation of hydrates by adding a promoter to reduce the surface tension and change the microstructure.13,14 Hydrate accelerators are divided into thermodynamic accelerators and kinetic accelerators. The most widely used accelerators include tetrahydrofuran (THF),15 sodium dodecyl sulfate (SDS),16 sodium dodecyl benzene sulfonate (SDBS),17 and tetrabutyl ammonium bromide (TBAB).18 Studies have shown that SDS19 is an effective additive to promote the rapid formation of gas hydrates. Scholars have also researched the formation characteristics of gas hydrates by nanoparticles such as Al2O3, CuO, SiO2 and carbon nanotubes.20–23 Yan S.24 studied the effects of solvents containing graphene oxide (GO for short) nanoparticles on the formation of CO2 hydrates. The experimental results showed that GO can enhance nucleation efficiency and heat and mass transfer efficiency, shorten the induction time, increase gas storage capacity, and reduce equilibrium pressure; it is also non-toxic and harmless to the environment due to its unique microstructure and properties. In addition, researchers25 complexed nano-graphite particles and SDS and found that the compounding system could shorten the induction time and accelerate the nucleation rate but did not give a kinetic model.
At present, common methods for predicting changes in the temperature–pressure and other parameters during hydrate formation include the empirical formula method, phase equilibrium calculation method, statistical thermodynamic model method and graphic method. According to different entry points of hydrate formation conditions and research problems, many models have been established, such as the heat and mass transfer model,26 gas consumption rate semi-empirical model27 and so on. However, due to the randomness and complexity of the hydrate formation process, especially in systems with additives, the existing models cannot be applied to various working conditions and some parameters are not easy to measure. As a result, there are large model errors and the formation of hydrate cannot be accurately predicted.
Chemical affinity is the general driving force for chemical reactions. All chemical reactions proceed toward a decrease in chemical affinity. At the end of the reaction, the chemical affinity is zero. The model is based on the principle of thermodynamics and can be used to predict the rate of hydrate formation. It is characterized by a relatively simple and easy solution and does not require difficult parameters such as heat transfer and mass transfer coefficients and so on. The rate of hydrate formation can be predicted as long as macroscopic data such as system temperature and pressure and so on, are available. The model has attracted the attention of many researchers. Varaminian et al.28,29 used the chemical affinity model to study the kinetics of hydrate formation in different systems. The calculated results agreed well with the experimental results.
In 2019, Khurana et al.30 undertook CH4–THF uptake modelling by first performing thermodynamic modelling. The model was then validated for CH4–THF and CO2–THF systems with varying THF concentrations. They proposed a 2 step CH4–THF hydrate growth model and a mass transfer-based model. Insights from the model were discussed and the optimum reactor configuration for SNG application was obtained. Dashti et al.31 presented a new variation of the shrinking core model (SCM) and a model-based estimation of the induction time. The proposed concept is generic enough to be used for the CH4 hydration process too. In 2020, Zhang et al.32 employed the Magnetic Resonance Imaging technique to analyze the hydrate growth micro-processes for greenhouse gases (CO2, CH4, and various fractions of CO2–CH4 mixed gases) and volatile organic compound (simulated by C2H4 and C2H2 gases) capture and storage. A multi-pressure control mechanism for secondary hydrate growth was developed to promote CO2 capture and storage.
SDS is a well-studied and effective hydrate kinetic accelerator. GO has unique microstructure and surface functional groups, and it can promote both thermodynamics and kinetics of hydrate. In this paper, through the combination of theoretical analysis and experimental research, the characteristics of CO2 hydrate formation in the complex system of GO and SDS were studied, and the effects of concentration, temperature and the pressure of the complex accelerator on the formation of CO2 hydrate were investigated. The change in gas consumption with time in the process of the formation and growth of CO2 hydrate crystals was analyzed by using the chemical affinity model, which provides theoretical guidance for the development of gas hydrate formation promotion technology.
2 Experiments
2.1 Experimental device
An electronic scale (Shanghai Yueping Scientific Instrument Co. LTD.), with standard deviation of ±0.0002 g and model number FA2104B, was used to weigh the experimental materials, and an ultrasonic processor (Shanghai Shengxi Ultrasonic Instrument Co. LTD.) with model number FS-1200N was used to conduct ultrasonic oscillation on large GO particles and SDS nanomaterials. The experiment was carried out by using a high-pressure magnetic power stirring hydrate-generating device, which was mainly comprised of a high-pressure gas supply system, an air intake system, a high-pressure reactor generating device, a constant temperature cooling water tank and a circulating water bath device, a fiber optic camera system and a data acquisition system. The CO2 gas was injected into the high-pressure reactor from the high pressure gas cylinder through the pressure pump and the air compressor. The spherical high-pressure reaction kettle was the main reaction device for the hydrate formation. The design pressure was 30 MPa, the design temperature was 0–20 °C, and the visual kettle volume was 500 ml. The constant temperature refrigerating water tank was filled with a solution of ethylene glycol and water in a 3![[thin space (1/6-em)]](https://www.rsc.org/images/entities/char_2009.gif) :
:![[thin space (1/6-em)]](https://www.rsc.org/images/entities/char_2009.gif) 1 ratio. The circulating water bath device (THD-2030 type) had a temperature control range of −15–20 °C. The temperature control accuracy was ±0.1 °C; the fiber optic camera system was capable of observing and recording the changes in the kettle and the hydrate formation process; the data acquisition system mainly recorded the pressure and temperature changes and collected data through the Agilent 34972a data acquisition instrument. The hydrate formation experimental device is shown in Fig. 1.
1 ratio. The circulating water bath device (THD-2030 type) had a temperature control range of −15–20 °C. The temperature control accuracy was ±0.1 °C; the fiber optic camera system was capable of observing and recording the changes in the kettle and the hydrate formation process; the data acquisition system mainly recorded the pressure and temperature changes and collected data through the Agilent 34972a data acquisition instrument. The hydrate formation experimental device is shown in Fig. 1.
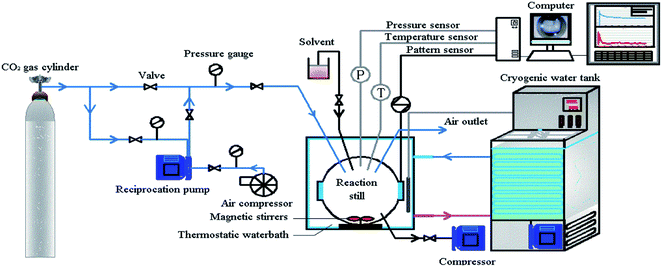 |
| | Fig. 1 Schematic diagram of the experimental device. | |
2.2 Experimental materials
The specifications of the experimental materials are shown in Table 1.
Table 1 Specifications of experimental materials
| Component |
Purity |
Supplier |
| Carbon dioxide |
≥99.8% |
Jinghua Co. LTD (China) |
| Distilled water |
≥99.9% |
Changzhou University (China) |
| Sodium dodecyl sulfate |
≥99% |
Sihewei Chemical Co. LTD (China) |
| GO |
≥99% |
Jiangnan Graphene Institute (China) |
2.3 Experimental steps
2.3.1 Configure reagents. The mass fractions were 0.003%, 0.005%, 0.01%, 0.02% for GO and 0.005%, 0.1%, 0.2%, and 0.3% for SDS. According to the experimental requirements, appropriate amounts of GO and SDS were weighed in an electronic balance and placed in a beaker, then 170 ml of distilled water was added and the mixture was subjected to ultrasonic vibration for 20 to 30 minutes to obtain a uniformly dispersed compounding reagent.
2.3.2 Experimental preparation. Before each experiment, the reactor was washed three times with distilled water and then rinsed once with a compounding reagent. The vacuum pump was opened and the reaction kettle and the pipeline were vacuumed for 4–5 min until the pressure in the autoclave reached about −0.1 MPa. The reagent was sucked into the kettle by vacuum and pumping was continued for 4–5 min for the extraction of gases from the kettle and solution.
2.3.3 Generate an experiment. The low-temperature water-bath system was turned on and the experimental temperature value was set and allowed to stabilize for 20–30 min. The CO2 cylinder valve was opened slightly and the kettle was slowly pressurized with the booster pump and air compressor. After the intake, the magnetic stirrer was turned on to increase the gas–liquid contact area, and the formation of CO2 hydrate was accelerated. The equilibrium conditions of the hydrate formation phase were determined by the constant temperature pressure search method.33 The formation of hydrate in the autoclave was observed using a fiber-optic camera, and the temperature, pressure change, and reaction time were recorded by a data acquisition instrument. Since the formation of hydrate is a random process, the data obtained from the experiment are the average values obtained after multiple experiments.
3 Chemical affinity model
For a chemical reaction, the chemical affinity Ai of the i state as the driving force in the reaction is expressed as follows:| |
Ai = −RT![[thin space (1/6-em)]](https://www.rsc.org/images/entities/char_2009.gif) ln(ζQi) ln(ζQi)
| (1) |
In which
| |
 | (2) |
Definition of Qi for reaction activity:
| |
 | (3) |
aj represents the activity of the components; j,
Vj represents the stoichiometric coefficient of the component j.
R is the molar gas constant;
T is the system temperature;
K represents the thermodynamic equilibrium constant. The reaction activity when the equilibrium state is reached is given by
Ai = 0, therefore.
A0i =
RT![[thin space (1/6-em)]](https://www.rsc.org/images/entities/char_2009.gif)
ln(
K).
ζQi indicates the extent to which the reaction is close to equilibrium.
For a closed, fixed volume and constant temperature system, the affinity decay rate can be expressed as follows:
| |
 | (4) |
Many related research results have shown that AT,V is inversely proportional to the time, so the following expression can be written for the affinity decay rate:
| |
 | (5) |
in which
Ar is the proportionality constant and denotes the affinity rate constant. By defining the time needed for the system to reach its equilibrium condition as
tk, when the reaction reaches the equilibrium state, the affinity decay rate
AT,V = 0, which gives
| |
 | (6) |
| |
 | (7) |
To correlate the parameters of the chemical affinity obtained from the experimental data with time, the two sides of eqn (7) are integrated separately:
| |
 | (8) |
When the reaction reaches equilibrium (tk), the affinity decay rate is 0, so
| |
 | (9) |
Eqn (9) is divided on both sides by (−RT), then
| |
 | (10) |
The degree of reaction as defined by reaction time is as follows.
| |
 | (11) |
Gas hydrate formation refers to the process in which solute molecules (gas molecules) and water molecules act to form hydrated molecules. The change in the driving force Ai during hydrate formation is related to gas consumption. Thus, the degree of hydrate formation can be expressed by the consumption of gas in the process of hydrate formation instead of activity. For hydrate formation, formula (2) can be written as follows:
| |
 | (12) |
| |
 | (13) |
The subscript 0 refers to the initial state and f is the equilibrium state. P is the system pressure; Z is the gas compression factor; nci and ncf are the numbers of moles of gas consumed at the reaction time ti and at equilibrium respectively; n0, ni, and nf represent the numbers of moles of gas in the initial state and at the times ti and tk of the reaction, respectively. From eqn (12) and (13),
| |
 | (14) |
Eqn (2) and (14) give
| |
 | (15) |
Eqn (10) and (15) give
| |
 | (16) |
Taking the logarithm of both sides of eqn (16) gives
| |
 | (17) |
which is:

as in
eqn (9).
In the formula: tk and  are the kinetic parameters of the chemical affinity model. The absolute value of the slope
 can be a normalized rate constant, so the value of this slope can be employed for investigating the effects of parameters such as initial pressure, temperature, and additives on the hydrate formation kinetics.
By plotting the experimental data of hydrate formation, a plot of Ai/RT and −ln[ti/tkexp(ti/tk)] can be made, and a straight line with zero intercept must be obtained. The slope of the line is −Ar/RT, from which the values of the model parameters tk and Ar can be obtained. The gas consumption amount nci in the hydrate formation process is predicted by formula (16).
The model parameter calculation logic relationship is shown in Fig. 2.
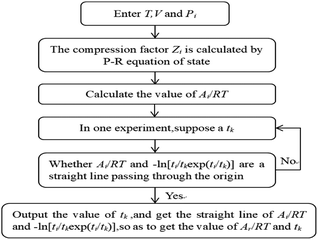 |
| | Fig. 2 The algorithm for the calculation of the parameters of the chemical affinity model. | |
Using Matlab software, according to the logical relationship of Fig. 2, the gas compression factor Zi, gas consumption nci, reaction equilibrium time tk, kinetic parameters Ar/RT, etc. were programmed.
4 Conclusion and analysis
4.1 The influence of the GO and SDS complex concentration on gas consumption
Fig. 3 and 4 show the changes in gas consumption in GO and SDS compound solutions with different concentrations at 281.15 K, 4 MPa and 450 rpm. Fig. 3 and 4 show that the gas consumption rate tends to gradually decrease and to be flat. This is mainly because both SDS and GO can reduce the surface tension of water and further increase the gas–liquid contact area under the action of stirring. The gas can be better dissolved in water, provide more nucleation sites, and promptly release the latent heat in the hydration reaction, so that the rate of hydrate formation is accelerated. As the hydration reaction continues, the pressure in the kettle gradually decreases, the driving force decreases, and the gas consumption rate becomes slow until the phase equilibrium is reached. The results show that in the range of 0–0.2% SDS concentration, as the concentration of SDS increases, the CO2 gas consumption rate will increase and the gas consumption will gradually increase. This is mainly because a moderate concentration can enhance the dissolution of CO2, thereby accelerating the production rate and increasing the gas storage density. When the concentration of SDS in the 0.005% GO compound system reached 0.2%, the gas consumption reached the maximum value (0.5639 mol), which was 11.24% and 3.2% higher than that of pure water and a single 0.005% GO system, respectively. As the concentration continues to increase, the gas consumption decreases; this indicates that there is an optimum value for the concentration of SDS in the 0.005% GO compound system, which is about 0.2%. Fig. 4 shows that when GO is less than 0.005%, the gas consumption is increased but when the concentration is higher than 0.005%, the gas consumption is decreased. This is mainly because both SDS and GO can reduce the surface tension during the hydration process, thereby reducing the heat and mass transfer resistance and increasing the gas consumption. The results indicate that there is an optimum compounding concentration of about 0.005% GO + 0.2% SDS. At this time, its function as a surfactant can be fully utilized, and the rate of hydrate formation and gas storage can also be maximized.
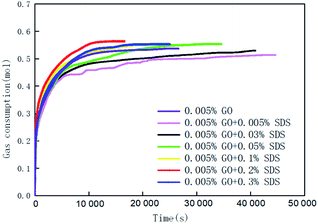 |
| | Fig. 3 The change curves of gas consumption versus time in systems with 0.005% GO compounded with different concentrations of SDS. | |
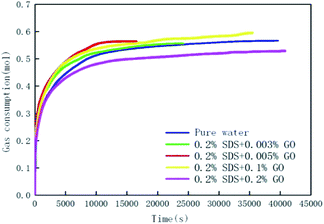 |
| | Fig. 4 The change curves of gas consumption versus time in the pure water system, 0.2% GO compounded with different concentrations of GO systems. | |
4.2 The influence of the GO and SDS compound concentration on the generation time
In the course of the hydration reaction, when the system pressure is almost constant within 30 min, it is regarded as the end of the reaction. The hydrate formation time is defined as the time from the start to the end of the reaction. Fig. 5 is a graph of the reaction time of the compound system with 0.005% GO in different concentrations of SDS. Fig. 6 is a graph showing the formation time of the CO2 hydrate in pure water and the compound system with 0.02% SDS and different concentrations of GO. From Fig. 5 and 6, it is considered that the generation time first decreases and then increases with the increase in additives in the compound system. This is mainly because the proper concentration can enhance the heat and mass transfer efficiency and make the GO distribution uniform and form more nucleation points, speed up the reaction rate and reduce the generation time. However, when the concentration increased to a certain value, the generation time increased. It was seen from the experiment that this is mainly because when the concentration of the compound system reaches a certain level, agglomeration occurs, the heat and mass transfer efficiency is lowered, the amount of gas of participating in the hydration reaction is reduced, the reaction rate is decreased, and the reaction time is increased. Therefore, there is an optimal concentration for the compound of GO and SDS. The analysis considers that the optimum concentration is about 0.005% GO and 0.2% SDS. At this concentration, compared with pure water and a single 0.005% GO system, the generation time was shortened by 38.50% and 58.12% respectively.
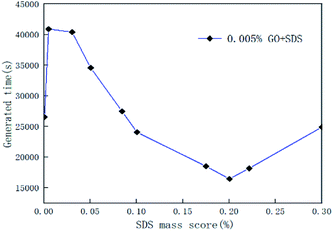 |
| | Fig. 5 Formation time of CO2 hydrate with 0.005% GO and different concentrations of SDS systems. | |
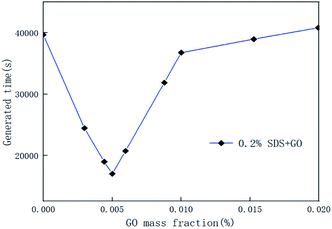 |
| | Fig. 6 Formation time of CO2 hydrate in the pure water system, and systems with 0.2% SDS and different concentrations of GO. | |
5 Chemical affinity model analysis
5.1 The influence of the model parameters on the compound from GO and SDS
By calculation, under the conditions of 281.15 K, 4 MPa and 450 rpm, the chemical affinity kinetic model parameters in the GO and SDS compounded systems with different mass fractions are shown in Table 2. It can be seen from the table that the compound solution made from GO and SDS can accelerate the reaction to reach equilibrium; the promotion effect of the compound system with 0.005% GO and 0.2% SDS is more obvious. In the compound system with 0.005% GO and 0.2% SDS, the rate of hydrate reaching equilibrium is was the fastest (tk = 10![[thin space (1/6-em)]](https://www.rsc.org/images/entities/char_2009.gif) 000 s), and the promoting effect was the most obvious (−Ar/RT = 0.2489). As the concentration of GO and SDS increased, the equilibrium pressure followed the trend of first increasing and then decreasing, and in the system with 0.005% GO + 0.2% SDS, the equilibrium pressure (Pf) was the lowest (about 1.8549 MPa). This is consistent with the previous experimental results. As a kind of high-efficiency surfactant, SDS can reduce the interfacial tension and change the hydrophilic and lipophilic properties of the interface. After proper ultrasonic vibration, a uniformly dispersed GO solution was obtained, and the interlayer spacing was reduced so that the interlayer van der Waals forces were reduced. The GO nanoparticles were more uniformly dispersed in the solution, remained stable, were less prone to agglomeration, and fully exerted the foaming and wetting properties of the surfactant. GO has a large surface area, the heat and mass transfer efficiency is fast, and the surface is randomly distributed with hydroxyl and epoxy groups; the carboxyl and carbonyl groups were introduced at the edges and so it is both hydrophilic and hydrophobic.24 The hydrophobic group makes it easier for CO2 to enter into the solution, and the hydrophilic group forms a hydrogen bond with water, increasing the probability of forming a hydrate.
000 s), and the promoting effect was the most obvious (−Ar/RT = 0.2489). As the concentration of GO and SDS increased, the equilibrium pressure followed the trend of first increasing and then decreasing, and in the system with 0.005% GO + 0.2% SDS, the equilibrium pressure (Pf) was the lowest (about 1.8549 MPa). This is consistent with the previous experimental results. As a kind of high-efficiency surfactant, SDS can reduce the interfacial tension and change the hydrophilic and lipophilic properties of the interface. After proper ultrasonic vibration, a uniformly dispersed GO solution was obtained, and the interlayer spacing was reduced so that the interlayer van der Waals forces were reduced. The GO nanoparticles were more uniformly dispersed in the solution, remained stable, were less prone to agglomeration, and fully exerted the foaming and wetting properties of the surfactant. GO has a large surface area, the heat and mass transfer efficiency is fast, and the surface is randomly distributed with hydroxyl and epoxy groups; the carboxyl and carbonyl groups were introduced at the edges and so it is both hydrophilic and hydrophobic.24 The hydrophobic group makes it easier for CO2 to enter into the solution, and the hydrophilic group forms a hydrogen bond with water, increasing the probability of forming a hydrate.
Table 2 The effects of GO compounded with SDS on the kinetic parameters of the chemical affinity model
| Concentration (wt%) |
Model parameters |
Pressure (MPa) |
| SDS |
GO |
tk (s) |
−Ar/RT |
P0 |
Pf |
| 0 |
0 |
33![[thin space (1/6-em)]](https://www.rsc.org/images/entities/char_2009.gif) 013 013 |
0.2126 |
4 |
2.1967 |
| 0 |
0.005 |
11![[thin space (1/6-em)]](https://www.rsc.org/images/entities/char_2009.gif) 385 385 |
0.2227 |
4 |
2.1115 |
| 0.005 |
0.005 |
11![[thin space (1/6-em)]](https://www.rsc.org/images/entities/char_2009.gif) 337 337 |
0.2325 |
4 |
2.0789 |
| 0.03 |
0.005 |
11![[thin space (1/6-em)]](https://www.rsc.org/images/entities/char_2009.gif) 315 315 |
0.2359 |
4 |
2.0891 |
| 0.05 |
0.005 |
11![[thin space (1/6-em)]](https://www.rsc.org/images/entities/char_2009.gif) 190 190 |
0.2249 |
4 |
1.9961 |
| 0.1 |
0.005 |
10![[thin space (1/6-em)]](https://www.rsc.org/images/entities/char_2009.gif) 088 088 |
0.2210 |
4 |
1.9563 |
| 0.2 |
0.005 |
10![[thin space (1/6-em)]](https://www.rsc.org/images/entities/char_2009.gif) 000 000 |
0.2489 |
4 |
1.9489 |
| 0.3 |
0.005 |
10![[thin space (1/6-em)]](https://www.rsc.org/images/entities/char_2009.gif) 061 061 |
0.2375 |
4 |
1.9521 |
| 0.2 |
0.003 |
10![[thin space (1/6-em)]](https://www.rsc.org/images/entities/char_2009.gif) 291 291 |
0.2231 |
4 |
1.9563 |
| 0.2 |
0.01 |
11![[thin space (1/6-em)]](https://www.rsc.org/images/entities/char_2009.gif) 296 296 |
0.2234 |
4 |
2.0372 |
| 0.2 |
0.02 |
11![[thin space (1/6-em)]](https://www.rsc.org/images/entities/char_2009.gif) 356 356 |
0.2221 |
4 |
2.0325 |
5.2 The influence of pressure on model parameters
Table 3 shows the chemical affinity model parameters of different initial pressures (P0) at 281.15 K, 450 rpm, and the optimum composite accelerator mass fraction (0.005% GO + 0.2% SDS). It can be seen from the table that the initial pressure hardly affects the pressure at equilibrium (Pf), but as the initial pressure increased, the reaction was accelerated and the time (tk) to reach equilibrium was reduced. This is mainly because the high initial pressure provides a large driving force (pressure) for the hydration reaction, the mass transfer resistance in the liquid phase is lowered, and the hydration reaction proceeds rapidly. Under different pressures, the value of the model parameter Ar/RT changes only a little, and the average value is taken as the value (0.2558) of the kinetic model parameter |Ar/RT| for predicting CO2 hydrate formation under this condition. Under the same conditions, Fig. 7 shows the fitting curves of the model and experimental parameters at different initial pressures and straight lines were obtained when |Ar/RT| was 0.2558. It can be seen from Fig. 7 that the experimental and model parameters have the highest fitting degree at 6 MPa, which indicates that the larger the initial pressure, the higher the accuracy of the model. However, at different initial pressures, the model curve shows little difference, which indicates that the initial pressure has little effect on the model parameters.
Table 3 The effects of different initial pressures on kinetic parameters of chemical affinity model
| Temperature (K) |
P0 (MPa) |
Pf (MPa) |
Model parameters |
| tk (s) |
−Ar/RT |
| 281.15 |
4 |
1.9489 |
10![[thin space (1/6-em)]](https://www.rsc.org/images/entities/char_2009.gif) 000 000 |
0.2489 |
| 281.15 |
5 |
1.9511 |
9764 |
0.2571 |
| 281.15 |
6 |
1.9589 |
9218 |
0.2614 |
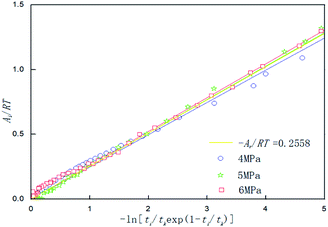 |
| | Fig. 7 Affinity variation versus −ln[ti/tkexp(1 − ti/tk)] in the system with 0.005% GO and 0.2% SDS at 281.15 K,450 rpm and different initial pressures. | |
5.3 Influence of temperature on model parameters
Temperature is an important factor in the hydrate formation process, so the effect of temperature on the parameters in the model was studied separately in the model. Table 4 shows the chemical affinity model parameters for the 0.005% GO + 0.2% SDS compound system and different temperatures. Fig. 8 is the fitting curve of the experimental and model parameters under the same working conditions. As can be seen from Table 4 and Fig. 8, Pf is significantly different at different temperatures. The cooler the system gets, the lower the Pf, the shorter the tk, and the larger the value of the model parameter (|Ar/RT|). This indicates that the lower the temperature, the easier it is for the CO2 hydrate to be formed, the shorter the reaction time, and the faster the formation rate. This is mainly because the lower temperature provides a greater driving force for the reaction, the heat transfer resistance in the system becomes smaller, the reaction is more likely to occur and it proceeds rapidly; this conforms to the formation law of hydrates. With the increase from 277.15 K to 279.15 K, the equilibrium pressure increased by about 0.1171 MPa; with the increase from 279.15 K to 281.15 K, the equilibrium pressure increased by about 0.0775 MPa and there was a decrease in the growth. This shows that as the temperature increases, the influence on the equilibrium pressure is weakened. This may be because the temperature continues to increase and the hydrate formation conditions are not achieved. The experimental results were in good agreement with the model parameters.
Table 4 The effects of temperature on the kinetic parameters of the chemical affinity model for CO2 hydrate formation in the 0.005% GO + 0.2% SDS system
| Temperature (K) |
P0 (MPa) |
Pf (MPa) |
Model parameters |
| tk (s) |
−Ar/RT |
| 277.15 |
4 |
1.7543 |
8869 |
0.2698 |
| 279.15 |
4 |
1.8714 |
9632 |
0.2653 |
| 281.15 |
4 |
1.9489 |
10![[thin space (1/6-em)]](https://www.rsc.org/images/entities/char_2009.gif) 000 000 |
0.2489 |
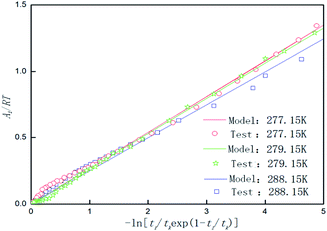 |
| | Fig. 8 Affinity variation versus −ln[ti/tkexp(1 − ti/tk)] for CO2 hydrate formation in the system with 0.005% GO and 0.2% SDS at 4 MPa, 450 rpm and different temperatures. | |
5.4 Model analysis of the promoting effect of different additives
Fig. 9 shows the effect of pure water, 0.005% GO and 0.005% GO + 0.2% SDS reagent on the formation rate of CO2 hydrate at 281.5 K, 4 MPa and 450 rpm. As can be seen from the figure, in the 0.005% GO + 0.2% SDS system, the normalized gas consumption was the largest and the generation rate was the fastest; the second was 0.005% GO, and the formation rate in pure water was the slowest. This indicates that the promotion accelerator of 0.005% GO + 0.2% SDS is better than the single 0.005% GO. It can be seen from Table 2 that Ar/RT obtained under the same working condition is almost constant. To make the model widely applicable, the same slope was taken under the same working conditions (−Ar/RT = 0.233) to predict and study the formation of hydrates. Fig. 10 is a graph showing the chemical affinity model in pure water, 0.005% GO and 0.005% GO + 0.2% SDS reagent under the same conditions. Studies have shown that the calculation of the chemical affinity model under different additive systems was in good agreement with experimentally obtained parameters.
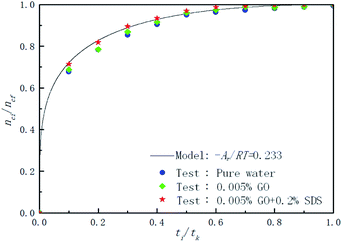 |
| | Fig. 9 Comparison of the calculated and experimental normalized gas consumption in the pure water, 0.005% GO and 0.005% GO + 0.2% SDS systems. | |
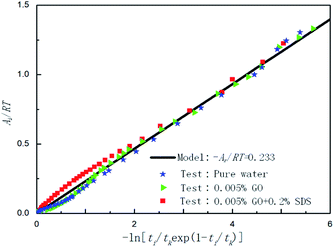 |
| | Fig. 10 Affinity variation versus −ln[ti/tkexp(1 − ti/tk)] for CO2 hydrate formation in the systems with pure water, 0.005% GO and 0.005% GO + 0.2% SDS. | |
6 Model accuracy analysis
Fig. 11 is a comparison of the experimental data with the data calculated by the chemical affinity model in the 0.005% GO + 0.2% SDS compound system at 281.15 K, 4 MPa, 450 rpm. The abscissa is the reaction time and the ordinate is gas consumption; the accuracy of the model prediction was checked by comparison of the gas consumption. It can be seen from the figure that in the initial stage of the reaction (0–2000 s), the model prediction data was consistent with the experimental data. As the reaction progressed, in the middle of the reaction (2000–10![[thin space (1/6-em)]](https://www.rsc.org/images/entities/char_2009.gif) 000 s), the model prediction data was slightly larger than the experimental data, and at the end of the reaction (after 10
000 s), the model prediction data was slightly larger than the experimental data, and at the end of the reaction (after 10![[thin space (1/6-em)]](https://www.rsc.org/images/entities/char_2009.gif) 000 s), the model prediction data was consistent with the experimental data. Overall, the comparison shows that the data obtained by the model was in good agreement with the experimental data and can be used for the prediction of hydrate formation. It can be seen from Table 2 that Ar/RT obtained under the same working condition was almost constant. To make the model widely applicable, the same slope was taken under the same working condition (−Ar/RT = 0.233) to predict and study the CO2 hydrate formation.
000 s), the model prediction data was consistent with the experimental data. Overall, the comparison shows that the data obtained by the model was in good agreement with the experimental data and can be used for the prediction of hydrate formation. It can be seen from Table 2 that Ar/RT obtained under the same working condition was almost constant. To make the model widely applicable, the same slope was taken under the same working condition (−Ar/RT = 0.233) to predict and study the CO2 hydrate formation.
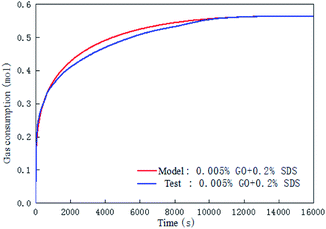 |
| | Fig. 11 Comparison of the calculated and the experimental gas consumption in the system with 0.005% GO and 0.2% SDS. | |
7 Conclusion
(1) The promoting effect of CO2 hydrate formation on the complexation of GO + SDS was studied via experiments. The results showed that there was an obvious promoting effect. The composition ratio and mass fraction of the complex system had a significant influence on hydrate formation and obtained the best promotion mass fraction of 0.005% GO + 0.2% SDS. Compared with pure water and a single 0.005% GO system, the hydrate formation time was shortened by 69.7% and 12.2%, respectively, and the gas consumption was increased by 11.24% and 3.2%.
(2) The combination of SDS and GO caused the heat and mass transfer characteristics of the system to be mutually reinforced, which was beneficial to the rapid formation of the hydrate. GO was more evenly distributed in the solution containing SDS, providing more nucleation points and enhancing the ability to capture the gas. Therefore, the system temperature was fast and stable, the pressure drop was more obvious, the gas consumption was greatly increased, and the generation time was significantly shortened.
(3) The chemical affinity model for hydrate formation in the GO and SDS complex system was established. The model was programmed by Matlab and compared with the experimental results. The model analysis indicated that the concentration of the composite accelerator had a great influence on the model parameters tk, Ar/RT, and the phase equilibrium pressure, and the optimal concentration value could be predicted, which was consistent with the experimental results. As the initial pressure increased and the temperature decreased, the time for the hydration reaction to reach equilibrium was shortened.
(4) The chemical affinity model is relatively simple, easy to solve, and is in good agreement with the experimental results. It can accurately predict the formation of hydrates in the compound system containing GO/SDS and is a good reference for the prediction of hydrate formation in other accelerator systems.
Nomenclature
| Ai | Affinity at state i |
| Ar | Proportionality constant |
| ti | Time it takes to get to state i, s |
| tk | Time it takes to get to k, s |
| nci | Number of moles of gas consumed at ti, mol |
| ncf | Total number of moles of gas consumed, mol |
| R | Ideal gas constant |
| T | Temperature, K |
| P | Pressure, Pa |
| Z | Gas compression factor |
Subscripts
| 0 | Initial state |
| i | State at time i |
| f | State of equilibrium |
Conflicts of interest
There are no conflicts to declare.
Acknowledgements
This research was funded by the National Science Foundation of China, grant number 51574045.
References
- E. D. Sloan and C. A. Kon, Clathrate Hydrates of Natural Gases, CRC Press, Taylor & Francis Group, Boca Raton, FL, 3rd edn, 2008 Search PubMed.
- W. F. Hao, J. Q. Wang and S. S. Fan, et al., Evaluation and analysis method for natural gas hydrate storage and transportation processes, Energy Convers. Manag., 2008, 49, 2546–2553 CrossRef.
- C. S. Zhang, S. S. Fan and D. Q. Liang, et al., Effect of additives on formation of natural gas hydrate, Fuel, 2004, 83, 2115–2121 CrossRef.
- I. Chatti, A. Delahaye and L. Foumaison, et al., Benefits and drawbacks of clathrate hydrates: a review of their areas of interest, Energy Convers. Manage., 2005, 26, 1333–1343 CrossRef.
- W. X. Zhang, Y. H. Wang and X. M. Lang, et al., Performance analysis of hydrate-based refrigeration system, Energy Convers. Manage., 2017, 146, 43–51 CrossRef.
- S. F. Li, Z. Tan and M. G. Shen, et al., Progress in aqueous solution concentration by forming clathrate hydrate, Chem. Ind. Eng. Prog., 2014,(6), 1387–1391 Search PubMed , 1396.
- S. Park, S. Lee and Y. Lee, et al., Hydrate-based pre-combustion capture of carbon dioxide in the presence of a thermodynamic promoter and porous silica gels, Int. J. Greenhouse Gas Control, 2013, 14, 193–199 CrossRef.
- Z. Z. Shi, Y. X. Li and W. C. Wang, et al., Review of hydrate reactor in natural gas hydrate storage and transportation, Chem. Ind. Eng. Prog., 2018, 37(9), 3326–3336 Search PubMed.
- L. L. Jiang, A. R. Li and S. Y. Tang, An experimental study on carbon dioxide hydrate formation using a gas-inducing agitated reactor, Energy, 2017, 134, 629–637 CrossRef.
- Q. N. Lv, X. S. Li and C. G. Xu, et al., Experimental investigation of the formation of cyclopentane-methane hydrate in a novel and large-size bubble column reactor, Ind. Eng. Chem. Res., 2012, 51, 5967–5975 CrossRef.
- J. Z. Zhao, S. Y. Zhao and D. X. Shi, Experimental study on gas hydrate formation under spray atomization, Chem. Ind. Eng. Prog., 2008, 27(z1), 609–612 Search PubMed.
- F. Rossi, M. Filipponi and B. Castellani, Investigation on a novel reactor for gas hydrate production, Appl. Energy, 2012, 99, 167–172 CrossRef.
- J. Javanmardi, K. Nasrifar and S. H. Najibi, et al., Economic evaluation of natural gas hydrate as an alternative for natural gas transportation, Appl. Therm. Eng., 2005, 25(11/12), 1708–1723 CrossRef.
- P. Linga, R. Kumar and P. Englezos, The clathrate hydrate process for post and pre-combustion capture of carbon dioxide, J. Hazard. Mater., 2007, 149(3), 625–629 CrossRef.
- H. F. Liang, Y. J. Zhu and S. Y. Zhao, et al., Phase equilibrium study of gas mixtures hydrate formation with additives THF based on water fugacity model, Chem. Ind. Eng. Prog., 2016, 35(3), 700–705 Search PubMed.
- D. Posteraro, J. Pasieka and M. Maric, et al., The effect of hydrate promoter SDS on methane dissolution rates at the three phase (H-Lw-V) equilibrium condition, J. Nat. Gas Sci. Eng., 2016, 35, 1579–1586 CrossRef.
- F. Wang, Z. Z. Jia and S. J. Luo, et al., Effects of different anionic surfactants on methane hydrate formation, Chem. Eng. Sci., 2015, 137, 896–903 CrossRef.
- A. Baghban, M. A. Ahmadi and B. Pouladi, et al., Phase equilibrium modeling of semi-clathrate hydrates of seven commonly gases in the presence of TBAB ionic liquid promoter based on a low parameter connectionist technique, J. Supercrit. Fluids, 2015, 101, 184–192 CrossRef.
- J. X. Ding, L. L. Shi, X. D. Shen and D. Q. Liang, SDS effect on formation kinetics and microstructure of methane hydrate, CIESC J., 2017, 68(12), 4802–4808 Search PubMed.
- J. W. Lee and Y. T. Kang, CO2 absorption enhancement by Al2O3 nanoparticles in NaCl aqueous solution, Energy, 2013, 53, 206–211 CrossRef.
- S. M. Fotukian and M. N. Esfahany, Experimental
study of turbulent convective heat transfer and pressure drop of dilute CuO/water nanofluid inside a circular tube, Int. Commun. Heat Mass Tran., 2010, 37, 214–219 CrossRef.
- I. T. Pineda, J. W. Lee and I. Jung, et al., CO2 absorption enhancement by methanol-based Al2O3 and SiO2 nanofluids in a tray column absorber, Int. J. Refrig., 2012, 35, 1402–1409 CrossRef.
- D. L. Li, H. Peng and D. Q. Liang, Thermal conductivity enhancement of clathrate hydrate with nanoparticles, Int. J. Heat Mass Tran., 2017, 104, 566–573 CrossRef.
- S. Yan, W. J. Dai and S. L. Wang, et al., Graphene oxide: an effective promoter for CO2 hydrate formation, Energies, 2018, 11, 1756–1769 CrossRef.
- S. D. Zhou, X. W. Yu and Q. L. Li, et al., Effect of graphite nanoparticles and SDS on hydrate formation characteristics, Nat. Gas. Chem. Ind., 2017, 42, 50–53 Search PubMed , 118.
- M. A. Clarke and P. R. Bishnoi, Determination of the intrinsic kinetics of CO2 gas hydrate formation using in situ particle size analysis, Chem. Eng. Sci., 2005, 60, 695–709 CrossRef.
- A. Visniauskaas and P. R. Bishnoi, Kinetics of ethane hydrate formation, Chem. Eng. Sci., 1985, 40, 299–303 CrossRef.
- H. Roosta, S. Khosharay and F. Varaminian, Experimental study of methane hydrate formation kinetics with or without additives and modeling based on chemical affinity, Energy Convers. Manage., 2013, 76, 499–505 CrossRef.
- M. Karamoddin, F. Varaminian and M. Daraee, Kinetic study on the process of CHClF2 (R22) hydrate formation in the presence of SDS surfactant based on chemical affinity, J. Nat. Gas Sci. Eng., 2014, 19, 46–51 CrossRef.
- M. Khurana, H. P. Veluswamy and N. Daraboina, et al., Thermodynamic and kinetic modelling of mixed CH4-THF hydrate for methane storage application, Chem. Eng. J., 2019, 370, 760–771 CrossRef CAS.
- H. Dashti, D. Thomas and A. Amiri, et al., Modeling of hydrate-based CO2 capture with nucleation stage and induction time prediction capability, J. Clean. Prod., 2019, 231, 805–816 CrossRef CAS.
- L. X. Zhang, Y. M. Kuang and S. Dai, et al., Kinetic enhancement of capturing and storing greenhouse gas and volatile organic compound:micro-mechanism and micro-structure of hydrate growth, Chem. Eng. J., 2020, 379, 122357 CrossRef CAS.
- S. S. Fan, D. Q. Liang and K. H. Guo, Hydrate conditions for cyclopentane and a quaternary cyclopentane—rich mixture, J. Chem. Eng. Data, 2001, 46, 930–932 CrossRef CAS.
|
| This journal is © The Royal Society of Chemistry 2020 |
Click here to see how this site uses Cookies. View our privacy policy here.  Open Access Article
 ,
Shuhua Zhao,
Shuli Wang* and
Yongchao Rao
![[thin space (1/6-em)]](https://www.rsc.org/images/entities/char_2009.gif) :
:![[thin space (1/6-em)]](https://www.rsc.org/images/entities/char_2009.gif) 1 ratio. The circulating water bath device (THD-2030 type) had a temperature control range of −15–20 °C. The temperature control accuracy was ±0.1 °C; the fiber optic camera system was capable of observing and recording the changes in the kettle and the hydrate formation process; the data acquisition system mainly recorded the pressure and temperature changes and collected data through the Agilent 34972a data acquisition instrument. The hydrate formation experimental device is shown in Fig. 1.
1 ratio. The circulating water bath device (THD-2030 type) had a temperature control range of −15–20 °C. The temperature control accuracy was ±0.1 °C; the fiber optic camera system was capable of observing and recording the changes in the kettle and the hydrate formation process; the data acquisition system mainly recorded the pressure and temperature changes and collected data through the Agilent 34972a data acquisition instrument. The hydrate formation experimental device is shown in Fig. 1.
![[thin space (1/6-em)]](https://www.rsc.org/images/entities/char_2009.gif) ln(ζQi)
ln(ζQi)


![[thin space (1/6-em)]](https://www.rsc.org/images/entities/char_2009.gif) ln(K).
ln(K).


 as in eqn (9).
 are the kinetic parameters of the chemical affinity model. The absolute value of the slope
 can be a normalized rate constant, so the value of this slope can be employed for investigating the effects of parameters such as initial pressure, temperature, and additives on the hydrate formation kinetics.


![[thin space (1/6-em)]](https://www.rsc.org/images/entities/char_2009.gif) 000 s), and the promoting effect was the most obvious (−Ar/RT = 0.2489). As the concentration of GO and SDS increased, the equilibrium pressure followed the trend of first increasing and then decreasing, and in the system with 0.005% GO + 0.2% SDS, the equilibrium pressure (Pf) was the lowest (about 1.8549 MPa). This is consistent with the previous experimental results. As a kind of high-efficiency surfactant, SDS can reduce the interfacial tension and change the hydrophilic and lipophilic properties of the interface. After proper ultrasonic vibration, a uniformly dispersed GO solution was obtained, and the interlayer spacing was reduced so that the interlayer van der Waals forces were reduced. The GO nanoparticles were more uniformly dispersed in the solution, remained stable, were less prone to agglomeration, and fully exerted the foaming and wetting properties of the surfactant. GO has a large surface area, the heat and mass transfer efficiency is fast, and the surface is randomly distributed with hydroxyl and epoxy groups; the carboxyl and carbonyl groups were introduced at the edges and so it is both hydrophilic and hydrophobic.24 The hydrophobic group makes it easier for CO2 to enter into the solution, and the hydrophilic group forms a hydrogen bond with water, increasing the probability of forming a hydrate.
000 s), and the promoting effect was the most obvious (−Ar/RT = 0.2489). As the concentration of GO and SDS increased, the equilibrium pressure followed the trend of first increasing and then decreasing, and in the system with 0.005% GO + 0.2% SDS, the equilibrium pressure (Pf) was the lowest (about 1.8549 MPa). This is consistent with the previous experimental results. As a kind of high-efficiency surfactant, SDS can reduce the interfacial tension and change the hydrophilic and lipophilic properties of the interface. After proper ultrasonic vibration, a uniformly dispersed GO solution was obtained, and the interlayer spacing was reduced so that the interlayer van der Waals forces were reduced. The GO nanoparticles were more uniformly dispersed in the solution, remained stable, were less prone to agglomeration, and fully exerted the foaming and wetting properties of the surfactant. GO has a large surface area, the heat and mass transfer efficiency is fast, and the surface is randomly distributed with hydroxyl and epoxy groups; the carboxyl and carbonyl groups were introduced at the edges and so it is both hydrophilic and hydrophobic.24 The hydrophobic group makes it easier for CO2 to enter into the solution, and the hydrophilic group forms a hydrogen bond with water, increasing the probability of forming a hydrate.
![[thin space (1/6-em)]](https://www.rsc.org/images/entities/char_2009.gif) 013
013![[thin space (1/6-em)]](https://www.rsc.org/images/entities/char_2009.gif) 385
385![[thin space (1/6-em)]](https://www.rsc.org/images/entities/char_2009.gif) 337
337![[thin space (1/6-em)]](https://www.rsc.org/images/entities/char_2009.gif) 315
315![[thin space (1/6-em)]](https://www.rsc.org/images/entities/char_2009.gif) 190
190![[thin space (1/6-em)]](https://www.rsc.org/images/entities/char_2009.gif) 088
088![[thin space (1/6-em)]](https://www.rsc.org/images/entities/char_2009.gif) 000
000![[thin space (1/6-em)]](https://www.rsc.org/images/entities/char_2009.gif) 061
061![[thin space (1/6-em)]](https://www.rsc.org/images/entities/char_2009.gif) 291
291![[thin space (1/6-em)]](https://www.rsc.org/images/entities/char_2009.gif) 296
296![[thin space (1/6-em)]](https://www.rsc.org/images/entities/char_2009.gif) 356
356![[thin space (1/6-em)]](https://www.rsc.org/images/entities/char_2009.gif) 000
000
![[thin space (1/6-em)]](https://www.rsc.org/images/entities/char_2009.gif) 000
000


![[thin space (1/6-em)]](https://www.rsc.org/images/entities/char_2009.gif) 000 s), the model prediction data was slightly larger than the experimental data, and at the end of the reaction (after 10
000 s), the model prediction data was slightly larger than the experimental data, and at the end of the reaction (after 10![[thin space (1/6-em)]](https://www.rsc.org/images/entities/char_2009.gif) 000 s), the model prediction data was consistent with the experimental data. Overall, the comparison shows that the data obtained by the model was in good agreement with the experimental data and can be used for the prediction of hydrate formation. It can be seen from Table 2 that Ar/RT obtained under the same working condition was almost constant. To make the model widely applicable, the same slope was taken under the same working condition (−Ar/RT = 0.233) to predict and study the CO2 hydrate formation.
000 s), the model prediction data was consistent with the experimental data. Overall, the comparison shows that the data obtained by the model was in good agreement with the experimental data and can be used for the prediction of hydrate formation. It can be seen from Table 2 that Ar/RT obtained under the same working condition was almost constant. To make the model widely applicable, the same slope was taken under the same working condition (−Ar/RT = 0.233) to predict and study the CO2 hydrate formation.


