The synthesis of polymeric dyes based on waterborne polyurethane: a reaction kinetics study using UV absorption spectroscopy
Jun
Zhu
ab,
Jie
Li
a,
Chao
Sang
a and
Yunjun
Luo
 *ab
*ab
aSchool of Materials Science and Engineering, Beijing Institute of Technology, Beijing 100081, China. E-mail: yjluo@bit.edu.cn; Tel: +86 10 68913698
bKey Laboratory of High Energy Density Materials of Ministry of Education, Beijing Institute of Technology, Beijing, 100081, China
First published on 21st January 2020
Abstract
Waterborne polyurethane (WPU) based polymeric dyes with anthraquinone chromophores were developed to realize coloring textiles and improve color fastness. The preparation of polymeric dyes through the reaction of 1,4-diamino-2,3-diphenoxyanthraquinone (DV26) and NCO-terminated prepolymer was monitored via UV absorption spectroscopy. With the progress of the reaction, the intensity of the absorption peak of the primary amine group at 586 nm decreased as a function of reaction time. Thus, the conversion of DV26 at different times and the reaction end point could be determined. The reaction mechanism corresponded to an autocatalytic reaction equation, basically. In addition, the results of performance tests showed that the polymeric dyes exhibited good emulsion stability, ultra-low migration percentages, good water resistance and excellent thermal stability. Moreover, the application properties of DWPU on coated polyester fabrics were satisfactory.
1. Introduction
As the demand for reducing volatile organic compounds (VOCs) and hazardous air pollutants emissions has increased, waterborne polyurethane (WPU) has become an attractive choice due to its excellent mechanical properties, chemical resistance, adhesion and low VOCs.1–3 As a result, WPU had been widely used in coating, adhesives, elastomers and many other fields. Generally, WPU resin is either physically mixed with dye and pigment pastes or colored by post-colorization to obtain color coatings with better application performance.4 However, it was inevitably necessary to add some auxiliaries into WPU to enhance the compatibility of multiple phases, which would greatly deteriorate the stability and uniformity of the emulsions.5 In addition, the preparation of a color paste was usually cumbersome and the application process was very complicated and time consuming.6,7 Besides, the weak physical interaction between WPU and dyes would result in poor migration resistance, durability and color fastness of colored coatings. These shortcomings had greatly limited the application scope of color coatings. Fortunately, these problems could be addressed by the application of novel WPU based polymeric dyes.8–10A WPU based polymeric dye is a kind of self-colored WPU whose dye chromophore is chemically bonded to the main or side chains via a chemical reaction.11–13 Therefore, a polymeric dye could exhibit properties of both dyes and WPU, such as chromaticity, photo absorption, transparency, solvent resistance, film-forming and heat resistance.14,15 Additionally, polymeric dyes would not be absorbed by the skin on account of their large molecular weight and chemical stability.16 Thus, polymeric dyes could meet the demands of the modern printing and dyeing industry for power saving, environmental protection and easy processing sequences. Moreover, they could also offer the advantages of improved dyeing fastness, low dye dosage needed and superior security.17–19 WPU based polymeric dyes have attracted increasing interest from researchers recently.20
In general, WPU based polymeric dyes are synthesized through a chemical reaction between isocyanate groups (NCO) in the polyurethane prepolymer and some reactive groups (hydroxy or amino groups) in the chromophore.21 The reaction was one of the key factors affecting the performance of the polymeric dye.22 Nevertheless, few studies have reported the monitoring of the reaction of chromophores and prepolymers. Therefore, in order to optimize the synthetic conditions and improve the properties of the polymeric dye, the reaction kinetics mechanisms must be studied thoroughly. In general, titration or IR spectroscopy were commonly used to determine the content of NCO of WPU, thereby monitoring the reaction degree.23,24 However, it was inappropriate to determine the content of NCO by traditional methods in a WPU based polymeric dye, because chromophores usually had dark colors and were incompatible with a WPU prepolymer.
Fortunately, we found that the reactive groups of chromophores had obvious ultraviolet characteristic absorption. After reaction with NCO, the absorption peak intensity of the reactive groups would be weakened significantly or disappear finally. Therefore, the conversion of chromophores could be determined by the change of peak intensity. By measuring the UV absorption spectrum of the WPU prepolymer at different times, the reaction kinetics could be studied and the synthesis routine could be optimized. Moreover, the kinetic mechanism function, rate constant and related kinetic parameter could also be obtained.
Herein, a series of WPU based polymeric dyes with 1,4-diamino-2,3-diphenoxyanthraquinone (Disperse Violet 26, DV26) as the chromophore was prepared. The reaction kinetics of DV26 with the NCO-terminated prepolymer were monitored by UV absorption spectroscopy for the first time, and the kinetic parameters were calculated by Arrhenius law and the Eyring equation. The kinetic parameters would be helpful to adjust the WPU curing conditions, such as reaction time, temperature, and so on. The polymeric dye prepared through the optimized process showed excellent properties and had good application performances on polyester fabrics.
2. Experimental section
2.1 Materials
Isophorone diisocyanate (IPDI), 2,2-dimethylol propionic acid (DMPA), trimethylamine (TEA), dibutyltin dilaurate (DBTDL), chloroform-d (CDCl3) and 1,4-butanediol (BDO) were both supplied by Aladdin (Shanghai) Co., Ltd. 2-Butanone (MEK) and ethylenediamine (EDA) were purchased from Beijing Chemical Works. Poly (propylene glycol) with a molecular weight of 1000 (PPG1000) was purchased from Dawson International Inc., Buffalo Grove, IL, USA. 1,4-Diamino-2,3-diphenoxyanthraquinone (Disperse Violet 26, DV26) was supplied by LANXESS Chemical (China) Co., Ltd. PPG1000 and DMPA were vacuum-dried at 100 °C for 12 h prior to use to remove water. IPDI, DBTDL, EDA and DV26 were used as received. TEA and MEK were dried with KOH and CaSO4, respectively, and then purified by distillation under reduced pressure. Polyester fabric and thickening agent 601H were supplied by Zhejiang Transfar Co. Ltd and were used as received.2.2 Preparation of DWPU emulsions
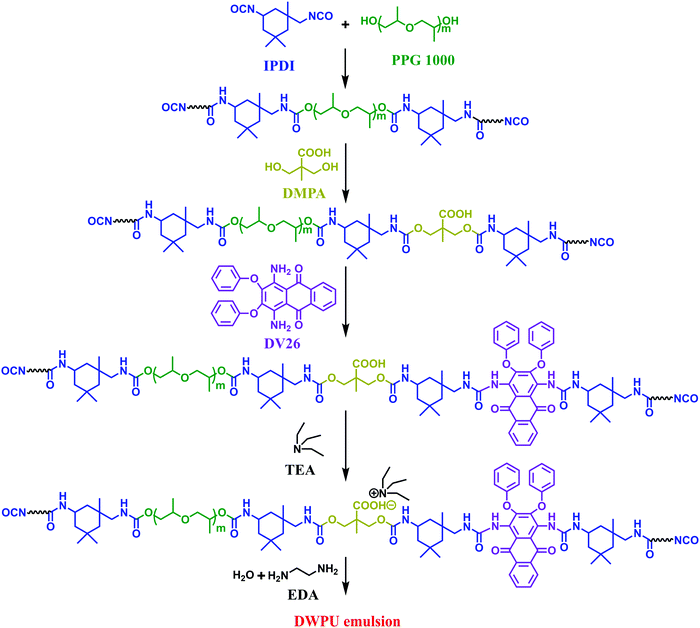
IPDI, PPG and three drops of DBTDL were added into a dry three-necked flask equipped with a mechanical stirrer, a thermocouple and a reflux condenser, and were heated at 85 °C for 1 h. Subsequently, the reaction was performed at the same temperature for 2.5 h after adding DMPA. After that, the temperature was reduced to 70 °C, then DV26 was added and reacted for 3 h. Additionally, MEK was added to reduce the viscosity. TEA (equal molar ratio as DMPA) was added for neutralization and stirred for 30 min at 40 °C to form NCO-terminated polyurethane. At last, water and EDA were added with a high shearing speed (3000 rpm) to emulsify the solution for 30 minutes. Finally, DWPU emulsion with a solid content of 30 wt% was obtained. Scheme 1 shows a schematic diagram of the synthesis of the DWPU emulsions. The contents of the components are presented in Table 1. Samples were prepared and named DxWPU and DWPU-y, where x refers to the percentage content of DV26 and y represents the reaction temperature of DV26. DWPU-25 was obtained by physically blending DV26 with WPU at 25 °C.| Sample | IPDI/g | PPG/g | OP550/g | DV26/g | DMPA/g | TEA/g | EDA/g |
|---|---|---|---|---|---|---|---|
| WPU | 28.97 | 40 | 0 | 0 | 4.02 | 3.03 | 1.95 |
| D1WPU | 28.97 | 40 | 0 | 0.8 | 4.02 | 3.03 | 1.95 |
| D2WPU | 28.97 | 40 | 0 | 1.6 | 4.02 | 3.03 | 1.95 |
| D3WPU | 28.97 | 40 | 0 | 2.4 | 4.02 | 3.03 | 1.95 |
| D4WPU | 28.97 | 40 | 0 | 3.2 | 4.02 | 3.03 | 1.95 |
| DWPU-y | 28.97 | 40 | 0 | 1.6 | 4.02 | 3.03 | 1.95 |
2.3 Preparation of coated polyester fabrics
A thickened emulsion (601H, 2.5 wt%) was added into DWPU emulsions and stirred for 5 min at 1500 rpm. Subsequently, the samples were evenly coated on the polyester fabric which was fixed by a needle plate. At last, several polyester fabrics coated with DWPUs were obtained by drying the fabrics at 170 °C for 60 seconds.2.4 Characterization
where m0 represents the initial mass of DWPU film and m represents the mass after soaking.
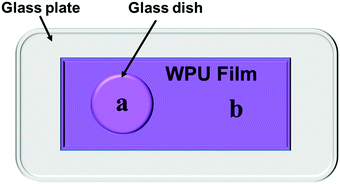
where Aa and Ab were the absorbance of the maximum absorption wavelength in regions a and b, respectively.
3. Results and discussion
3.1 The UV absorption spectrum of DWPU
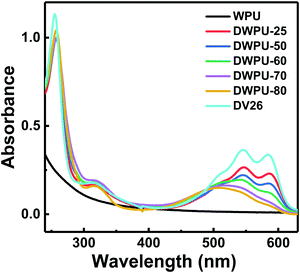
Fig. 1 showed the UV absorption spectra of DWPUs reacted at different temperatures. The absorption peaks at 254 nm and 315 nm were caused by the n–π* and p–π* electronic transition of benzoquinone in DV26. The absorption band at 500–600 nm resulted from the π–π* electronic transition between the acetophenone chromophores and the primary amino groups of DV26.26 With the reaction temperature of DV26 increasing, the intensity of the absorption band at 500–600 nm decreased gradually. However, DWPU only had an absorption peak at 506 nm when the temperature was higher than 70 °C. The intensity of the absorption band at 500–600 nm decreased as DV26 reacted with the NCO-terminated WPU prepolymer, which was attributed to the decrease of the primary amino groups. When all the primary amine groups of DV26 were reacted, there was only an absorption peak at 506 nm, which was attributed to the π–π* electronic transition between the acetophenone chromophores and the secondary amine. The benzoquinone did not take part in the reaction, so the absorption peaks at 254 and 315 nm did not change.3.2 UV absorption spectra and reaction kinetics
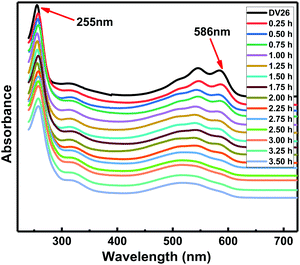
As the primary amine in DV26 was consumed and the benzoquinone remained unchanged, it was reasonable and feasible to study the reaction kinetics by monitoring the absorbance changes of the UV absorption peak at 586 nm against the reference peak at 255 nm. To investigate the reaction rate of DV26 at different temperatures, the UV absorption spectra of the DWPU prepolymers reacted at 50, 60, 70 and 80 °C were measured. The UV absorption spectra of the DWPU prepolymers at 70 °C (Fig. 2) showed that the intensity of the absorption peak at 586 nm decreased gradually with prolonged reaction time. Finally, the absorption peak at 586 nm disappeared. The same trend can be observed in their UV absorption spectra at other temperatures.According to the Beer–Lambert law,27,28 the relationship between the concentration of the group and the absorbance was in accordance with the following eqn (1):
| A = ε·c·l | (1) |
 | (2) |
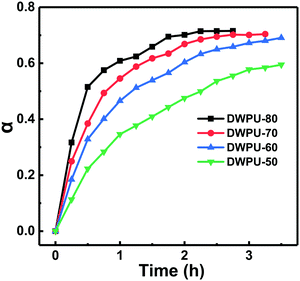
According to eqn (2), the real-time conversion of DV26 at different temperatures could be calculated by the changes of UV absorption spectra of DWPU prepolymers (Fig. 3). The results showed that the conversion rate of DV26 increased with the reaction time at the same temperature, and reached a maximum finally. In addition, the higher the reaction temperature, the higher the conversion of DV26 at the same time, which indicated that the reaction rate of DV26 accelerated with increasing temperature. After the reaction proceeded for 2.5 h at 70 °C, the conversion rate reached a maximum and would not change significantly even when the time was extended.
Therefore, the end point of the reaction could be determined by the changes of the conversion rate, thereby realizing the optimization of the synthesis. Other than that, the reaction mechanism could be inferred by fitting the kinetic mechanism function and then using it to explain the reaction type and molecular diffusion modes.29–31
3.3 Analysis of kinetic models
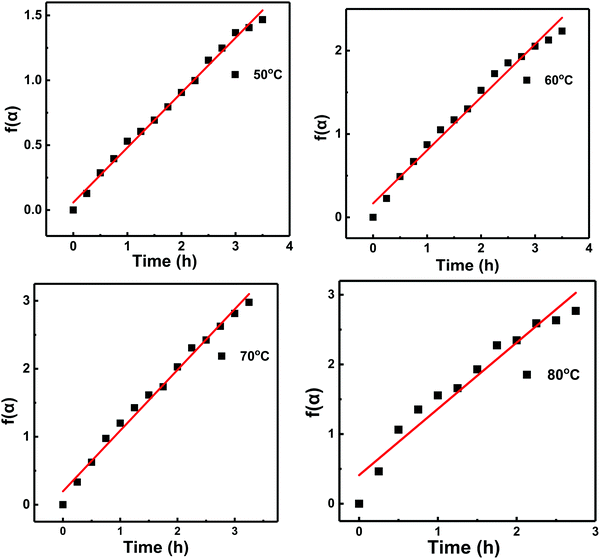
In general, the kinetic model of chemical reactions can be divided into the nth level model, the autocatalytic model and Kamal model. The reaction kinetic equations were as follows:32,33nth level model:
| dα/dt = A·(1 − α)n·e(Ea/RT) | (3) |
Autocatalytic model:
| dα/dt = A·αm·(1 − α)n·e(Ea/RT) | (4) |
Kamal model:
| dα/dt = (k1 + k2αm)·(1 − α)n | (5) |
Thermodynamic parameters were calculated according to the Arrhenius law and Eyring equation by plotting:
| k = A·e(Ea/RT) | (6) |
 | (7) |
 | (8) |
| Sample | Mechanism | r | k |
|---|---|---|---|
| DWPU-50 | α/(1 − α) = 0.423t + 0.058 | 0.997 | 0.423 |
| DWPU-60 | α/(1 − α) = 0.636t + 0.168 | 0.992 | 0.636 |
| DWPU-70 | α/(1 − α) = 0.893t + 0.197 | 0.995 | 0.893 |
| DWPU-80 | α/(1 − α) = 0.952t + 0.410 | 0.972 | 0.952 |
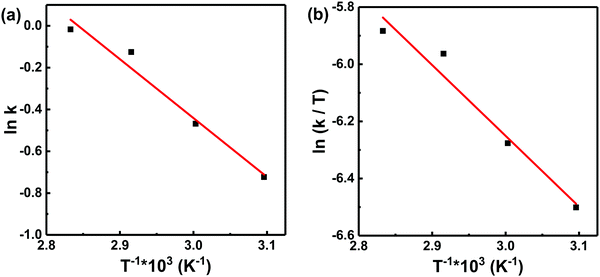
As is known to all, the activation energy of the polymerization reaction is calculated from the Arrhenius equation [eqn (7)], while the activation enthalpy and entropy of the polymerization reaction are calculated from the Eyring equation [eqn (8)]. The Arrhenius plots (a) and Eyring plots (b) versus 1/T are shown in Fig. 5. The activation enthalpy and entropy were calculated from the fitted straight line and the values are listed in Table 4.
| Arrhenius law | Eyring equation | ||||||
|---|---|---|---|---|---|---|---|
| Mechanism | r | E a (kJ mol−1) | A (h−1) | Mechanism | r | ΔH (kJ mol−1) | ΔS (J (mol K)−1) |
| y = −2.816 × x + 8.006 | 0.972 | 23.41 | 2999 | y = −2.478 × x + 1.184 | 0.964 | −20.60 | −187.71 |
3.4 Structural characterization of DWPUs
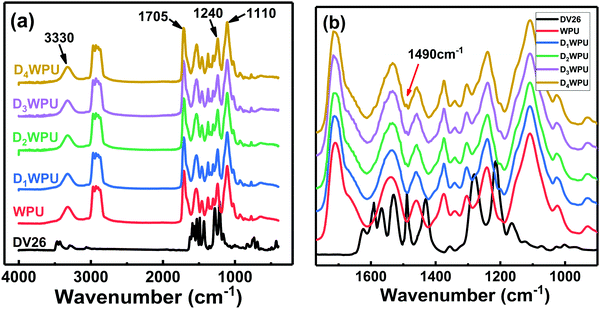
The FTIR spectra of DWPUs are shown in Fig. 6. The absorption bands corresponding to the stretching vibration of urea and carbamate groups could be observed at 3330 cm−1 (N–H) and 1705 cm−1 (C![[double bond, length as m-dash]](https://www.rsc.org/images/entities/char_e001.gif) O). The absorption bands at 1240 cm−1 and 1110 cm−1 were assigned to the stretching vibration of C–O in carbamate and ether groups, respectively. The absorption band from 2860 cm−1 to 2960 cm−1 was the stretching vibration of –CH2 and –CH3. These absorption peaks proved that WPU had been successfully synthesized. The absorption bands at 3469 cm−1 and 3428 cm−1 in the FTIR spectrum of DV26 were assigned to the stretching vibration of the primary amine, and the absorption band near 1400–1650 cm−1 was ascribed to the stretching vibration of the benzene group. As the concentration of DV26 increased, the vibration stretching absorption peak of benzene could be seen at 1490 cm−1, which indicated that DV26 had been successfully chemically bonded to the molecular chains of WPU.
O). The absorption bands at 1240 cm−1 and 1110 cm−1 were assigned to the stretching vibration of C–O in carbamate and ether groups, respectively. The absorption band from 2860 cm−1 to 2960 cm−1 was the stretching vibration of –CH2 and –CH3. These absorption peaks proved that WPU had been successfully synthesized. The absorption bands at 3469 cm−1 and 3428 cm−1 in the FTIR spectrum of DV26 were assigned to the stretching vibration of the primary amine, and the absorption band near 1400–1650 cm−1 was ascribed to the stretching vibration of the benzene group. As the concentration of DV26 increased, the vibration stretching absorption peak of benzene could be seen at 1490 cm−1, which indicated that DV26 had been successfully chemically bonded to the molecular chains of WPU.
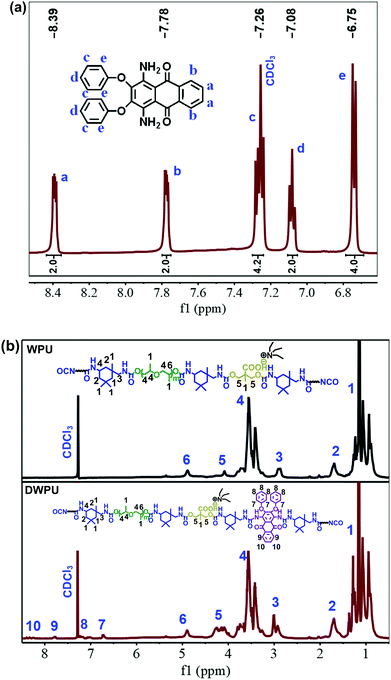
The 1H NMR spectra of DV26 and DWPU are shown in Fig. 7. The peaks at 7.26 ppm were attributed to the solvent CDCl3. Other peaks of DV26 were listed as follows: 8.4 (m, 2H, Ar-H), 7.78 (dd, 2H, Ar-H), 7.26 (m, 4H, Ar-H), 7.08 (t, 2H, Ar-H), and 6.75(d, 4H, Ar-H). The signals assigned to benzene were observed in the 1H NMR spectrum of DWPU, which indicated that DV26 had been anchored to the WPU chains.
3.5 Particle size, zeta potential, Mp and Mn
The particle size, zeta potential, Mp and Mn of the DWPUs are shown in Table 5. The particle size of DWPUs was significantly larger than that of WPU, and gradually increased as the concentration of DV26 increased. This was attributed to the introduction of hydrophobic DV26 which enhanced the hydrophobicity of WPU and affected the stability of the electric double layer. Owing to the poor compatibility between DV26 and WPU, the Mp of DWPU-25 was as high as 23.45%, and the particle size was the largest (50.16 nm). The low conversion of DV26 caused the precipitation of DWPU-50 emulsion after centrifugation. The results of the zeta potential and centrifugal stability test indicated that DWPU emulsions had good stability.| Sample | Particle size/nm | Zeta potential/mV | Centrifugal stability | M p/% | M n | PDI |
|---|---|---|---|---|---|---|
| WPU | 30.44 | −32.1 | No precipitate | — | 25![[thin space (1/6-em)]](https://www.rsc.org/images/entities/char_2009.gif) 100 100 |
1.90 |
| DWPU-25 | 50.16 | −29.3 | Precipitate | 23.45 | 25![[thin space (1/6-em)]](https://www.rsc.org/images/entities/char_2009.gif) 900 900 |
2.58 |
| DWPU-50 | 42.37 | −30.0 | Precipitate | 6.53 | 27![[thin space (1/6-em)]](https://www.rsc.org/images/entities/char_2009.gif) 700 700 |
2.41 |
| DWPU-60 | 41.53 | −31.8 | No precipitate | 4.62 | 29![[thin space (1/6-em)]](https://www.rsc.org/images/entities/char_2009.gif) 100 100 |
2.25 |
| DWPU-70 | 43.30 | −33.1 | No precipitate | 4.27 | 30![[thin space (1/6-em)]](https://www.rsc.org/images/entities/char_2009.gif) 200 200 |
1.98 |
| DWPU-80 | 47.95 | −31.9 | No precipitate | 4.22 | 31![[thin space (1/6-em)]](https://www.rsc.org/images/entities/char_2009.gif) 000 000 |
2.05 |
| D1WPU | 40.29 | -37.2 | No precipitate | 3.79 | 29![[thin space (1/6-em)]](https://www.rsc.org/images/entities/char_2009.gif) 400 400 |
2.04 |
| D2WPU | 43.30 | −33.1 | No precipitate | 4.27 | 30![[thin space (1/6-em)]](https://www.rsc.org/images/entities/char_2009.gif) 800 800 |
1.97 |
| D3WPU | 48.49 | −36.6 | No precipitate | 4.43 | 32![[thin space (1/6-em)]](https://www.rsc.org/images/entities/char_2009.gif) 200 200 |
2.07 |
| D4WPU | 53.31 | −34.7 | No precipitate | 4.62 | 33![[thin space (1/6-em)]](https://www.rsc.org/images/entities/char_2009.gif) 500 500 |
2.12 |
The percentage of migration (Mp) was used to evaluate the migration property of DWPU. Mp was one of the most important parameters to evaluate dye performance. Compared with DWPU-25, D2WPU exhibited excellent thermal migration properties with a Mp of only 4.43% (18.9% of DWPU-25). This could be attributed to the strong chemical bond between DV26 and the WPU molecular chain. In addition, as the reaction temperature increased, the final conversion of DV26 increased, which reduced the Mp of DWPU. As the concentration and the reaction temperature of DV26 increased, the content of the chain extender (DV26) reacting with WPU increased, eventually resulting in an increase in the Mn of DWPU.
3.6 Water resistance
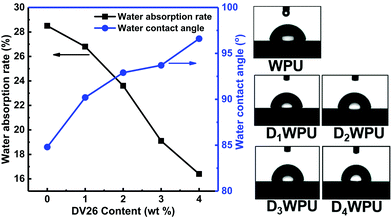
Polymeric dyes are inevitably exposed to water during applications. The stability and service life of polymeric dyes with poor water resistance deteriorate seriously after contact with water. The water resistance of DWPUs was evaluated by measuring the water absorption rate and water contact angle. The water absorption rates of DWPUs decreased remarkably with the increase in concentration of DV26, while the contact angle increased significantly (Fig. 8). The introduction of hydrophobic DV26 into the WPU molecular chain could enhance the hydrophobicity of WPU. In addition, the urea group formed by the reaction of primary amino group with isocyanate could constitute more hydrogen bonding force, which could function as a physical crosslinking point. The combined effect of increasing hydrophobicity and hydrogen bonding forces made the water absorption rate decrease and the contact angle increase. Therefore, after DV26 was introduced, the water resistance of DWPU was greatly improved.3.7 Thermal properties
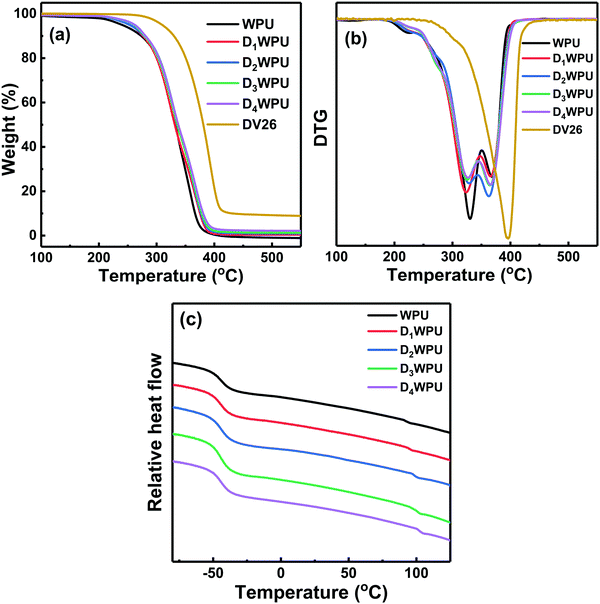
Because the coloration of polymeric dyes must be carried out at high temperatures, thermal stability is a significant factor in their performance for applications. The thermal properties of the flame-retardant polymeric dyes were evaluated using TGA, DTG and DSC (Fig. 9 and Table 6).| Sample | T 5% (°C) | T 1max (°C) | T 2max (°C) | T 3max (°C) | Char yield (%) | T gs (°C) | T gh (°C) | ΔTg (°C) |
|---|---|---|---|---|---|---|---|---|
| WPU | 249.4 | — | 329.0 | 370.1 | 0.9 | −43.6 | 92.9 | 136.5 |
| D1WPU | 251.3 | 269.6 | 323.4 | 368.5 | 1.9 | −44.3 | 94.2 | 138.5 |
| D2WPU | 253.2 | 271.0 | 328.2 | 363.7 | 2.2 | −44.6 | 97.4 | 142.0 |
| D3WPU | 253.6 | 270.3 | 327.1 | 364.8 | 2.6 | −44.9 | 100.3 | 145.2 |
| D4WPU | 254.9 | 272.6 | 327.8 | 365.2 | 3.0 | −44.1 | 103.8 | 147.9 |
| DV26 | 309.7 | — | — | 396.4 | 9.3 | — | — | — |
The thermal decomposition of WPU without the addition of DV26 was divided into two degradation stages.35 The first stage was the decomposition of carbamate and urea groups in the hard segment, which occurred from 250 to 350 °C, with the maximum decomposition rate at 329.0 °C. The second stage between 350 and 420 °C was the decomposition of polyester in the soft segment, with the maximum decomposition rate at 370 °C. The char yield of WPU at 500 °C was only 0.9%. The pyrolysis process of DV26 had only one stage, which occurred in the range of 310–450 °C, and the maximum thermal decomposition temperature was 396 °C. The char yield of DV26 at 500 °C was as high as 9.3%. DV26 exhibited excellent thermal stability.
Due to the addition of DV26, more urea groups and hydrogen bonding were formed in the hard segment, which could improve the thermal stability of the hard segment in DWPUs. Moreover, the decomposition of the hard segment in DWPUs was delayed by DV26. Therefore, the thermal decomposition of DWPUs increased to three stages. The first stage between 250 and 280 °C was the decomposition of a part of the carbamate group in the hard segment, and the maximum degradation temperature was about 270 °C. The second stage was the decomposition of the remaining carbamate and urea groups in the hard segment, which occurred from 280 to 350 °C, with the maximum decomposition rate at 330 °C. The third stage between 350 to 420 °C was the decomposition of the soft segments, and the maximum decomposition temperature was 365 °C. The char yield of D4WPU at 500 °C was 3.0%, which was about 3 times that of WPU.
Because of the existence of micro-phase separation, WPU had two glass transition temperatures (Tg): the Tg of the soft segment (Tgs) and the Tg of the hard segment (Tgh). Generally, the difference value (ΔTg) between Tgs and Tgh could be utilized to characterize the degree of micro-phase separation in WPU. With the increased content of DV26, the Tgh of DWPU shifted to higher temperatures and the ΔTg increased from 136.5 to 147.9 °C. This indicated that the micro phase separation degree between the hard and soft segments enhanced, which was attributed to the stronger hydrogen bonding in the hard segment.
3.8 The properties of coated polyester fabrics
| Sample | Dry rub fastness | Wet rub fastness | Washing fastness |
|---|---|---|---|
| DWPU-25 | 4 | 3–4 | 3 |
| D1WPU | 4–5 | 4–5 | 4 |
| D2WPU | 4–5 | 4–5 | 4 |
| D3WPU | 4–5 | 4–5 | 4 |
| D4WPU | 4–5 | 4–5 | 4 |
4. Conclusions
In this work, a series of polymeric dyes based on WPU were successfully synthesized. The utility of UV absorption spectroscopy for monitoring the polymerization of WPU-based polymeric dyes was highlighted. This simple method was equally applicable to other polymeric dye systems. The end of the reaction could be determined from a curve of conversion versus time. The results showed that DV26 could be completely reacted at 70 °C for 2.5 h. The reaction mechanism corresponded to the autocatalytic reaction equation, basically. Moreover, the properties of DWPUs were characterized in detail. DWPUs exhibited good emulsion stability and Mp was only 4.43% (18.9% of DWPU-25). Due to the introduction of DV26, the thermal stability and water resistance of DWPUs were greatly improved. In the end, DWPUs were applied to polyester fabric coatings and showed excellent application properties.Conflicts of interest
The authors declare no competing financial interests.Acknowledgements
The authors are grateful for financial support from the National Key Research and Development Program of China (2016YFC0204400).References
- T. C. Wen and Y. J. Wang, Ind. Eng. Chem. Res., 1999, 38, 1415–1419 CrossRef CAS.
- Y. Cheng, L. Wei, Z. Li, R. Zhang, H. Wen, G. Bo, G. Chen, G. Ping, M. M. F. Yuen and C. P. Wong, Adv. Funct. Mater., 2011, 21, 4582–4588 CrossRef.
- V. García-Pacios, J. A. Jofre-Reche, V. Costa, M. Colera and J. M. Martín-Martínez, Prog. Org. Coat., 2013, 76, 1484–1493 CrossRef.
- M. Elgammal, S. Prévost, R. Schweins, R. Schneider and M. Gradzielski, Colloid Polym. Sci., 2014, 292, 1487–1500 CrossRef CAS.
- H. H. Wang and I. S. Tzun, J. Appl. Polym. Sci., 2015, 73, 245–253 CrossRef.
- H. Sardon, L. Irusta, M. J. Fernándezberridi, M. Lansalot and E. Bourgeatlami, Polymer, 2010, 51, 5051–5057 CrossRef CAS.
- E. C. Buruiana and T. Buruiana, Eur. Polym. J., 2001, 37, 2505–2511 CrossRef CAS.
- M. Beija, M. T. Charreyre and M. G. J. Martinho, Prog. Polym. Sci., 2011, 36, 568–602 CrossRef CAS.
- B. Jang, S. Y. Kim and J. Y. Do, Dyes Pigm., 2012, 94, 217–223 CrossRef CAS.
- Z. Chang, M. Zhang, A. G. Hudson, E. B. Orler, R. B. Moore, G. L. Wilkes and S. R. Turner, Polymer, 2013, 54, 6910–6917 CrossRef CAS.
- C. T. Huang and K. N. Chen, J. Appl. Polym. Sci., 2010, 100, 1919–1931 CrossRef.
- Z. Ge, W. Li and Y. Luo, Eur. Polym. J., 2009, 45, 530–536 CrossRef CAS.
- H. Mao, C. Wang and Y. Wang, New J. Chem., 2015, 39, 3543–3550 RSC.
- X. Hu, X. Zhang, J. Dai and J. Liu, J. Lumin., 2011, 131, 2160–2165 CrossRef CAS.
- S. Shang, K. L. Chiu and S. Jiang, J. Appl. Polym. Sci., 2017, 134, 44710 Search PubMed.
- S. Sami, E. Yildirim, M. Yurtsever, E. Yurtsever, E. Yilgor, I. Yilgor and G. L. Wilkes, Polymer, 2014, 55, 4563–4576 CrossRef CAS.
- X. Hu, X. Zhang, J. Liu and J. Dai, Polym. Int., 2014, 63, 453–458 CrossRef CAS.
- X. Hu, X. Zhang, J. Liu and J. Dai, J. Lumin., 2013, 142, 23–27 CrossRef CAS.
- I. Yilgör, E. Yilgör and G. L. Wilkes, Polymer, 2015, 58, A1–A36 CrossRef.
- H. Sardon, J. M. W. Chan, R. J. Ono, D. Mecerreyes and J. L. Hedrick, Polym. Chem., 2014, 5, 3547–3550 RSC.
- D. Filip and S. Vlad, Polym. Int., 2015, 63, 1944–1952 CrossRef.
- G. A. Alvarez, M. Fuensanta, V. H. Orozco, L. F. Giraldo and J. M. Martín-Martínez, Prog. Org. Coat., 2018, 118, 30–39 CrossRef CAS.
- J. Su, Y. Yan, Y. Chen, X. Zeng, H. Xiang, Y. Cui and X. Liu, Prog. Org. Coat., 2018, 119, 76–84 CrossRef CAS.
- J. Gu, H. Gu, C. Jin, S. Chen, L. Ni and X. Jie, Appl. Surf. Sci., 2018, 439, 589–597 CrossRef CAS.
- H. Mao, F. Yang, C. Wang, Y. Wang, D. Yao and Y. Yin, RSC Adv., 2015, 5, 3631–3639 Search PubMed.
- C. Zhou, T. Xie, R. Zhou, C. O. Trindle, Y. Tikman, X. Zhang and G. Zhang, ACS Appl. Mater. Interfaces, 2015, 7, 17209–17216 CrossRef CAS PubMed.
- N. I. Sakellarios and S. G. Kazarian, J. Chem. Thermodyn., 2005, 37, 621–626 CrossRef CAS.
- D. H. Yong, F. Y. Peng, J. Y. Li, D. Q. Cong and D. L. Tian, React. Kinet., Mech. Catal., 2010, 101, 41–48 CrossRef.
- C. Chai, J. Hou, X. Yang, G. Zheng, M. Huang and G. Li, Polym. Test., 2018, 69, 259–265 CrossRef CAS.
- L. Mashlyakovskiy, E. Khomko, V. Zaiviy and C. Tonelli, J. Polym. Sci., Part A: Polym. Chem., 2015, 38, 2579–2602 CrossRef.
- F. Schapman, J. P. Couvercelle and C. Bunel, Polymer, 1998, 39, 4955–4962 CrossRef CAS.
- A. A. Caraculacu and S. Coseri, Prog. Polym. Sci., 2001, 26, 799–851 CrossRef CAS.
- K. Hailu, G. Guthausen, W. Becker, A. König, A. Bendfeld and E. Geissler, Polym. Test., 2010, 29, 513–519 CrossRef CAS.
- S. K. Rath, A. M. Ishack, U. G. Suryavansi, L. Chandrasekhar and M. Patri, Prog. Org. Coat., 2008, 62, 393–399 CrossRef CAS.
- W. Gang, J. Li and Y. Luo, Polym. Degrad. Stab., 2016, 123, 36–46 CrossRef.
| This journal is © The Royal Society of Chemistry and the Centre National de la Recherche Scientifique 2020 |

