The effect of hybrid coatings based on hydrogel, biopolymer and inorganic components on the corrosion behavior of titanium bone implants†
Mariia
Saveleva
 *ab,
Alina
Vladescu
 cd,
Cosmin
Cotrut
 de,
Louis
Van der Meeren
a,
Maria
Surmeneva
d,
Roman
Surmenev
d,
Bogdan
Parakhonskiy
 *a and
Andre G.
Skirtach
 a
a
aDepartment of Biotechnology, Faculty of Bioscience Engineering, Ghent University, Coupure Links 653, 9000 Ghent, Belgium. E-mail: bogdan.parakhonskiy@ugent.be
bEducational and Research Institute of Nanostructures and Biosystem, Saratov State University, Astrakhanskaya 83, Saratov 410026, Russia. E-mail: mssaveleva@yandex.ru
cNational Institute of Research and Development for Optoelectronics – INOE 2000, Department for Advanced Surface Processing and Analysis by Vacuum Technologies, 409 Atomistilor St., 077125 Magurele, Romania
dPhysical Materials Science and Composite Materials Centre, Tomsk Polytechnic University, Lenin's Avenue, 30, Tomsk, 634050, Russia
eFaculty of Materials and Science Engineering, University Politehnica of Bucharest, Splaiul Independenţei 313, 060042, Bucharest, Romania
First published on 24th September 2019
Abstract
Modification of titanium (Ti) bone implant materials with hybrid organic–inorganic coatings is a novel promising approach to improve the osteoconductivity and osteointegration of implants and prevent their failure after implantation. However, in these coatings, which are mostly hydrophilic, chemically active moieties capable of releasing oxidizing ions can have a significant influence on the corrosion resistance of Ti, which is critical for the Ti implant osteointegration behavior. In this research, in order to study the dependence of the change of the corrosion behavior of Ti on the composition of the coating, Ti surfaces were modified with various coatings: organic (alginate hydrogel crosslinked with Ca2+ ions (Alg), and dextran sulfate (DS)), inorganic (porous calcium carbonate CaCO3), and composite organic–inorganic (Alg-CaCO3, DS-CaCO3). The morphology and composition of these materials before and after the corrosion experiment, performed in simulated body fluid (SBF), were followed by extensive characterization. Electrochemical impedance spectroscopy (EIS) was performed to study the corrosion behavior of the prepared materials in SBF. The characteristics obtained during the EIS measurements revealed the dependence of the variation of the corrosion resistance level on the composition of the coating. The bare Ti surface had the higher value of the total impedance compared with the modified surfaces, while the Ti surfaces modified with organic coatings demonstrated the best charge transfer resistance in comparison with the coatings containing the inorganic CaCO3 component and uncoated Ti.
Introduction
Titanium (Ti) is one of the most widely used materials for orthopaedic implants manufacturing and bone defects recovering due to its biocompatibility, remarkable mechanical properties and high corrosion resistance. The good osteointegration of Ti along with its inertness provides the long-lasting stability of a Ti implant, including protection against degradation and inflammation at the bone–implant interface.1 The new knowledge accumulated in the last decades on biological and physical–chemical aspects regarding the living tissue reactions with artificial materials, and regenerative and immunological processes, as well as continuous searching for and designing new bioinspired materials and techniques, encouraged the development of a new-generation of bioactive implants. These materials are foreseen to be capable of active interaction with the physiological environment in the surrounding tissues, which will improve osteointegration of an implant by stimulating osteogenesis and recovery of bone.1 Regarding the design of new improved Ti implants, special attention is paid to the development of the Ti surface, which interacts with the surrounding biological environment. Modern methods of Ti surface processing include: (i) to modify the surface topography of Ti in order to increase the surface roughness; and (ii) to deposit functional coatings on the Ti surface. The roughness of the implant surface strongly affects the adhesion of biomolecules and cells and cell colonization of the implant surface.2 The Ti surface can be structured by chemical etching,3 electrochemical oxidation,4 electrophoretic deposition,5 and abrasive techniques (sandblasting).6 Coating deposition offers a more elegant approach for improving not only the surface roughness, but also the implant functionality.7 Calcium phosphate and hydroxyapatite layers deposited on a Ti implant have been used as sources for two major bioinorganic ions of bone: calcium Ca2+ and phosphate PO43−, for stimulating osteoblast proliferation and osteogenesis.8 The techniques which are mostly used for the deposition of these coatings (e.g. plasma spraying deposition, radio frequency magnetron sputtering9–11) usually operate at extreme conditions, requiring a high vacuum, high temperature, high speed of particle projection, etc. The main drawback of these operating conditions is that they can introduce fatigue and destabilization of the deposited coating and the whole implant. Moreover, these deposited inorganic coatings often have crystallinity, morphology and phase composition different from natural bone mineral.12,13 Therefore, new approaches called biomimetic are intensively being developed. These approaches use mild conditions close to physiological (close to neutral pH 7 and normal body temperature 37 °C) and chemical reactions in an aqueous solution for the synthesis and deposition of biomimetic coatings on the surface of Ti.14,15 Such coatings are more similar to the bone biominerals and capable of releasing Ca2+ and PO43− more rapidly, and by these means promote new bone formation during osteoblast activity.16 Moreover, the mild conditions of coating deposition allow one to immobilize functional biomolecules including proteins, enzymes (alkaline phosphatase), growth factors, antibacterial and anti-inflammatory agents etc.17–21 into inorganic coatings in order to make them more functional. Application of biopolymers and hydrogels22–24 together with biominerals offers a new and interesting approach to create hybrid coatings,25–27 imitating natural bone composites, which consist of collagen and calcium phosphates. Such a system provides conditions (water environment, presence of Ca2+ and PO43− ions and biomolecules) close to those physiologically needed for osteoblast activity and osteogenesis.28,29However, any modification of the Ti surface will affect the corrosion behavior of the implant. The corrosion resistance is one of the major factors for the selection of an implant material, which can be used as a first step to predict the implant stability and osteointegration. The corrosion of Ti can induce implant degradation, inflammation of surrounding tissues due to contamination by the corrosion products and implant failure eventually.30,31 For this reason, all newly developed modifications of the Ti surface have to be firstly tested in terms of the corrosion behavior.
Ti is considered to be a metal with high corrosion resistance under physiological conditions and that is why it is widely used as a bone substitution material in curing bone defects.30,31 Nonetheless, during the inflammation process appearing after surgery, the Ti implant undergoes a chemical modification of its surface because of lipopolysaccharide biomolecules actively interacting with Ti and changing its corrosion resistance.32 Consequently, even a bare highly inert Ti implant can be subjected to corrosion under an aggressive physiological environment. The surface of Ti, modified with coatings consisting of biominerals, biopolymers and hydrogels, becomes hydrophilic and capable of accumulating ions at the surface–environment interface. Biopolymeric and hydrogel coatings are capable of soaking environmental liquid up along with ions including Na+, Cl−, etc., which are aggressive against the protective TiO2 film and can induce corrosion initiation and propagation.33 The corrosion behavior of commercially pure Ti coated with biopolymers (chitosan, gelatin and sodium alginate) was studied in the article of Kumari et al. 2018,34 and there it was revealed that spin-coated biopolymeric coatings improved the corrosion resistance of the Ti surface. Meanwhile, the corrosion behavior of Ti, modified with newly-developed hybrid coatings based on reactional biominerals, biopolymers and hydrogels, has been poorly studied so far.
Therefore, this study reports the results of the surface modification of Ti with various types of coatings, containing such components as porous calcium carbonate CaCO3, dextran sulfate (DS), and Ca2+-crosslinked alginate hydrogel (Alg), and characterization of their corrosion behavior in simulated body fluid (SBF) using electrochemical impedance spectroscopy (EIS), as well as their biological activity in SBF, regarding the capability of bone formation. To the best of our knowledge, a detailed comparison between these types of bioactive coatings in terms of their effect on the Ti corrosion resistance has not been done previously. Therefore, the aim of this study was to evaluate the Ti corrosion behavior after its surface modification with inorganic porous CaCO3, biopolymeric coatings (Alg and DS), and composite organic–inorganic coatings combining these components (Alg + CaCO3, DS + CaCO3). SBF was used as a model of physiological fluid for incubating the Ti samples.
Materials and methods
Modification of Ti with inorganic, organic and hybrid (organic/inorganic) coatings
Titanium (Ti) foil (thickness: 0.125 mm, purity: 99.6+%, initial surface treatment – annealed) was cut into samples representing square Ti sheets with a 1.5 cm side.Sample 1. Blank Ti plates.
Sample 2. Ti sample mineralized with porous CaCO3 (without any polymeric coating) labeled as Ti-CaCO3. In order to modify Ti with porous CaCO3 microparticles, Ti samples were placed in CaCl2 (Sigma-Aldrich) solution with 1 M concentration, and after that 1 M Na2CO3 (Sigma-Aldrich) solution was added. The system was placed in an ultrasonic bath for 1 min for performing an ultrasound-assisted chemical reaction between Ca2+ and CO32− ions for CaCO3 microparticle crystallization and depositing on the Ti surface. After the completion of the CaCO3 crystallization process, the mineralized Ti sample was washed twice with deionized water and dried at 60 °C in an oven.
Sample 3. Ti samples coated with Ca2+-crosslinked alginate hydrogel (Alg) (not mineralized) labeled as Ti-Alg. For preparing this coating, the Ti plates were immersed in sodium alginate (Alg) (Sigma-Aldrich) solution with a 5 mg mL−1 concentration for 10 min. After that, the Ti plate with absorbed Alg was placed in 1 M CaCl2 solution in order to cross-link Alg molecules with Ca2+ ions and achieve hydrogel formation. Finally, the Alg-coated Ti plate was washed twice with deionized water and dried at 40 °C.
Sample 4. Ti samples coated with dextran sulfate (DS) (Sigma-Aldrich) (not mineralized) labeled as Ti-DS. For preparing this coating, the Ti plates were immersed in dextran sulfate (DS) with a 5 mg mL−1 concentration for 10 min. After that, the Ti-DS sample was dried at 40 °C.
Sample 5. Ti samples coated with Ca2+-crosslinked alginate hydrogel, then mineralized with CaCO3, labeled as Ti-Alg-CaCO3. Ti-Alg samples, coated with Alg hydrogel as described for sample 3, were immersed in 1 M CaCl2 solution and treated under US for 1 min. Then 1 M Na2CO3 solution was added, and the US-assisted mineralization process representing CaCO3 microparticle formation in the Alg layer on the Ti surface was carried out for 1 min. After that, Ti-Alg-CaCO3 was washed twice with deionized water and dried at 40 °C.
Sample 6. Ti samples coated with dextran sulfate, then mineralized with CaCO3, labeled as Ti-DS-CaCO3. Ti-DS samples, coated as described for sample 4, were immersed in 1 M CaCl2 solution and treated under US for 1 min. Then, 1 M Na2CO3 solution was added, and the US-assisted mineralization process representing CaCO3 microparticle formation on the DS layer on the Ti surface was carried out for 1 min. After that, Ti-DS-CaCO3 was washed twice with deionized water and dried at 40 °C.
Characterization
High-resolution imaging of the hard samples (bare Ti and Ti-CaCO3) was performed in air using a Nanowizard® AFM (JPK instruments-Bruker, Berlin, Germany). Prior to the measurements, bare Ti and Ti-CaCO3 were dried in an oven (60 °C, 30 min). The chip contains 1 cantilever with a force constant of 42 N m−1. The length of this cantilever is 125 μm and the frequency is 330 kHz. The tip radius of the cantilever is around 7 nm, while the height of the tip is 10–15 μm. For all the AFM measurements calibration of the cantilevers was done in contact free mode. The operation mode used for imaging was the QI® mode. The obtained data were processed in the JPK data processing software.
Results and discussion
Bare Ti surface
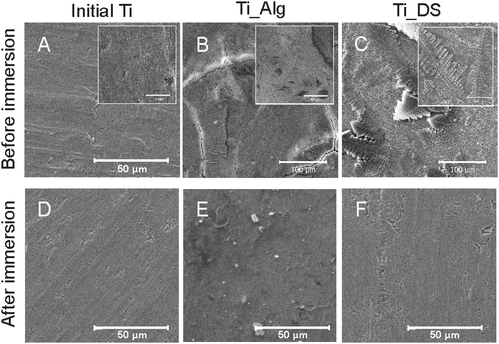
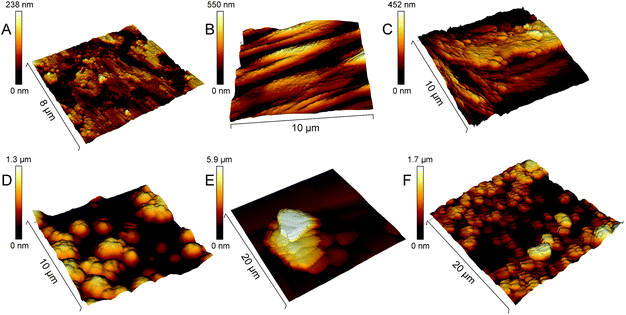
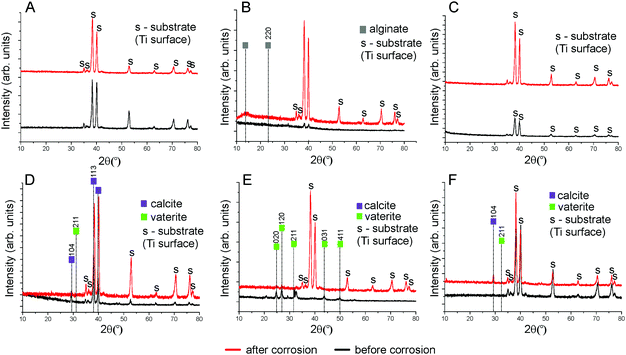
SEM images of the bare Ti surface before and after electrochemical tests are presented in Fig. 1A and D. It can be seen that no morphological changes of the Ti surface occurred after the corrosion process. The FTIR spectra and topography of the bare Ti surface are shown in Fig. 4 and 5A correspondingly. The XRD spectra of the initial Ti plate before and after corrosion are presented in Fig. 6A. One may observe that all peaks are attributed to Ti. The decrease of the peak intensities occurred after the corrosion experiments. Moreover, no salts were precipitated after the electrochemical tests in SBF and no oxides were formed on the Ti sample, revealing that no morphological changes of the Ti surface occurred. Due to the inertness of Ti, there is quite a low capability of adsorption and aggregation of macromolecules and inorganic complexes on its surface. Modification with hydrophilic coatings could overcome this limitation and bring bioactive properties to Ti to improve its osteointegration in vivo.Ti surface coated with Ca2+-crosslinked Alg hydrogel
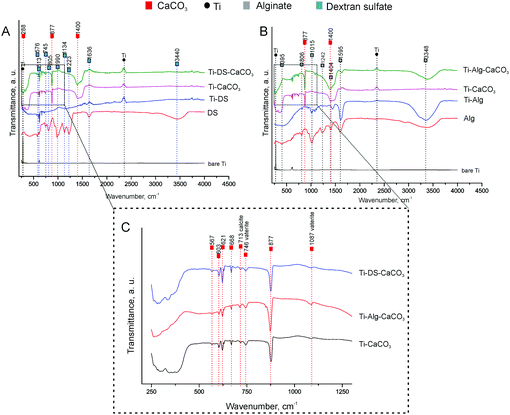
SEM images of the Ti surface coated with Ca2+ ion-crosslinked Alg hydrogel (Ti-Alg) before and after the electrochemical tests are shown in Fig. 1B and E. The initial Alg-coated Ti surface (Fig. 1B) exhibits the morphology characteristic of a dried alginate hydrogel layer. The average thickness of the alginic hydrogel coating at the Ti surface, measured from the SEM images of the sample cross-section, is determined as 4.5 ± 0.3 μm (Fig. 3). The FTIR spectrum of the Ti surface coated with the dried Alg-hydrogel was compared with the dried Ca2+-crosslinked alginate hydrogel piece (Fig. 4A). Ti-Alg demonstrates characteristic bands belonging to the Ca2+-crosslinked Alg hydrogel. The broad band at 3348 cm−1 arise from O–H stretching; the asymmetric stretching peak at 1595 cm−1 and symmetric 1404 cm−1 result from the interaction between the COO− groups of alginate and Ca2+ ions.36 The topography of the Alg hydrogel coated surface obtained by AFM is presented in Fig. 5B, and demonstrates a smooth wavelike surface coating probably representing the aligned orientation of chains consisting of ordered coordination complexes with calcium.37 After the corrosion process, the Alg layer seems to be partially removed or dissolved, most likely due to the interaction with SBF, while some depositions can be observed on the surface, probably precipitated from SBF (Fig. 1E). Based on the fact that there were no depositions on the bare Ti, alginate hydrogel chains support the interaction of the Ti surface with SBF ions.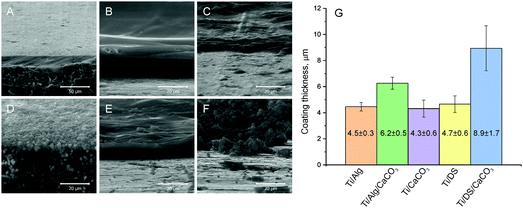 | ||
| Fig. 3 SEM images of cross-sections of bare Ti (A) and coated Ti: Ti-Alg (B), Ti-Alg-CaCO3 (C), Ti-CaCO3 (D), Ti-DS (E), and Ti-DS-CaCO3 (F); the average thickness of these coatings (G). | ||
The electrochemical tests in SBF stimulate the release of binding Ca2+ ions from the Alg hydrogel followed by its de-gelification. The XRD results of Alg-coated Ti before and after corrosion are shown in Fig. 6B. The peaks belonging to Alg found at 14° and 23°![[thin space (1/6-em)]](https://www.rsc.org/images/entities/char_2009.gif) 38 and a rise of the plot, which can be observed before corrosion, disappeared after corrosion. It can be explained by the removal of Alg from the Ti surface after the electrochemical tests in SBF due to the decomposition of guluronate coordination complexes with Ca2+.
38 and a rise of the plot, which can be observed before corrosion, disappeared after corrosion. It can be explained by the removal of Alg from the Ti surface after the electrochemical tests in SBF due to the decomposition of guluronate coordination complexes with Ca2+.
Ti surface coated with DS
SEM images of the Ti surface coated with DS (Ti-DS) before and after the electrochemical tests are shown in Fig. 1(C) and (F). Before immersion, the surface morphology of DS-modified Ti exhibits an inhomogeneous coating (the thickness is 4.7 ± 0.6 μm) which is similar to the dried DS polymeric layer. The topography of the Ti-DS exhibits surface inhomogeneities as well, which corresponds with surface morphology of this sample at the SEM image (Fig. 5C). After immersion, the sample surface is similar to the bare Ti surface. Also, no salt precipitates can be found on the Ti-DS surface after the electrochemical tests. This fact reveals that DS doesn’t support the SBF ion interaction with the surface. Thus, it can be settled that the DS adsorption doesn’t improve the bioaffinity of the Ti surface.FTIR spectra of the Ti-DS surface and DS polymer are shown in Fig. 4A. It can be observed that the spectra of Ti-DS have no bands of pure DS at 1223 cm−1 (asymmetric vibration of the S![[double bond, length as m-dash]](https://www.rsc.org/images/entities/char_e001.gif) O bond), 990 cm−1 (symmetric vibration of the S
O bond), 990 cm−1 (symmetric vibration of the S![[double bond, length as m-dash]](https://www.rsc.org/images/entities/char_e001.gif) O bond), 805 cm−1 (asymmetric vibration of the O–S–O bond), and 576 cm−1 (symmetric vibration of the O–S–O bond).39 XRD results of DS-coated Ti before and after the electrochemical tests are shown in Fig. 6C, and here peaks characteristic of DS were also not revealed in the case of the Ti-DS surface.
O bond), 805 cm−1 (asymmetric vibration of the O–S–O bond), and 576 cm−1 (symmetric vibration of the O–S–O bond).39 XRD results of DS-coated Ti before and after the electrochemical tests are shown in Fig. 6C, and here peaks characteristic of DS were also not revealed in the case of the Ti-DS surface.
Ti-CaCO3 surface
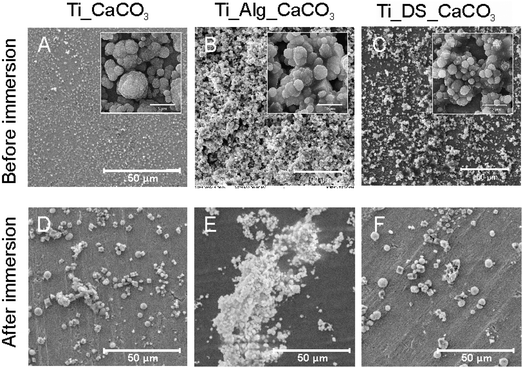
SEM images of mineralized Ti samples (Ti-CaCO3) are presented in Fig. 2A and D. The surface of Ti coated with CaCO3 microparticles before corrosion (Fig. 2A) demonstrates a uniform coating, consisting of aggregates of spherical porous vaterite CaCO3 microparticles, with the average diameter of the vaterite particles being 3.4 μm ± 0.5 μm (Fig. S2, ESI†) and the thickness of the coating being 4.3 ± 0.6 μm (Fig. 3B). The FTIR spectrum of the mineralized Ti plate is shown in Fig. 4A–C. Bands characteristic of CaCO3 can be observed at 1400 cm−1 (ν3 asymmetric stretching of carbonate groups) and at 877 cm−1 (ν2 bending of carbonate groups). The magnified section in the wavenumber range 250–1300 cm−1 demonstrates the fingerprint and far-infrared regions of the mineralized samples (Fig. 4C), containing bands which allow one to distinguish CaCO3 polymorphic modifications, particularly calcite and vaterite. The vibrational bands at 746 cm−1 (ν4 bending of C–O) and 1087 cm−1 (ν1 bending of C–O) are attributed to vaterite. Calcite crystals exhibit bands at 713 cm−1 (ν4 bending of C–O). The vibrational bands in the section in the wavenumber range 250–400 cm−1 represent lattice frequencies of CaCO3 crystals.40,41 The AFM topography of Ti-CaCO3 demonstrates aggregates of microparticles on the surface (Fig. 5D). After the electrochemical tests (Fig. 2D), the general increase of the vaterite particle size (up to 6 μm) and the presence of cubic calcite particles can be observed (the average size of calcite particles is 2.6 μm ± 0.6). It can be explained by the CaCO3 microparticle interaction with the salt ions (Ca2+, HPO42−, Mg2+) of the SBF environment and the following transformation of the microparticle morphology due to this interaction. The XRD diffractogram for the Ti plate coated with CaCO3 microparticles is presented in Fig. 6D. Before corrosion, the XRD spectrum exhibits peaks characteristic of calcite (the (113) plane at 39.4°, and the (104) plane at 29.4°), and no peaks attributed to vaterite, although FTIR demonstrated intense vaterite peaks. After corrosion, the vaterite peak of the (211) plane at 32.8° appeared, which corresponds with the SEM images of samples after corrosion, demonstrating big spherical particles (Fig. 2D).Ti-Alg-CaCO3 surface
The Ti surfaces coated with vaterite-mineralized Alg hydrogel (Ti-Alg-CaCO3) before and after the electrochemical tests are presented in Fig. 2B and E. The sample surface before the electrochemical tests demonstrates a mixture of spherical vaterite microparticles (the average diameter is 3.7 ± 0.8 μm), adsorbed and incorporated in the Alg hydrogel. It should be noted that the average diameter of vaterite particles in Ti-Alg-CaCO3 is larger than that of those of Ti-CaCO3. The thickness of the coating is 6.2 ± 0.5 μm.The FTIR spectrum of the Ti-Alg-CaCO3 surface (Fig. 4A) contains a band at 3358 cm−1 resulting from water bond O–H stretching, which is shifted to the high-frequency region and demonstrates a reduced absorbance percentage at this frequency in comparison with the Ti-Alg surface. The band at 1605 cm−1 is attributed to asymmetric stretching of the COO− group of the Alg molecule, shifted to the high-frequency region, and has reduced absorbance as well. This shifting can be explained by the formation of additional guluronate-Ca2+ coordination complexes after mineralization due to the penetration of excess Ca2+ ions and their interaction with uncompensated guluronate chains. The bands at 1242 cm−1 and 1015 cm−1, attributed to C–O stretching and to the vibration of the C–O bond of the glycosidic group of Alg correspondingly,42 have disappeared. This can be caused by breaking of some glycosidic bonds of guluronate complexes with Ca2+ ions caused by ultrasonic treatment during the mineralization process. Therefore, the changing of the alginic hydrogel chain structure can be observed after the mineralization process. The band at 1404 cm−1 (symmetric stretching of the COO− group of the Alg molecule) overlapped with that at 1400 cm−1 (ν3 asymmetric stretching of carbonate groups of CaCO3).
The bands characteristic of CaCO3 remained unchanged including the sharp intense peak at 877 cm−1 (ν2 bending of the carbonate groups of CaCO3), which demonstrates higher intensity in comparison with the one for the Ti-CaCO3 surface (Fig. 4C). Moreover, the band at 1087 cm−1 characteristic of vaterite demonstrates higher absorption. Increased adsorption at 877 cm−1 and 1087 cm−1 reveals an increase of the CaCO3 (especially vaterite) amount, as compared with Ti-CaCO3. The vibrational bands representing the vaterite phase (ν4 bending of C–O at 746 cm−1, and ν1 bending of C–O at 1087 cm−1) and the calcite phase (ν4 bending of C–O at 713 cm−1) were unchanged. Also, the absorption in the far-infrared region (in range 250–400 cm−1) indicates the presence of a crystal lattice, most likely the presence of CaCO3 crystals, corresponding with the Ti-CaCO3 spectra and confirming CaCO3 crystals in the Alg hydrogel, while the absorption in this region is not observed for the Alg and Ti-Alg samples.
The topography of the Ti-Alg-CaCO3 surface obtained by AFM (Fig. 5E) exhibits aggregation of microparticles on a smooth layer.
After the electrochemical experiments, there were some morphological changes of CaCO3 observed, which occurred probably due to transformation in the course of the interaction with SBF ions. The accumulation of microparticles, predominantly having a spherical shape (average diameter in the range 1.9–3.8 μm), can be observed (Fig. 2E). The XRD spectra for the Ti plate coated with mineralized Alg before and after corrosion are shown in Fig. 6E. Peaks of vaterite can be observed ((020) at 24.9°, (120) at 27°, (211) at 32.8°, (031) at 43.8°, and (411) at 50°) for the initial sample before corrosion. After incubation in SBF, the planes of (020) at 24.9°, (120) at 27°, and (211) at 32.8° remained, with their intensity dramatically decreased. It can also be explained by partial dissolution of the Alg hydrogel followed by washing out of a part of the CaCO3 microparticles.
Ti-DS-CaCO3 surface
The SEM images of Ti coated with mineralized DS (Ti-DS-CaCO3) before and after the electrochemical experiments can be seen in Fig. 2(C) and (F). Before the electrochemical tests, significant accumulation of vaterite microparticles can be observed, with the average diameter of the particles being 3.4 ± 0.6 μm (Fig. 2C). The coating is more inhomogeneous compared to the CaCO3 and Alg-CaCO3 coatings; the average thickness of the coating is 8.9 ± 1.7 μm. After the electrochemical tests, the number of CaCO3 microparticles significantly decreased. The appearance and prevalence of spherical microparticles can be observed (the average spherical CaCO3 particle diameter is 5.4 μm ± 1.2 μm) (Fig. 2F). It can be explained by a transformation process of CaCO3 due to the interaction with SBF ions during the electrochemical experiments. After the immersion process, the morphology of the particles is the same as in the case of Ti-CaCO3, revealing that the modification with DS doesn’t have any effect on the coating behavior.The FTIR spectrum of Ti-DS-CaCO3 (Fig. 4A) doesn’t reveal bands characteristic of DS, as in the case of the Ti-DS sample. Only the far-infrared region of the FTIR spectrum (Fig. 4C) reveals that the slope is different from the Ti-CaCO3 spectrum, which indicates the presence of some molecules different from inorganic CaCO3. It could be a sign of the presence of a very small amount of DS molecules in the coating. The fingerprint region (Fig. 4C) contains bands attributed to vaterite (746 cm−1 and 1087 cm−1) and calcite (713 cm−1); the absorption of the vaterite bands is lower to some extent in comparison with these bands in the Ti-CaCO3 and Ti-Alg-CaCO3 spectra. The CaCO3 characteristic band at 877 cm−1 decreased its adsorption compared with Ti-Alg-CaCO3.
The topography of the Ti-DS-CaCO3 surface (Fig. 5F) demonstrates a coating consisting of particle aggregates. The DS-CaCO3 layer (8.9 ± 1.7 μm) is thicker compared with Alg-CaCO3 (6.2 ± 0.5 μm).
The XRD diffractograms of the Ti plate coated with mineralized DS before and after corrosion are shown in Fig. 6F. Clear peaks for vaterite (211 at 32.8°) and calcite (104 at 29.4°) can be distinguished only in the diffractogram of the sample after the electrochemical tests (also, the magnified section of the diffractogram, which confirms the presence of peak 211 at 32.8°, can be found in Fig. S3 in the ESI†).
Comparisons of the average roughness and average Young's modulus of the modified Ti surfaces are presented in Fig. 7A and B correspondingly. The presence of the vaterite CaCO3 phase in the composition of the coatings results in a significant increase of the surface roughness; while the hydrogel coating (Ti-Alg) demonstrates the most negligible roughness. Among the modified Ti surfaces, the Young's modulus value is higher in the case of the vaterite-mineralized surface. The presence of the Alg hydrogel or DS polymer in the coating composition decreases the modulus of elasticity of the surface. The Alg coating reveals the most decreased Young's modulus value.
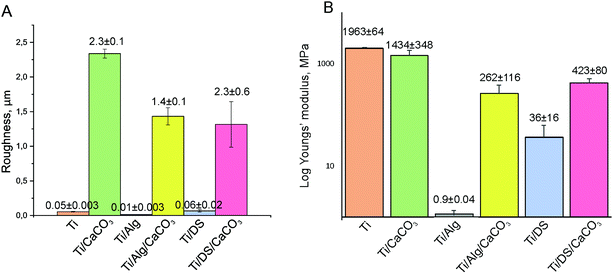 | ||
| Fig. 7 Average surface roughness of the modified Ti surfaces (A); the average Youngs’ modulus of the modified Ti surfaces (B). | ||
EIS experiment
The Nyquist and the Bode phase and amplitude plots of the impedance data are presented in Fig. 8. The chosen equivalent electrical circuit for fitting of impedance data was a Randles circuit (R(QR)). The curves corresponding to the fitting of the measured data are also plotted. By analysing the obtained data in the form of a Nyquist plot, one may observe higher semicircles exhibited by the bare Ti specimen, followed by Ti-DS and Ti-Alg. However, the mineralized specimens showed lower semicircles. The same trend was confirmed also by the impedance modulus shown in the low frequency range in the Bode amplitude plot. The obtained impedance parameters (Rs – the electrolyte resistance, Qdl and ndl – associated parameters of the Constant Phase Element (CPE), and Rct – the charge transfer resistance) are presented in Table 1. Also, the relative standard errors associated with each parameter and chi-squared values (χ2) obtained for each investigated system are also given. Note the low χ2 values (χ2 ≤ 4 × 10⁻³), indicating excellent agreement between the experimental and the simulated results.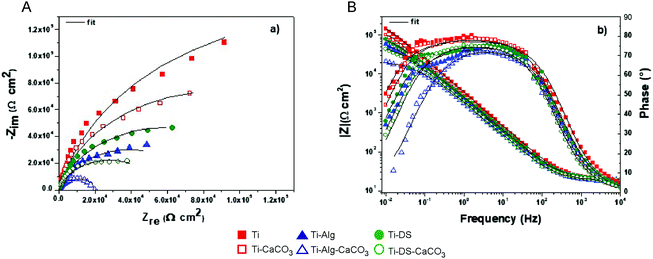 | ||
| Fig. 8 Nyquist (A) and Bode (B) phase and amplitude plots of the impedance data (scattered points – measured impedance data, solid line – fitted curves). | ||
| Sample | E OC (mV) | R s (Ω cm2) | Q dl (μF s(n−1) cm−2) | n dl | R ct (kΩ cm2) | χ 2 |
|---|---|---|---|---|---|---|
| Relative standard error (%). | ||||||
| Ti | 35 ± 2 | 19.05 ± 0.03 (1%) | 59.83 ± 1.57 (1%) | 0.87 ± 0.001 (0.3%) | 31.84 ± 2.58 (6%) | 0.002 ± 5 × 10⁻⁴ |
| Ti-CaCO3 | −20 ± 1 | 18.11 ± 0.06 (1%) | 77.64 ± 1.24 (1%) | 0.88 ± 0.001 (0.3%) | 17.99 ± 1.82 (4%) | 0.002 ± 5 × 10⁻⁴ |
| Ti-Alg | −23 ± 1 | 18.79 ± 0.09 (1.7%) | 98.73 ± 2.34 (1.3%) | 0.83 ± 0.002 (0.4%) | 78.83 ± 3.54 (4.3%) | 0.004 ± 8 × 10⁻⁴ |
| Ti-Alg-CaCO3 | −270 ± 8 | 17.33 ± 0.07 (2%) | 119.90 ± 3.08 (2%) | 0.83 ± 0.002 (0.5%) | 2.11 ± 0.57 (3%) | 0.004 ± 8 × 10⁻⁴ |
| Ti-DS | −41 ± 2 | 19.32 ± 0.09 (1.3%) | 85.66 ± 1.86 (1%) | 0.84 ± 0.001 (0.3%) | 121.10 ± 6.89 (4%) | 0.002 ± 5 × 10⁻⁴ |
| Ti-DS-CaCO3 | −106 ± 3 | 19.20 ± 0.08 (1%) | 110.20 ± 2.98 (1%) | 0.85 ± 0.001 (0.3%) | 5.65 ± 1.07 (2.5%) | 0.002 ± 5 × 10⁻⁴ |
The results of the electrochemical experiments reveal that the bare Ti surface has the higher total impedance value in comparison with the surfaces modified with coatings containing vaterite, the Alg hydrogel and the biopolymer (DS) (Fig. 8A). The Ti surfaces with the hybrid coatings (Ti-Alg-CaCO3 and Ti-DS-CaCO3) demonstrate the lowest values of the total impedance; Ti-Alg-CaCO3 has the most decreased resistance. Comparing the one-component coatings, it can be seen that the inorganic coating (the Ti-CaCO3 sample) has a higher total impedance value than the organic coatings (Ti-Alg and Ti-DS). Analysis of the Bode plot (Fig. 8B) shows that the curves are slightly dispersed in the low frequency region, which can be associated with the response of the outer layers of the surfaces. On the other hand, the curves are almost congruent in the high frequency region, which can be associated with the response of the SBF solution. These facts can be explained by the difference in the interaction behavior of the coatings with the SBF solution for each type of sample due to different compounds of the coatings.
The parameters obtained by fitting the experimental data with the proposed equivalent electrical circuit (Table 1) show the same signs of decreased corrosion resistance in the case of the hybrid coatings. The decrease of the values of Rct for Ti-CaCO3, Ti-Alg-CaCO3 and Ti-DS-CaCO3 could be explained by the interaction between SBF ions and CaCO3 particles at the interface of the sample surface, in the course of which the vaterite undergoes recrystallization. This process causes the high concentration of solution ions and products of the reaction in the interface area and supports intensive exchange between the solution and the coating. At the same time, Ti with organic coatings demonstrates significantly enhanced charge transfer resistance (78.83 kΩ cm2 for Ti-Alg and 121.10 kΩ cm2 for Ti-DS) in comparison with bare Ti (31.84 kΩ cm2), indicating that the organic coatings could inhibit the interaction of the Ti surface with SBF. However, on the other hand, this prevents mineralization of the Ti surface in SBF, which can be seen in the SEM images (Fig. 1E and F) and XRD diffractograms (Fig. 6B and C) of the Alg- and DS-coated Ti surfaces after the electrochemical experiments. The parameter Qdl increases in the case of the modified surfaces, especially the surfaces coated with hybrid layers, which exhibited the highest values of Qdl (119.90 μF s(n−1) cm−2 for Ti-Alg-CaCO3, and 110.20 μF s(n−1) cm−2 for Ti-DS-CaCO3), indicating decreased values of the CPE impedance.
Conclusions
In this study, Ti foil surfaces were modified with biologically active, biodegradable coatings: inorganic (vaterite CaCO3), organic (Ca2+-crosslinked Alg hydrogel and biopolymer DS), and hybrid organic–inorganic coatings (vaterite-mineralized Alg hydrogel and mineralized DS). These surfaces with various modifications were characterized, and the corrosion behavior of these surfaces was studied in SBF by electrochemical impedance spectroscopy in order to estimate the influence of the biodegradable coatings on the corrosion resistance of Ti. Also, the biological activity of the modified Ti surfaces as potential bone implant materials was evaluated by electrochemical tests in SBF.According to the obtained results, the following conclusions can be drawn:
• The inorganic and hybrid coatings interacted with the ions of the SBF solution more intensively than the one-component organic coatings. This can make sense in relation to processes of biomineralization of Ti under physiological conditions, regarding application for bone implantation.
• The inorganic (vaterite) and hybrid coatings demonstrated the most decreased corrosion resistance in SBF in comparison with the uncoated Ti surface and organic coatings.
• The best capacitive response was shown in the case of the specimens which contained no inorganic component (vaterite). The charge transfer resistance in SBF is higher for the Ti-Alg and especially Ti-DS coatings, evidencing better stability after a short time of immersion.
Based on the above mentioned findings, it can be concluded that the types of coatings which demonstrated higher activity in the interaction with SBF at the same time caused the faster degradation of the Ti surface. These findings of examination of bioactive coatings with various composition are practically significant for the Ti coating selection, while considering their influence on the properties and stability of the Ti implant surface under physiological conditions.
Conflicts of interest
There are no conflicts to declare.Acknowledgements
M. S. thanks the Era-Net Rus Plus program for support in the frame-work of the project “Fabrication and investigation of new hybrid scaffolds with the controlled porous hierarchy for bone tissue engineering” (Intelbiocomp). The research was conducted at National Research Tomsk Polytechnic University within the framework of a Tomsk Polytechnic University Competitiveness Enhancement Program grant. The work was supported by the grant of the Romanian National Authority for Scientific Research and Innovation, CCCDI – UEFISCDI, project no. PN-III-P1-1.2-PCCDI-2017-0239/60PCCDI/2018, within PNCDI III. We also thank BOF UGent (01IO3618, BAS094-18, BOF14/IOP/003) and FWO-Vlaanderen (G043219, 1524618N, G0D7115N) for support. The authors thank Vsevolod Atkin for providing scanning electron microscopy measurements.References
- R. Tejero, E. Anitua and G. Orive, Prog. Polym. Sci., 2014, 39, 1406–1447 CrossRef CAS.
- C. J. Wilson, R. E. Clegg, D. I. Leavesley and M. J. Pearcy, Tissue Eng., 2005, 11, 1–18 CrossRef CAS PubMed.
- J. Hasan, S. Jain and K. Chatterjee, Sci. Rep., 2017, 7, 41118 CrossRef CAS PubMed.
- Y.-T. Sul, C. B. Johansson, S. Petronis, A. Krozer, Y. Jeong, A. Wennerberg and T. Albrektsson, Biomaterials, 2002, 23, 491–501 CrossRef CAS PubMed.
- F. Pishbin, L. Cordero-Arias, S. Cabanas-Polo and A. R. Boccaccini, Surf. Coat. Modif. Met. Biomater., 2015, 359–377 CAS.
- B. Daniel, N. Thomas, O. Thomas, D. L. Cochran, R. K. Schenk, H. H. Peter, S. Daniel and N. Lutz-Peter, J. Biomed. Mater. Res., 1999, 45, 75–83 CrossRef.
- J. Raphel, M. Holodniy, S. B. Goodman and S. C. Heilshorn, Biomaterials, 2016, 84, 301–314 CrossRef CAS PubMed.
- M. Valletregi, Prog. Solid State Chem., 2004, 32, 1–31 CrossRef CAS.
- C. P. A. T. Klein, P. Patka, J. G. C. Wolke, J. M. A. de Blieck-Hogervorst and K. de Groot, Biomaterials, 1994, 15, 146–150 CrossRef CAS PubMed.
- K.-Y. Hung, H.-C. Lai and H.-P. Feng, Coatings, 2017, 7, 126 CrossRef.
- M. A. Surmeneva, E. A. Chudinova, I. Y. Grubova, O. S. Korneva, I. A. Shulepov, A. D. Teresov, N. N. Koval, J. Mayer, C. Oehr and R. A. Surmenev, Ceram. Int., 2016, 42, 1470–1475 CrossRef CAS.
- M. Furkó, K. Balázsi and C. Balázsi, Rev. Adv. Mater. Sci., 2017, 48, 25–51 Search PubMed.
- R. L. Reis and S. Weiner, Learning from Nature How to Design New Implantable Biomaterials: From Biomineralization Fundamentals to Biomimetic Materials and Processing Routes: Proceedings of the NATO Advanced Study Institute, held in Alvor, Algarve, Portugal, 13–24 October 2003, Springer Science & Business Media, 2005, vol. 171.
- A. Vladescu, D. M. Vranceanu, S. Kulesza, A. N. Ivanov, M. Bramowicz, A. S. Fedonnikov, M. Braic, I. A. Norkin, A. Koptyug, M. O. Kurtukova, M. Dinu, I. Pana, M. A. Surmeneva, R. A. Surmenev and C. M. Cotrut, Sci. Rep., 2017, 7, 16819 CrossRef PubMed.
- F. Barrere, M. M. E. Snel, C. A. Van Blitterswijk, K. De Groot and P. Layrolle, Biomaterials, 2004, 25, 2901–2910 CrossRef CAS PubMed.
- N. Saffarian Tousi, M. F. Velten, T. J. Bishop, K. K. Leong, N. S. Barkhordar, G. W. Marshall, P. M. Loomer, P. B. Aswath and V. G. Varanasi, Mater. Sci. Eng., C, 2013, 33, 2757–2765 CrossRef CAS PubMed.
- D. H. Yang, D.-W. Lee, Y.-D. Kwon, H. J. Kim, H. J. Chun, J. W. Jang and G. Khang, J. Tissue Eng. Regener. Med., 2015, 9, 1067–1077 CrossRef CAS PubMed.
- C. Chen, H. Li, X. Kong, S.-M. Zhang and I.-S. Lee, Int. J. Nanomed., 2015, 10, 283–295 Search PubMed.
- C. Muderrisoglu, M. Saveleva, A. Abalymov, L. Van der Meeren, A. Ivanova, V. Atkin, B. Parakhonskiy and A. G. Skirtach, Adv. Mater. Interfaces, 2018, 1800452 CrossRef.
- R. Chen, M. D. P. Willcox, K. K. K. Ho, D. Smyth and N. Kumar, Biomaterials, 2016, 85, 142–151 CrossRef CAS PubMed.
- D. Nancy and N. Rajendran, Int. J. Biol. Macromol., 2018, 110, 197–205 CrossRef CAS PubMed.
- T. E. L. Douglas, S. Kumari, K. Dziadek, M. Dziadek, A. Abalymov, P. Cools, G. Brackman, T. Coenye, R. Morent, M. K. Mohan and A. G. Skirtach, Mater. Lett., 2017, 196, 213–216 CrossRef CAS.
- D. Gregurec, G. Wang, R. H. Pires, M. Kosutic, T. Ludtke, M. Delcea and S. E. Moya, J. Mater. Chem. B, 2016, 4(11), 1978–1986 RSC.
- S. H. Noh, E. H. Kim, G. D. Han, J. W. Kim, Y. Ito, J.-G. Lee and T. Il Son, Macromol. Res., 2017, 25, 1192–1198 CrossRef CAS.
- F. Ordikhani, S. P. Zustiak and A. Simchi, JOM, 2016, 68, 1100–1108 CrossRef CAS.
- M. A. E. Cruz, G. C. M. Ruiz, A. N. Faria, D. C. Zancanela, L. S. Pereira, P. Ciancaglini and A. P. Ramos, Appl. Surf. Sci., 2016, 370, 459–468 CrossRef CAS.
- M. Catauro, F. Bollino, F. Papale, R. Giovanardi and P. Veronesi, Mater. Sci. Eng., C, 2014, 43, 375–382 CrossRef CAS PubMed.
- T. E. L. Douglas, J. Schietse, A. Zima, S. Gorodzha, B. V. Parakhonskiy, D. KhaleNkow, R. Shkarin, A. Ivanova, T. Baumbach, V. Weinhardt, C. V. Stevens, V. Vanhoorne, C. Vervaet, L. Balcaen, F. Vanhaecke, A. Slośarczyk, M. A. Surmeneva, R. A. Surmenev and A. G. Skirtach, J. Biomed. Mater. Res., Part A, 2017, 106, 822–828 CrossRef PubMed.
- T. E. L. Douglas, A. Łapa, S. K. Samal, H. A. Declercq, D. Schaubroeck, A. C. Mendes, P. Van der Voort, A. Dokupil, A. Plis, K. De Schamphelaere, I. S. Chronakis, E. Pamuła and A. G. Skirtach, J. Tissue Eng. Regener. Med., 2017, 11, 3556–3566 CrossRef CAS PubMed.
- L. H. Hihara, R. P. I. Adler and R. M. Latanision, Environmental degradation of advanced and traditional engineering materials, CRC Press, 2013 Search PubMed.
- Degradation of Implant Materials, ed. N. Eliaz, Springer New York, New York, NY, 2012 Search PubMed.
- F. Yu, O. Addison, S. J. Baker and A. J. Davenport, Int. J. Oral Sci., 2015, 7, 179–186 CrossRef CAS PubMed.
- T. P. Chaturvedi, Indian J. Dent. Res., 2009, 20, 91 CrossRef CAS PubMed.
- S. Kumari, H. R. Tiyyagura, T. E. L. Douglas, E. A. A. Mohammed, A. Adriaens, R. Fuchs-Godec, M. K. Mohan and A. G. Skirtach, Mater. Des., 2018, 157, 35–51 CrossRef CAS.
- T. Kokubo and H. Takadama, Biomaterials, 2006, 27, 2907–2915 CrossRef CAS PubMed.
- H. Daemi and M. Barikani, Sci. Iran., 2012, 19, 2023–2028 CrossRef CAS.
- I. Braccini and S. Pérez, Biomacromolecules, 2001, 2, 1089–1096 CrossRef CAS PubMed.
- G. Yang, L. Zhang, T. Peng and W. Zhong, J. Membr. Sci., 2000, 175, 53–60 CrossRef CAS.
- M. Cakić, G. Nikolić, L. Ilić and S. Stanković, Chem. Ind. Chem. Eng. Q., 2005, 11, 74–78 CrossRef.
- F. A. Miller and C. H. Wilkins, Anal. Chem., 1952, 24, 1253–1294 CrossRef CAS.
- F. A. Andersen, L. Brecevic, G. Beuter, D. B. Dell’Amico, F. Calderazzo, N. J. Bjerrum and A. E. Underhill, Acta Chem. Scand., 1991, 45, 1018–1024 CrossRef CAS.
- W.-P. Voo, B.-B. Lee, A. Idris, A. Islam, B.-T. Tey and E.-S. Chan, RSC Adv., 2015, 5, 36687–36695 RSC.
Footnote |
| † Electronic supplementary information (ESI) available. See DOI: 10.1039/c9tb01287g |
| This journal is © The Royal Society of Chemistry 2019 |

