Lysosome-specific sensing and imaging of pH variations in vitro and in vivo utilizing a near-infrared boron complex†
Yuxiang
Shi
a,
Xiangchun
Meng
a,
Huiran
Yang
a,
Linna
Song
a,
Shujuan
Liu
*a,
Aqiang
Xu
a,
Zejing
Chen
a,
Wei
Huang
 *ab and
Qiang
Zhao
 *a
*a
aKey Laboratory for Organic Electronics and Information Displays & Jiangsu Key Laboratory for Biosensors, Institute of Advanced Materials (IAM), Nanjing University of Posts and Telecommunications (NUPT), Nanjing 210023, P. R. China. E-mail: iamqzhao@njupt.edu.cn; provost@nwpu.edu.cn; Fax: +86 25-85866396
bShaanxi Institute of Flexible Electronics (SIFE), Northwestern Polytechnical University (NPU), Xi'an 710072, Shaanxi, China
First published on 26th April 2019
Abstract
As a focus issue, the study of lysosomal pH has attracted much attention as it is closely associated with the state of lysosome, which plays a vital role in endocytosis and autophagy. In order to investigate the lysosomal pH, fluorescence bioimaging is one of the most widely-explored approaches. Unfortunately, the probes are insufficient to absorb or emit in the near-infrared (NIR) region, which could minimize photodamage to organisms and maximize tissue penetration in living systems. As a novel family of NIR dyes, hemicyanine has been selected for NIR bioimaging and biosensing owing to its excellent optical properties, easy preparation and good biocompatibility. Employing a classic rhodamine–hemicyanine hybrid, we first designed and synthesized a NIR boron complex (HCy-BIZ-BF2) with lysosome-targeting and pH-sensing properties. It is worth mentioning that after HCy-BIZ was coordinated with boron fluoride, HCy-BIZ-BF2 exhibited an improved photostability as well as an enlarged Stokes shift, and was subsequently applied to monitor the lysosomal pH in cells stimulated with chloroquine. Further investigation of pH changes in mice illustrated that HCy-BIZ-BF2 performed well in detecting the pH in living organisms. Therefore, this concept of boron complex derived from hemicyanine is not only applicable in pH detection, but also conducive for preparing promising novel NIR bioprobes and obtaining precise measurements of physiological parameters in specific physiological processes.
Introduction
Among various biomarkers, pH is one of the vital parameters closely concerned with cellular components and pathological processes.1–4 In mammalian cells, organelles work in different pH environments ranging from 4.5 to 8.0.5,6 Lysosomes, filled with numerous hydrolytic enzymes for cellular hydrolysis,7,8 exhibit an acidic environment (pH = 4.5–5.5)9,10 and play a vital role in endocytosis, autophagy and oxidative stress.11,12 However, an abnormal pH in lysosomes would disrupt the intracellular pH homeostasis and cause many kinds of diseases, including cancers, Alzheimer's disease and cardiopulmonary problems.13–16 Therefore, it is critical to monitor pH changes in lysosomes and living systems to study cellular functions, which is beneficial to the understanding of these pathological processes.Fluorescence imaging17 based on chemical probes has been an important approach for monitoring intracellular pH in the last few decades, especially for its real-time,18–21 high spatial and temporal resolution imaging.22–28 Importantly, probes with near-infrared (NIR) absorption and emission are favourable in bioimaging, since they minimize photo damages to organisms29–32 and maximize tissue penetration to reduce the background interference in the living system.33–35 However, it is challenging to develop this kind of probe due to the widespread problems of low quantum efficiency, poor photostability as well as small Stokes shift.36,37 To develop excellent NIR probes, various fluorescence molecules such as cyanine,38 rhodamine39–41 and boron dipyrromethene42,43 have been extensively investigated. Among these probes, hemicyanine, derived from the cyanine family, is known for its desirable optical properties including high fluorescence quantum yield and good biocompatibility.44–46 Specifically, the rhodamine–hemicyanine hybrid is one of the most effective tools to design new hemicyanine probes.47,48 Based on a classical hybrid hemicyanine skeleton, numerous strategies have been developed to further improve the photostability and modulate the spectral range, like commonly-used extensions and hetero-substitutions.49 Besides, coordination modification through facile chelation between organic molecules and positive ions is a more convenient and effective method.50–56 Unfortunately, the biosensing platform composed of the rhodamine–hemicyanine hybrid derivatives and positive ions as the coordination center has not yet been established in the subcellular level, especially in the lysosome.
Herein, we designed and synthesized a novel boron complex HCy-BIZ-BF2 with NIR emission, selective pH-responsiveness and high lysosome-targeting ability to monitor pH variations in the lysosome. In particular, after HCy-BIZ was coordinated with boron fluoride, HCy-BIZ-BF2 exhibited an enlarged Stokes shift (55 nm) and a high photostability, achieving the real-time monitoring of lysosomal pH in HeLa cells stimulated with chloroquine via confocal laser scanning microscopy (CLSM). Meanwhile, pH changes in living mice were further investigated using this NIR probe with a high signal-to-noise ratio. It is expected that this strategy of combining a hemicyanine skeleton with boron fluoride could bring more opportunities to NIR fluorescent probes.
Results and discussion
Design strategies and optical properties of HCy-BIZ-BF2
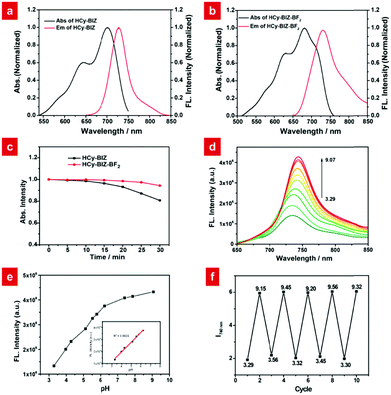
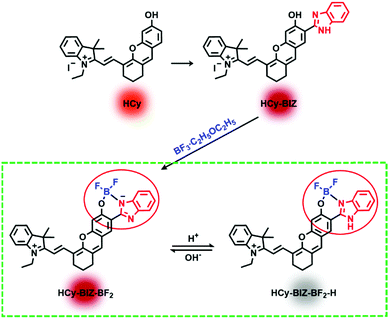
To begin with, a novel hemicyanine derivative, HCy-BIZ, was prepared by introducing the benzimidazole moiety into the classical hemicyanine skeleton. Its π-conjugate system was subsequently extended, resulting in an obvious red shift (20 nm) in the emission spectrum compared with that of its original structure.36 As shown in Fig. 1a, HCy-BIZ exhibited a NIR absorption and emission, with maximum peaks at 700 and 728 nm, respectively. However, HCy-BIZ had a small Stokes shift (28 nm), which could cause an inevitable interference from the excitation source in the fluorescence-collection process.Then, we resorted to a facile coordination approach through the chelation between HCy-BIZ and boron fluoride to form a novel boron complex (HCy-BIZ-BF2). This boron coordination led to a rigid hexatomic ring; thus, the intramolecular rotations and vibrations were restricted, contributing to higher stability. The basic synthetic routes are shown in Scheme S1 (ESI†), and the characterizations of all the compounds mentioned are also summarized in the ESI.†
Next, we evaluated the photophysical properties of HCy-BIZ-BF2. After HCy-BIZ was coordinated with BF2, HCy-BIZ-BF2 had a maximum absorption at 680 nm and a maximum fluorescence emission at 730 nm, with the Stokes shift increasing from 28 to 55 nm (Fig. 1b). Then, the photostability was investigated through UV-Vis absorption spectra. As exhibited in Fig. 1c, the absorption intensities of HCy-BIZ-BF2 changed slightly under 30 minute continuous irradiation (660 nm, 250 mW cm−2), while those of HCy-BIZ decreased obviously, demonstrating that HCy-BIZ-BF2 has a better photostability than HCy-BIZ. These results indicated that the NIR probe HCy-BIZ-BF2 exhibited outstanding photophysical properties, especially the enlarged Stokes shift and high photostability.
pH-responsive properties of HCy-BIZ-BF2
The pH-responsive properties of HCy-BIZ-BF2 were further studied in PBS with various pH values. As demonstrated in Fig. 1d and Fig. S1a (ESI†), HCy-BIZ-BF2 was pH-sensitive in both emission and absorption spectra. The emission intensity of HCy-BIZ-BF2 displayed an obvious increase in acidic (pH = 3.29 to 6.24) conditions, while it changed slightly in alkaline (pH = 7.40 to 9.07) media (Fig. 1d). In the meantime, a smaller red shift and a slight increase in absorption were observed, accompanied by the colour of the solution changing from blue (pH = 3.29) to green (pH = 9.07) (Fig. S1b, ESI†). This trend was in line with the calculated absorption spectra of HCy-BIZ-BF2 (Fig. S2b, ESI†). Besides, the good linear relationship of the fluorescence intensity versus pH values exhibited a high sensitivity of HCy-BIZ-BF2 towards pH changes, especially in the range of 3.29 to 6.24 (Fig. 1e). According to the Henderson–Hasselbalch equation (Fig. S4, ESI†), the corresponding pKa was calculated to be 5.03, illustrating that HCy-BIZ-BF2 could sense slight pH variations in the range of 4.4–6.2, which covers the lysosomal pH values in both normal and abnormal situations.According to the above-mentioned pH-responsive phenomena, the responsive mechanism of HCy-BIZ-BF2 towards H+ was investigated by the 1H NMR titration experiment, which was conducted by adding trifluoroacetic acid (TFA) dropwise into the HCy-BIZ-BF2 solution (DMSO-d6). As shown in Fig. 2a, upon the reaction of HCy-BIZ-BF2 with TFA, the proton peaks at the low field (7.2–7.5 ppm) gradually merged together, while the characteristic peak corresponding to the NH of HCy-BIZ-BF2-H appeared at d = 5.65 ppm, confirming the protonation process and the existence of a H atom. Thus, the pH-responsive mechanism is illustrated in Scheme 1. To be specific, fluctuations in the H+ concentration could influence the protonation/deprotonation processes of the imine group, resulting in the changes in fluorescence signals.
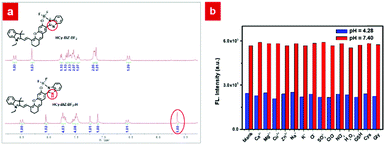 | ||
| Fig. 2 (a) 1H NMR spectra of HCy-BIZ-BF2 in DMSO-d6 without or with TFA. (b) Emission spectra of HCy-BIZ-BF2 (10 μM) with different ions, ROS and bioactive molecules. λex = 635 nm, λem = 740 nm. | ||
Subsequently, the selectivity experiments were conducted in the presence of various biological species. As depicted in Fig. 2b and Fig. S3 (ESI†), the presence of diverse ions (Ca2+, Mg2+, Cu2+, H2O2, etc.) and biologically relevant species, such as L-glutathione (GSH), glycine (Gly) and cysteine (Cys), did not cause any observable fluorescence intensity changes. Importantly, HCy-BIZ-BF2 also exhibited excellent reversibility between pH 3.5 and 9.2 (Fig. 1f), which was beneficial to the precise and reversible measurements of pH values. Generally speaking, HCy-BIZ-BF2 showed great potentiality for NIR pH detection in complicated intracellular environments, especially in acidic media.
Evaluations of HCy-BIZ-BF2 in living cells
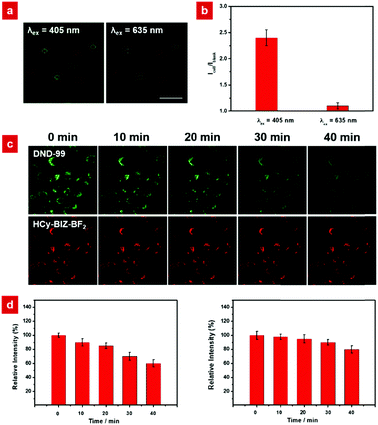
Before the in vivo and in vitro experiments, the cytotoxicity of HCy-BIZ-BF2 towards HeLa cells was evaluated using the 3-(4,5-dimethyl-2-thiazolyl)-2,5-diphenyltetrazolium bromide (MTT) assay. After 24 hour incubation, HeLa cells retained around 90% viability at various incubating concentrations of HCy-BIZ-BF2 from 0 to 50 μM, indicating that HCy-BIZ-BF2 is biocompatible in living cells (Fig. S3, ESI†). The merits of the probe's NIR emission are depicted in Fig. 3. While observing cells without any fluorescent probe, nearly no autofluorescence signals were obtained under the irradiation at 635 nm, while evident background fluorescence could be observed when excited by the 405 nm laser (Fig. 3a). These differences were further analysed by the statistical data collected from the regions of interests (ROIs) in the cell imaging results, where the mean value (Icell/Iblank) of the NIR signals upon excitation at 635 nm was only a half of that under the irradiation at 405 nm (Fig. 3b).These data showed that the NIR-emission probe HCy-BIZ-BF2 showed a superb anti-interference performance, which could effectively reduce the interferences from the background.
Photostability is another important property, especially for small-molecule fluorescence probes. To compare the photostability of HCy-BIZ-BF2 and DND-99 (an available lysosome tracker), the related experiment in HeLa cells was conducted. The cells were simultaneously excited by the continuous lasers (532 nm and 660 nm), and the fluorescence images were collected through different channels (green channel, 540–600 nm and red channel, 670–750 nm). As exhibited in Fig. 3c, the fluorescence intensity of the green channel (DND-99) was bleached quickly over time with a greater decline to around 60% of the initial intensity after 40 min. On the contrary, a small emission decrease (less than 10%, Fig. 3d) of HCy-BIZ-BF2 was observed after 40-minute irradiation, verifying good photostability in living cells. These results illustrated that HCy-BIZ-BF2 has an excellent anti-interference property and high intracellular photostability, which reveal the promising application of HCy-BIZ-BF2 in pH-related bioimaging.
Detection of lysosomal pH variations in living cells
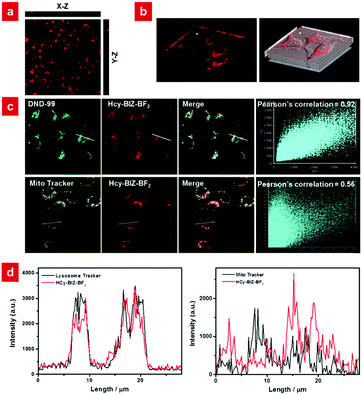
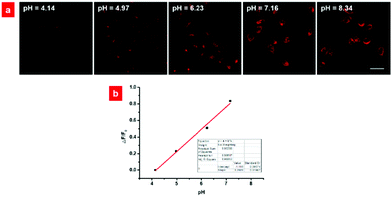
Based on the excellent NIR emission, good biocompatibility, high anti-interference property and photostability, the probe HCy-BIZ-BF2 was applied to evaluate its distribution in living cells. After the incubation of HeLa cells with HCy-BIZ-BF2 for 15 min, the cell cytoplasm exhibited an obvious NIR fluorescence (Fig. 4a). As shown in the Z-scan imaging results, HCy-BIZ-BF2 was distributed extensively from top to bottom, which can be demonstrated in detail by the enlarged images of the cells’ cross section (X–Z) and longitudinal section (Y–Z), verifying that HCy-BIZ-BF2 can quickly enter and sufficiently permeate cells. Interestingly, by performing the co-stained experiment with a commercial lysosome tracker (DND-99), it was found that HCy-BIZ-BF2 tended to accumulate in lysosomes. As depicted in Fig. 4c, the fluorescence images of HCy-BIZ-BF2 merged rather well with that of DND-99, with a high Pearson's Correlation Coefficient (0.92). In addition, the emission intensity profiles of the ROIs across the cells were selected to study the overlap images, and a relatively high overlap was found in Fig. 4d. To further demonstrate this lysosomal specificity, mitochondrion-related experiments were also conducted by the co-incubation of HeLa cells with HCy-BIZ-BF2 and Mito-Tracker Green. In contrast, the cell images of HCy-BIZ-BF2 and Mito-Tracker Green displayed a totally different distribution with a lower Pearson's Correlation coefficient (0.56), as well as the distinct emission intensity plot of the ROIs (Fig. 4d). Besides, the experimental results of HCy-BIZ-BF2 co-stained with commercial trackers of the endoplasmic reticulum and Golgi apparatus also exhibited low Pearson's correlation coefficients (Fig. S6, ESI†). Therefore, these results prove that the NIR probe HCy-BIZ-BF2 is an excellent lysosome-targeting probe with high selectivity.Subsequently, HCy-BIZ-BF2 was used to evaluate the variations of pH values in living cells. The experiment was conducted using a high K+ buffer and nigericin in bath solutions of various pH (4.14, 4.97, 6.23, 7.16, 8.34). As shown in Fig. 5a, the fluorescence intensity of HCy-BIZ-BF2 increased proportionally with the pH varying from 4.14 to 8.34. Accordingly, the intracellular pH standard curve was obtained (Fig. 5b) with the regression equation Y = 0.2685x − 1.116 (R2 = 0.98853).
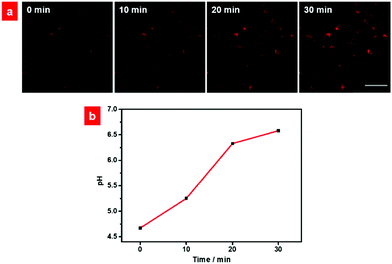
Then, HCy-BIZ-BF2 was applied to monitor the pH fluctuations in the lysosome. It is reported that the lysosome is at the terminal of the endocytosis pathway, and it has a highly acidic lumen with pH values ranging from 4.5 to 5.5.57 Its pH values, however, can grow gradually under the stimulation of chloroquine (a kind of antimalarial drug). Under the same conditions (λex = 635 nm, λem = 650–750 nm), the related fluorescence images of HeLa cells stimulated by chloroquine were captured (Fig. 6a). According to the pH standard curve, the determination of the time-dependent changes of the pH values was plotted (Fig. 6b). Specifically, the initial pH value in the lysosomes under normal incubation was calculated to be 4.67. After the cells were stimulated with chloroquine for 10 min, the pH increased to 5.25 with enhanced fluorescence intensity, and finally increased to 6.58 after 30 minute stimulation. These results demonstrated that HCy-BIZ-BF2 is an efficient NIR probe that can monitor the lysosomal pH variations in cells treated with chloroquine in real time.
Mapping of pH changes in a living mouse model
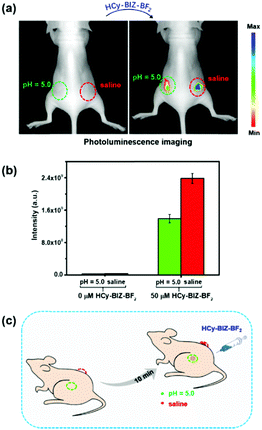
The excellent photophysical properties and the robust pH-sensitive response in cells provided the basis that HCy-BIZ-BF2 can be used for pH detection in living mice. First, saline (60 μL, pH = 6.9) and PBS (60 μL, pH = 5.0) were injected subcutaneously into two sides on the back of a nude mouse. Under the excitation at 640 nm, the NIR emission signals of HCy-BIZ-BF2 in the mouse could be monitored by the in vivo imaging system. As depicted in Fig. 7a, without HCy-BIZ-BF2, there was no observable photoluminescence in the right back (saline, pH = 6.9) and the left back (PBS, pH = 5.0) of the mouse. After the mouse was treated for 5 min, the same volume of HCy-BIZ-BF2 solution (60 μL, 50 μM) was subcutaneously injected into the two different pH areas. After 10 minute incubation, the emission intensity of the right back was much stronger than that of the left back (Fig. 7b). The statistical data further explained this trend that the fluorescence intensity of HCy-BIZ-BF2 in the saline spot was about 1.3 times that in the acidic site. According to the above-described experiments, this evident fluorescence signal enhancements could be caused by the deprotonation of HCy-BIZ-BF2 in the saline location. In short, HCy-BIZ-BF2 is characterised with superb properties as a NIR fluorescence probe for pH detection in living systems.Conclusions
In summary, we first introduced a novel strategy of a boron complex on the basis of a classical rhodamine–hemicyanine hybrid, and designed a novel pH-sensing lysosomal probe, HCy-BIZ-BF2. Meanwhile, we compared the primary properties and biological applications of HCy-BIZ-BF2 with those of the recently reported lysosomal probes in Table S1 (ESI†). It is concluded that HCy-BIZ-BF2 was characterized with NIR emission, linear pH responsiveness and lysosome targetability. Most importantly, after the chelation with boron fluoride, HCy-BIZ-BF2 possesses an enlarged Stokes shift and improved photostability, which is superior to its precursor. Subsequently, HCy-BIZ-BF2 was applied to monitor the pH in lysosomes stimulated with chloroquine, and further to successfully investigate the changes of pH in living mice with a high signal-to-noise ratio. It is accordingly believed that this concept of boron complex combined with tunable classic hemicyanine would offer more chances to construct novel NIR fluorescent probes.Experimental section
The detailed information of instruments, materials, synthesis and characterization of all compounds, cell cultivation, in vitro/in vivo imaging were provided in the ESI.†Animal models
All the nude mice were purchased from the Comparative Medicine Centre of Yangzhou University. All the animal-based experiments were performed in compliance with the criteria of the National Regulation of China for Care and Use of Laboratory Animals and approved by the Jiangsu Administration of Experimental Animals.Conflicts of interest
There are no conflicts to declare.Acknowledgements
This work was supported by the National Funds for Distinguished Young Scientists (61825503), National Natural Science Foundation of China (51473078 and 21671108), National Program for Support of Top-Notch Young Professionals, Scientific and Technological Innovation Teams of Colleges and Universities in Jiangsu Province (TJ215006), Priority Academic Program Development of Jiangsu Higher Education Institutions (YX03001), China Postdoctoral Science Foundation funded project (2016M601789), and Jiangsu Province Postdoctoral Science Foundation funded project (1701034A).Notes and references
- J. R. Casey, S. Grinstein and J. Orlowski, Nat. Rev. Mol. Cell Biol., 2010, 11, 50–61 CrossRef CAS PubMed.
- J. P. Luzio, P. R. Pryor and N. A. Bright, Nat. Rev. Mol. Cell Biol., 2007, 8, 622–632 CrossRef CAS PubMed.
- B. Tang, F. Yu, P. Li, L. Tong, X. Duan, T. Xie and X. Wang, J. Am. Chem. Soc., 2009, 131, 3016–3023 CrossRef CAS PubMed.
- S. Wu, Z. Li, J. Han and S. Han, Chem. Commun., 2011, 47, 11276–11278 RSC.
- J. Y. Han and K. Burgess, Chem. Rev., 2010, 110, 2709–2728 CrossRef CAS PubMed.
- J. T. Hou, W. X. Ren, K. Li, J. Seo, A. Sharma, X. Q. Yu and J. S. Kim, Chem. Soc. Rev., 2017, 46, 2076–2090 RSC.
- P. Saftig and J. Klumperman, Nat. Rev. Mol. Cell Biol., 2009, 10, 623–635 CrossRef CAS PubMed.
- S. J. Lee, K. S. Cho and J. Y. Koh, Glia, 2009, 57, 1351–1361 CrossRef PubMed.
- Y. Yue, F. Huo, S. Lee, C. Yin and J. Yoon, Analyst, 2016, 142, 30–41 RSC.
- S. Chen, Y. Hong, Y. Liu, J. Liu, C. W. T. Leung, M. Li, R. T. K. Kwok, E. Zhao, J. W. Y. Lam, Y. Yu and B. Z. Tang, J. Am. Chem. Soc., 2014, 136, 11196 CrossRef CAS.
- C. Watts, Biochim. Biophys. Acta, 2012, 1824, 14–21 CrossRef CAS PubMed.
- K. A. Christensen, J. T. Myers and J. A. Swanson, J. Cell Sci., 2002, 115, 599–607 CAS.
- D. Ellis and R. C. Thomas, Nature, 1976, 262, 224–225 CrossRef CAS PubMed.
- R. Zhang, S. G. Kelsen and J. C. Lamanna, J. Appl. Physiol., 1990, 68, 1101–1106 CrossRef CAS PubMed.
- H. Izumi, T. Torigoe, H. Ishiguchi, H. Uramoto, Y. Yoshida, M. Tanabe, T. Ise, T. Murakami, T. Yoshida, M. Nomoto and K. Kohno, Cancer Treat. Rev., 2003, 29, 541–549 CrossRef CAS PubMed.
- H. Zhu, J. L. Fan, Q. L. Xu, H. L. Li, J. Y. Wang, P. Gao and X. J. Peng, Chem. Commun., 2012, 48, 11766–11768 RSC.
- A. Ettinger and T. Wittmann, Methods Cell Biol., 2014, 123, 77–94 Search PubMed.
- Q. Wan, S. Chen, W. Shi, L. Li and H. Ma, Angew. Chem., Int. Ed., 2014, 53, 10916–10920 CrossRef CAS PubMed.
- K.-K. Yu, K. Li, J.-T. Hou, H.-H. Qin, Y.-M. Xie, C.-H. Qian and X.-Q. Yu, RSC Adv., 2014, 4, 33975–33980 RSC.
- K. E. Beatty, J. D. Fisk, B. P. Smart, Y. Y. Lu, J. Szychowski, M. J. Hangauer, J. M. Baskin, C. R. Bertozzi and D. A. Tirrell, ChemBioChem, 2010, 11, 2092–2095 CrossRef CAS PubMed.
- M. Grossi, M. Morgunova, S. Cheung, D. Scholz, E. Conroy, M. Terrile, A. Panarella, J. C. Simpson, W. M. Gallagher and D. F. O'Shea, Nat. Commun., 2016, 7, 10855 CrossRef CAS PubMed.
- W. Luo, H. Jiang, X. Tang and W. Liu, J. Mater. Chem. B, 2017, 5, 4768–4773 RSC.
- B. Dong, X. Song, C. Wang, X. Kong, Y. Tang and W. Lin, Anal. Chem., 2016, 88, 4085–4091 CrossRef CAS PubMed.
- J. Liu, Y. Q. Sun, Y. Huo, H. Zhang, L. Wang, P. Zhang, D. Song, Y. Shi and W. Guo, J. Am. Chem. Soc., 2014, 136, 574–577 CrossRef CAS PubMed.
- A. Becker, C. Hessenius, K. Licha, B. Ebert, U. Sukowski, W. Semmler, B. Wiedenmann and C. Grotzinger, Nat. Biotechnol., 2001, 19, 327–331 CrossRef CAS PubMed.
- K. Vellaisamy, G. Li, C. N. Ko, H. J. Zhong, S. Fatima, H. Y. Kwan, C. Y. Wong, W. J. Kwong, W. Tan, C. H. Leung and D. L. Ma, Chem. Sci., 2018, 9, 1119–1125 RSC.
- Z. Dong, Q. Han, Z. Mou, G. Li and W. Liu, J. Mater. Chem. B, 2018, 6, 1322–1327 RSC.
- S. Xia, J. Wang, J. Bi, X. Wang, M. Fang, T. Phillips, A. May, N. Conner, M. Tanasova, F. T. Luo and H. Liu, Sens. Actuators, B, 2018, 265, 699–708 CrossRef CAS PubMed.
- S. O. McDonnell and D. F. O'Shea, Org. Lett., 2006, 8, 3493–3496 CrossRef CAS PubMed.
- L. Fan, Y. J. Fu, Q. L. Liu, D. T. Lu, C. Dong and S. M. Shuang, Chem. Commun., 2012, 48, 11202–11204 RSC.
- D. Aigner, S. M. Borisov, P. Petritsch and I. Klimant, Chem. Commun., 2013, 49, 2139–2141 RSC.
- H. Lee, W. Akers, K. Bhushan, S. Bloch, G. Sudlow, R. Tang and S. Achilefu, Bioconjugate Chem., 2011, 22, 777–784 CrossRef CAS PubMed.
- J. Madsen, I. Canton, N. J. Warren, E. Themistou, A. Blanazs, B. Ustbas, X. Tian, R. Pearson, G. Battaglia, A. L. Lewis and S. P. Armes, J. Am. Chem. Soc., 2013, 135, 14863–14870 CrossRef CAS PubMed.
- P. Li, X. Duan, Z. Z. Chen, Y. Liu, T. Xie, L. B. Fang, X. R. Li, M. Yin and B. Tang, Chem. Commun., 2011, 47, 7755–7757 RSC.
- F. Yu, P. Li, P. Song, B. Wang, J. Zhao and K. Han, Chem. Commun., 2012, 48, 4980–4982 RSC.
- W. Qin, T. Rohand, M. Baruah, A. Stefan, M. V. der Auweraer, W. Dehaen and N. Boens, Chem. Phys. Lett., 2006, 420, 562–568 CrossRef CAS.
- U. Balijapalli and S. K. Iyer, Eur. J. Org. Chem., 2015, 5089–5098 CrossRef CAS.
- W. Sun, S. Guo, C. Hu, J. Fan and X. Peng, Chem. Rev., 2016, 116, 7768–7817 CrossRef CAS PubMed.
- M. Beija, C. A. Afonso and J. M. Martinho, Chem. Soc. Rev., 2009, 38, 2410–2433 RSC.
- J. Wang, S. Xia, J. Bi, Y. Zhang, M. Fang, R. L. Luck, Y. Zeng, T.-H. Chen, H.-M. Lee and H. Liu, J. Mater. Chem. B, 2019, 7, 198–209 RSC.
- G. K. Vegesna, J. Janjanam, J. Bi, F.-T. Luo, J. Zhang, C. Olds, A. Tiwari and H. Liu, J. Mater. Chem. B, 2014, 2, 4500–4508 RSC.
- S. Kolemen and E. U. Akkaya, Coord. Chem. Rev., 2018, 354, 121–134 CrossRef CAS.
- M. Zhu, P. Xing, Y. Zhou, L. Gong, J. Zhang, D. Qi, Y. Bian, H. Du and J. Jiang, J. Mater. Chem. B, 2018, 6, 4422–4426 RSC.
- L. Yuan, W. Lin, S. Zhao, W. Gao, B. Chen, L. He and S. Zhu, J. Am. Chem. Soc., 2012, 134, 13510–13523 CrossRef CAS PubMed.
- J. Zhang, C. Li, R. Zhang, F. Zhang, W. Liu, X. Liu, S. M. Lee and H. Zhang, Chem. Commun., 2016, 52, 2679–2682 RSC.
- C. Han, H. Yang, M. Chen, Q. Su, W. Feng and F. Li, ACS Appl. Mater. Interfaces, 2015, 7, 27968–27975 CrossRef CAS PubMed.
- J. Wang, S. Xia, J. Bi, M. Fang, W. Mazi, Y. Zhang, N. Conner, F. T. Luo, H. P. Lu and H. Liu, Bioconjugate Chem., 2018, 29, 1406–1418 CrossRef CAS PubMed.
- L. Yuan, W. Lin, Y. Yang and H. Chen, J. Am. Chem. Soc., 2012, 134, 1200–1211 CrossRef CAS PubMed.
- Y. Li, Y. Wang, S. Yang, Y. Zhao, L. Yuan, J. Zheng and R. Yang, Anal. Chem., 2015, 87, 2495–2503 CrossRef CAS PubMed.
- P. Tao, Y. Miao, H. Wang, B. Xu and Q. Zhao, Chem. Rec., 2018 DOI:10.1002/tcr.201800139.
- H. Mtiraoui, R. Gharbi, M. Msaddek, Y. Bretonnière, C. Andraud, P.-Y. Renard and C. Sabot, RSC Adv., 2016, 6, 86352–86360 RSC.
- W. Duan, Q. Liu, Y. Huo, J. Cui, S. Gong and Z. Liu, Org. Biomol. Chem., 2018, 16, 4977–4984 RSC.
- H. Xiao, P. Li, W. Zhang and B. Tang, Chem. Sci., 2016, 7, 1588–1593 RSC.
- D. L. Ma, C. Wu, G. Li and C. H. Leung, J. Anal. Test., 2018, 2, 77–89 CrossRef.
- D.-L. Ma, C.-M. Che and S.-C. Yan, J. Am. Chem. Soc., 2009, 131, 1835–1846 CrossRef CAS PubMed.
- H. Sun, W. Li, Z. Z. Dong, C. Hu, C. H. Leung, D. L. Ma and K. Ren, Biosens. Bioelectron., 2018, 99, 361–367 CrossRef CAS PubMed.
- C. Settembre, A. Fraldi, D. L. Medina and A. Ballabio, Nat. Rev. Mol. Cell Biol., 2013, 14, 283–296 CrossRef CAS PubMed.
Footnote |
| † Electronic supplementary information (ESI) available. See DOI: 10.1039/c8tb03353f |
| This journal is © The Royal Society of Chemistry 2019 |

