 Open Access Article
Holistic and dynamic metabolic alterations of traditional Chinese medicine syndrome in a toxic heat and blood stasis syndrome rat model†
Jing-Jing Xu ,
Feng Xu
 *,
Shu-Jie Shen,
Teng Li,
Yi-Fan Zhang,
Ming-Ying Shang,
Yao-Li Li,
Guang-Xue Liu,
Xuan Wang and
Shao-Qing Cai*
State Key Laboratory of Natural and Biomimetic Drugs, School of Pharmaceutical Sciences, Peking University, Health Science Center, No. 38 Xueyuan Road, Haidian District, Beijing 100191, China. E-mail: xufeng_pharm@163.com; sqcai@hsc.pku.edu.cn; Fax: +86-10-82802534; Fax: +86-10-82801693; Tel: +86-10-82802534 Tel: +86-10-82801693
First published on 15th December 2017
Abstract
Metabonomic analysis has been widely used in the study of traditional Chinese medicine (TCM) syndromes. In this paper, dynamic changes of the metabolic network during the evolution of a syndrome based on the toxic heat and blood stasis syndrome (THBSS) rat model have been elucidated for the first time. It was found that the metabolic trajectories could characterize three stages during THBSS evolution: the metabolic disturbance at 2–5 h, 8–12 h and 24–48 h could reflect the status of the excessive heat and little blood stasis stage, the coexistence of heat and blood stasis stage and the blood stasis stage respectively. The obtained dynamic metabolic network revealed the mechanism of THBSS progression: the inhibition of nicotinate and nicotinamide metabolism may lead to the activation of SIRT1 producing an inflammatory response, which then results in the disorder of energy metabolism and amino acid metabolism, and eventually the blood stasis appears. Nine involved metabolic pathways were found, among which the nicotinate and nicotinamide metabolism and histidine metabolism closely related to the occurrence of the inflammatory response in the early stage and blood stasis in the later stage of THBSS respectively. The former one, which is not reported in other blood stasis syndromes, might be the characteristic pathway of THBSS. This study firstly reveals the essence of THBSS progression, which is conducive to the diagnosis and pharmacotherapeutics of THBSS and related diseases, and also provides a new way to study TCM syndrome evolution.
Introduction
Traditional Chinese Medicine (TCM), which has contributed to disease management in Chinese populations and Asia for over 3000 years, is currently considered to be a complementary or alternative medical system in most Western countries.1 Different from modern medicine, TCM regards the syndrome (Zheng in Chinese) as the core concept for understanding a disease. TCM syndromes concern the origin, cause and features of a disease and the conflicts between the healthy state and pathogens, aiming to reveal the intrinsic quality of a disease completely and accurately.2 The TCM diagnosis and treatments are based on differentiation of the TCM syndrome with the data collected through any combination of four diagnostic methods (inspection, auscultation and olfaction, inquiry, and palpation).3 Therefore, a correct understanding and differentiation of TCM syndromes determines the effectiveness of TCM therapy using Chinese herbal formulae.Recently, TCM syndromes were detected and verified in some diseases under Western medicine’s demarcation, including postmenopausal osteoporosis,4 gastric mucosal dysplasia,5 coronary heart disease,6 etc. Meanwhile, TCM syndromes were applied for the classification and diagnosis of some complicated diseases, such as rheumatoid arthritis,7 diabetes,8 etc. Accordingly, elucidating the modern connotation of TCM syndromes will benefit the objectification of TCM diagnosis and treatment, and also promote the application of integrated TCM and Western medicine in the treatment of complex diseases.
Due to the holistic and dynamic characteristics, the research principle of reductionism is not suitable for exploring the scientific basis of TCM syndromes. Metabonomic analysis, a systems biology approach, adopts a ‘top-down’ strategy to reflect the function of organisms from the terminal symptoms of the metabolic network and to understand the metabolic changes of a complete system caused by interventions in the holistic context.2 This method is similar to the views of the holistic approaches, syndromes, and syndrome differentiation of TCM. Therefore, metabonomics analysis has been widely used in the study of TCM syndromes. However, the current studies, without considering both the dynamic and holistic characteristics, only obtain differential metabolites at different time points during the syndrome evolution or the metabolic network at a certain stage of TCM syndrome. The global metabolic changes associated with the development of the syndrome are not clarified. For example, Shang et al. investigated the plasma metabolic characteristics of the rat model of blood heat and hemorrhage syndrome based on the UHPLC/Q-TOF MS platform, in order to gain more understanding of the possible bleeding mechanism of blood heat and hemorrhage syndrome.9 Qiu et al. used time course plasma metabonomics analysis to investigate the material basis of the development of qi deficiency/qi deficiency and blood stasis syndromes in myocardial infarction induced heart failure rats.3 Wang et al. studied the mechanism of the hot syndrome through urine metabonomics,10 and Chen et al. investigated metabolite changes of serum samples through metabonomic approaches in a Kidney-Yang deficiency syndrome rat model.11
In this paper, the stage division and dynamic changes of the metabolic network during syndrome evolution in the toxic heat and blood stasis syndrome (THBSS) rat model have been studied for the first time. THBSS originated from Synopsis of Golden Chamber and is a common severe TCM syndrome shown in a variety of infectious diseases, acute diseases, chronic diseases and critical diseases such as acute nephritis, multiple organ failure syndrome, sepsis, pneumonia, coronary heart disease, and systemic lupus erythematosus.12 Previous studies indicate that the pathogenesis of THBSS is complex and involves multiple factors, including the release of pro-inflammatory mediators, injury of endothelial cells, hemodynamic abnormity, microcirculation disturbance and platelet dysfunction.13 Although several factors have been proposed to be involved in the progression of THBSS, the systemic and characteristic metabolic alterations involved in the development of THBSS remain unclear. Meanwhile, there are no standard diagnostic criteria consistent with modern medicine for THBSS, which further limits the application of TCM in the treatment of THBSS-related diseases. So the elucidation of its holistic and dynamic metabolic alterations is critical to understand its pathogenesis and identify potential biomarkers and drug targets.
The TCM syndrome model is the basic tool to study the dynamic development and reveal the essence of TCM syndromes. Based on TCM theory, the pathogenesis of THBSS is that heat-toxins invade the body and burn blood vessels causing the insufficiency of liquid and blood, and then blood stasis occurs. Thus, heat-toxins are the key pathogenic factor. Recently, bacteria (such as Pseudomonas aeruginosa), viruses (such as influenza virus) and endotoxins (such as lipopolysaccharide) have been used as pathogenic heat-toxins. However, bacteria and viruses easily lead to animal death, causing the failure of modeling.14 Xu et al. reported that plasma endotoxin does have an inner link with THBSS.15 So lipopolysaccharides (LPSs) are commonly used as heat-toxin materials to establish the THBSS model. Among different kinds of LPS-based modeling methods, Liang et al. use LPSs in combination with carrageenan (CAR) to develop a TCM syndrome of THBSS in rats. This model integrated syndrome (THBSS) and disease (thrombosis) has several advantages: (1) it can reflect the THBSS manifestation accurately; (2) based on the tail thrombosis, it is convenient to estimate whether the model is successful or not; (3) it is also easily practicable, repeatable and highly consistent so it is suitable for metabonomics research.16
To comprehensively profile the changes in metabolite levels associated with the progression of THBSS, we used the THBSS rat model, a well-established animal model by Liang,16 and investigated whether the rat model showed progression of THBSS based on biochemical parameters and TCM syndrome diagnostic criteria. With the goals of discovering specific biomarkers of syndrome progression, identifying perturbed metabolic pathways associated with the pathogenesis of the syndrome, and discovering potential drug targets, time course urine metabonomics analysis based on UPLC/Q-TOF MS with pattern recognition technology and principal component analysis was performed to study the metabolic alterations in the urine obtained from the THBSS model rats.
Material and methods
Materials
Lipopolysaccharide (lot no. 095M4164V) and carrageenan (lot no. SLBK3896V) were obtained from Sigma-Aldrich (St. Louis, MO, USA). Leucine-enkephalin (lot no. MB11442) was obtained from BSCX Technology Co., Ltd (Beijing, China). Methanol and acetonitrile were of HPLC grade and purchased from Merck Group (Darmstadt, Germany); HPLC grade formic acid was purchased from Fisher Scientific Corporation (Loughborough, UK). Ultra-high purity water (18.2 MΩ, TOC < 5 ppb) was prepared by a Millipore Milli-Q Integral 3 Ultrapure Water System (Billerica, MA, USA). The blood coagulation function assay kits were purchased from Sysmex Corporation (Kobe, Japan). TNF-α (lot no. E-EL-R0019c), IL-6 (lot no. E-EL-R0015c) and IL-1β (lot no. E-EL-R0012c) assay kits were purchased from Elabscience Biotechnology Co., Ltd (Wuhan, China).Animals and treatments
Sixty-eight male Sprague-Dawley rats (180–200 g) were purchased from the Experimental Animal Center of Peking University Health Science Center (Beijing, China) on October 25, 2015 and kept at a standard temperature (23 ± 2 °C) and humidity (60 ± 5%) in a controlled room with a light/dark cycle of 12 h for a week. During this period animals were allowed free access to food and water. Prior to each experiment, the rats were fasted for 12 h with free drinking.Among them, 48 rats were used for evaluation of the THBSS stage and randomly divided into 6 groups named the 2 h control group (2 h CG), 2 h THBSS group (2 h TG), 8 h control group (8 h CG), 8 h THBSS group (8 h TG), 24 h control group (24 h CG), and 24 h THBSS group (24 h TG). The other 20 rats applied for metabonomics analysis were divided into two groups randomly: the control group (CG) and THBSS group. The rats in the THBSS model groups were firstly treated with 25 mg kg−1 CAR i.p., and followed by 50 μg kg−1 LPS i.v. 16 hours later. The rats in the control groups were given normal saline. The moment of LPS i.v. served as 0 h for the observation.
All procedures and care of the rats were in accordance with the Guide for the Care and Use of Laboratory Animals of the US National Institutes of Health. The experiments were approved by the Biomedical Ethical Committee of Peking University (approval no. LA2015-007).
Sample collection and preparation
Rats in the control and THBSS groups of 2 h, 8 h, 24 h were anesthetized with 10% chloral hydrate at 2 h, 8 h and 24 h after modeling respectively. Then 6 mL blood obtained with the heart puncture technique was collected into one 2 mL sodium citrate vacuum blood collection tube (SCVBCT) and two 2 mL EDTA vacuum blood collection tubes (EVBCTs). The blood sample in one of the EVBCTs stood at room temperature (22–25 °C) for 30 min. The blood samples in the SCVBCT and the other EVBCT were centrifuged at 3000 rpm for 10 min to get the plasma and stored at −80 °C until the biochemical analysis. In addition, the liver and lung tissues were dissected for histological examination.The urine samples of rats used for the metabonomics analysis were collected before administration (denoted as urine samples of 0 h) and at the time-points of 2, 5, 8, 12, 24, 36 and 48 h after administration. Each urine sample was first centrifuged at 14![[thin space (1/6-em)]](https://www.rsc.org/images/entities/char_2009.gif) 000 rpm for 10 min at 4 °C, and the supernatant was filtered through a 0.22 μm filter membrane and stored at −80 °C until the LC-MS experiments.
000 rpm for 10 min at 4 °C, and the supernatant was filtered through a 0.22 μm filter membrane and stored at −80 °C until the LC-MS experiments.
Evaluation of the THBSS stage
The physical signs (mental status, paw color, tail and ear features, and forehead temperature), cytokines (TNF-α, IL-6, and IL-1β), whole blood viscosity, coagulation index [PT (prothrombin time), TT (thrombin time), and APTT (activated partial thromboplastin time)], and histopathological features of lung and liver tissues were selected as the indicators used to evaluate the THBSS stage based on “Diagnostic Criterion of Blood Stasis Syndrome (China Society of Integrated Traditional Chinese and Western Medicine, 2010)” and “Clinical Terminology of Traditional Chinese Medicine (State Administration of Traditional Chinese Medicine of the People’s Republic of China, 1997)”.Before modeling, the rats’ forehead temperatures were measured three times a day by a digital thermometer (OMRON Co. Ltd., MC-347) for monitoring the regular rhythm of the forehead temperatures. The rats with temperature variances that were greater than 0.5 °C were excluded. The temperature variance of all the rats in our experiment met the requirement. Moreover, the forehead temperatures of the rats in the 24 h CG and 24 h TG were determined at 2 h, 4 h, 5.5 h, 7 h, 8 h, 9.5 h, 12 h, 16 h and 24 h after modeling.
Metabonomics analysis
![[thin space (1/6-em)]](https://www.rsc.org/images/entities/char_2009.gif) :
:![[thin space (1/6-em)]](https://www.rsc.org/images/entities/char_2009.gif) 1 (v/v) using ultra high purity water, vortex mixed and centrifuged at 14
1 (v/v) using ultra high purity water, vortex mixed and centrifuged at 14![[thin space (1/6-em)]](https://www.rsc.org/images/entities/char_2009.gif) 000 rpm for 10 min at 4 °C. The supernatants were subjected to the UPLC Q-TOF/MS system for analysis. A pooled “quality control” (QC) sample was prepared by mixing equal aliquots (10 μL) from all urine samples for the optimization of the chromatographic and TOF/MS conditions, and method validation.
000 rpm for 10 min at 4 °C. The supernatants were subjected to the UPLC Q-TOF/MS system for analysis. A pooled “quality control” (QC) sample was prepared by mixing equal aliquots (10 μL) from all urine samples for the optimization of the chromatographic and TOF/MS conditions, and method validation.The following databases were used to identify the potential biomarkers: HMDB (http://www.hmdb.ca/), KEGG (http://www.genome.jp/kegg/), Mass-bank (http://www.massbank.jp) and METLIN (http://metlin.scripps.edu/). The pathway analysis was performed with metabolomics pathway analysis (MetPA) (http://www.metaboanalyst.ca).
Results
Syndrome diagnosis and model confirmation
Based on the “Diagnostic Criterion of Blood Stasis Syndrome (China Society of Integrated Traditional Chinese and Western Medicine, 2010)” and “Clinical Terminology of Traditional Chinese Medicine (State Administration of Traditional Chinese Medicine, 1997)”, these results indicated that physical signs of excessive heat syndrome were becoming less significant, but physical signs of blood stasis syndrome became more and more obvious over time.
![[x with combining macron]](https://www.rsc.org/images/entities/char_0078_0304.gif) ± s, n = 8)a
± s, n = 8)a
| Group | TNF-α (pg L−1) | IL-6 (pg L−1) | IL-1β (pg L−1) |
|---|---|---|---|
| a Significant differences were based on the two-tailed t-test. Compared with the 0 h CG, * represents the significant differences (P < 0.05). | |||
| 0 h CG | 80.04 ± 1.63 | 14.01 ± 0.38 | 35.74 ± 3.15 |
| 2 h TG | 246.25 ± 4.59* | 1032.43 ± 353.38* | 44.46 ± 0.85* |
| 8 h TG | 112.87 ± 3.28* | 16.59 ± 0.63* | 23.48 ± 1.71* |
| 24 h TG | 118.18 ± 3.18* | 15.52 ± 0.79 | 29.39 ± 4.07 |
Compared to the CG, the whole blood viscosity significantly (P < 0.05) increased in the TGs at different time points. Meanwhile, the whole blood viscosity variation trend of rats in the TGs was: 24 h TG > 8 h TG > 2 h TG (Table 2).
![[x with combining macron]](https://www.rsc.org/images/entities/char_0078_0304.gif) ± s, n = 8)a
± s, n = 8)a
| Group | 1 s−1 (mPa’s) | 10 s−1 (mPa’s) | 50 s−1 (mPa’s) | 200 s−1 (mPa’s) |
|---|---|---|---|---|
| a Significant differences were based on the two-tailed t-test. Compared with the corresponding CG, * represents the significant differences (P < 0.05); ** represents the significant differences (P < 0.01). | ||||
| 2 h CG | 21.22 ± 0.93 | 6.51 ± 0.19 | 4.16 ± 0.13 | 3.35 ± 0.13 |
| 2 h TG | 22.79 ± 0.82** | 7.21 ± 0.16* | 4.52 ± 0.25* | 3.71 ± 0.30* |
| 8 h CG | 21.14 ± 1.22 | 6.54 ± 0.28 | 4.24 ± 0.22 | 3.38 ± 0.17 |
| 8 h TG | 24.38 ± 1.39** | 7.59 ± 0.56** | 4.86 ± 0.51** | 3.82 ± 0.11** |
| 24 h CG | 21.41 ± 1.10 | 6.93 ± 0.25 | 4.42 ± 0.21 | 3.56 ± 0.20 |
| 24 h TG | 26.78 ± 0.90** | 8.30 ± 0.83* | 5.40 ± 0.39** | 4.23 ± 0.45** |
Compared to the corresponding CGs, APTT significantly (P < 0.05) prolonged in the 2 h TG; PT, TT and APTT all significantly (P < 0.05) prolonged in the 8 h TG; PT highly significantly decreased (P < 0.01), and APTT and TT still significantly (P < 0.05) prolonged in the 24 h TG (the difference with CG was reduced) (Table 3).
![[x with combining macron]](https://www.rsc.org/images/entities/char_0078_0304.gif) ± s, n = 8)a
± s, n = 8)a
| Group | PT/s | APTT/s | TT/s |
|---|---|---|---|
| a Significant differences were based on the two-tailed t-test. Compared with the corresponding CG, * represents the significant differences (P < 0.05); ** represents the significant differences (P < 0.01). | |||
| 2 h CG | 12.51 ± 0.53 | 17.56 ± 6.02 | 39.76 ± 3.96 |
| 2 h TG | 12.76 ± 0.51 | 30.10 ± 7.90* | 42.98 ± 8.18 |
| 8 h CG | 12.41 ± 0.24 | 17.51 ± 2.70 | 38.81 ± 5.88 |
| 8 h TG | 13.81 ± 1.68* | 39.35 ± 9.74** | 51.10 ± 7.43** |
| 24 h CG | 12.49 ± 0.69 | 19.20 ± 5.86 | 39.80 ± 7.47 |
| 24 h TG | 11.11 ± 0.51** | 31.06 ± 6.69** | 49.21 ± 7.79* |
It has been reported that the elevation of TNF-α and IL-6 are biochemical indexes of excessive heat syndrome.17 The elevation of whole blood viscosity and abnormal coagulation indices are biochemical indexes of blood stasis syndrome. These results indicated that excessive heat syndrome was becoming less significant, but blood stasis syndrome became more and more obvious over time.
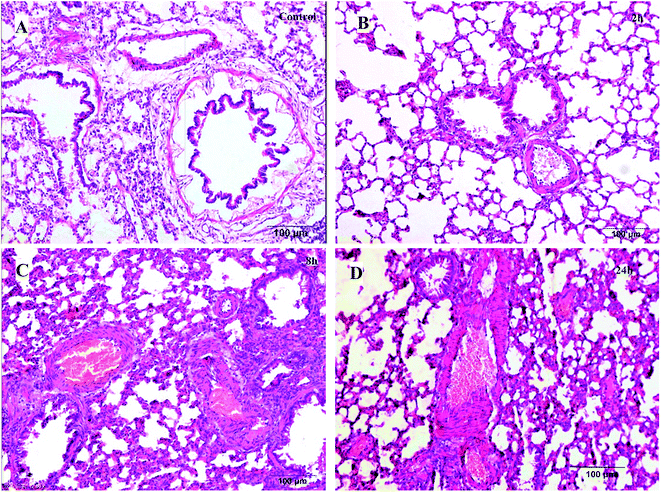 | ||
| Fig. 1 Histological examination of lung tissues (H–E, 100 μm). (A) Control group; (B) 2 h model group; (C) 8 h model group; (D) 24 h model group. | ||
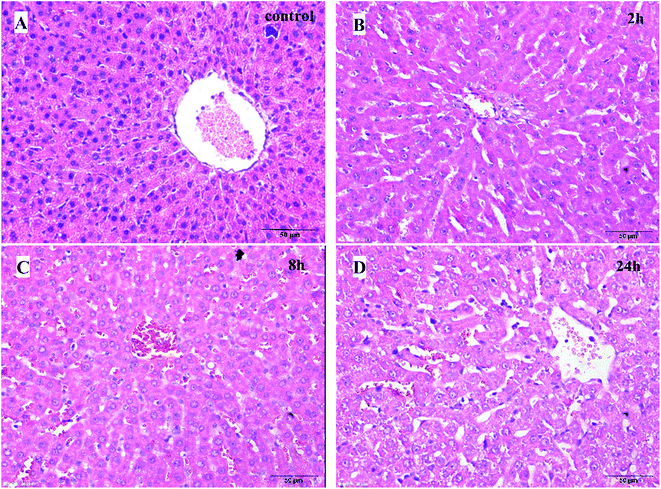 | ||
| Fig. 2 Histological examination of liver tissues (H–E, 50 μm). (A) Control group; (B) 2 h model group; (C) 8 h model group; (D) 24 h model group. | ||
The pathological results of the liver tissues showed that the normal structure of hepatic lobules and liver cells with light edema were observed in the rats of the 2 h TG; liver cells with moderate edema and few red cells spreading in the liver sinus were observed in the rats of the 8 h TG; in the 24 h TG, structural disorder of hepatic lobules, liver cells with severe edema and red cells clustered in the hepatic sinus and central vein of hepatic lobules were observed.
Based on these results, it could be concluded that the lung and liver tissue damage and congestion were aggravated with time.
A combination of syndrome classification and biochemical indexes becomes a common model in TCM diagnostics in both clinical and nonclinical practice. Consequently, based on the three aspects above, the syndrome progression of the rat model was diagnosed. 2 h after modeling, the rats were in the stage of excessive heat and little blood stasis (EHLBS); 8 h after modeling, the rats were in the stage of the coexistence of heat and blood stasis (CHBS); 24 h after modeling, the rats were in the stage of blood stasis (BS).
Metabonomics analysis
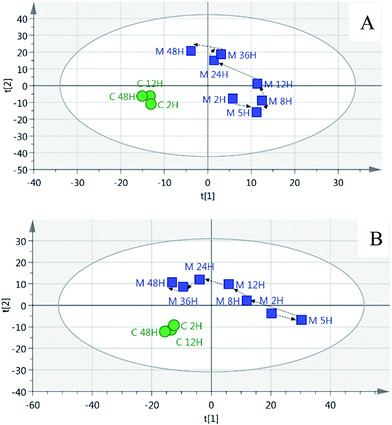
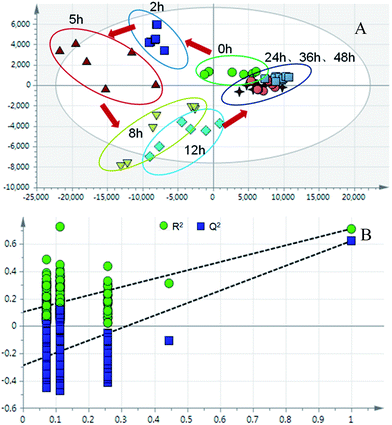
The partial least squares discriminant analysis (PLS-DA) mean trajectory showed a characteristically different distribution in metabolic patterns between the control group and model group (the samples of the model group were distributed in the first, second and fourth quadrant, whereas the samples of the control group were located only in the third quadrant) (Fig. 3). Furthermore, results from the model groups revealed an obvious trajectory space from 2 h to 48 h, whereas the control groups occupied a narrow space in the plot, suggesting that the observed changes in the metabolic profiles were mostly related to the progression of the syndrome.
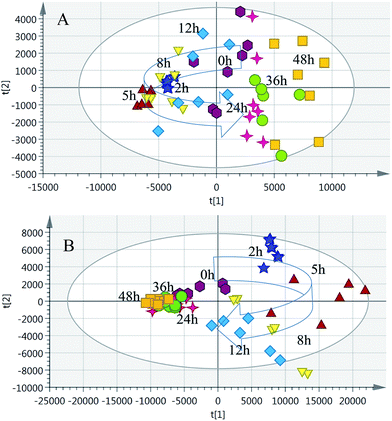 | ||
| Fig. 4 PCA trajectory based on the MS spectra of urine samples collected from model rats. (A) Positive mode; (B) negative mode. | ||
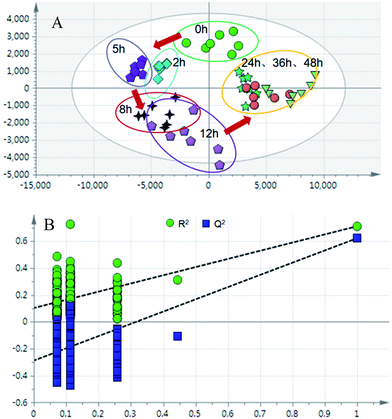 | ||
| Fig. 5 (A) PLS-DA trajectory based on the MS spectra in the positive mode of urine samples collected from model rats; (B) validation plot of 200 permutation tests. | ||
![[triple bond, length as m-dash]](https://www.rsc.org/images/entities/char_e002.gif) N from [M + H]+. The ion at m/z 80.0500 (elemental composition: C5H6N) was obtained by the loss of OC
N from [M + H]+. The ion at m/z 80.0500 (elemental composition: C5H6N) was obtained by the loss of OC![[double bond, length as m-dash]](https://www.rsc.org/images/entities/char_e001.gif) NH from [M + H]+. According to the degree of unsaturation and fragmentation information, this metabolite may contain a pyridine ring and an amide group. To further elucidate the structure of M1, the database HMDB (http://www.hmdb.ca/) was searched by the molecular weight and the MSE spectrum. The above data matched those of niacinamide. Therefore, M1 was tentatively identified as niacinamide (Fig. S7†). For another example, the ion at m/z 191.0193 (elemental composition: C6H7O7) was the [M − H]− of metabolite M2. Its MS2 spectrum showed fragment ions at m/z 173.0084, m/z 129.0181 and m/z 85.0280, which were produced by the sequential losses of H2O, CO2, and CO2 from [M − H]−. This suggests that there are at least two carboxyl groups in the structure of M2. These data were consistent with those of isocitric acid, which was also supported by the HMDB database (Fig. S8†). Other metabolites were determined using the same method described above.
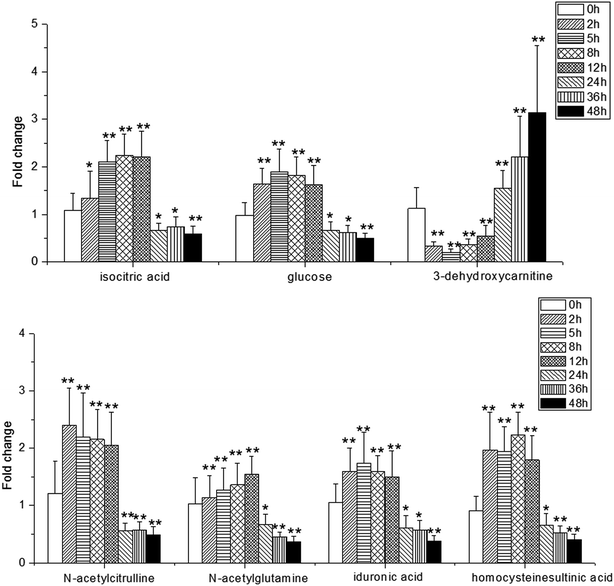
NH from [M + H]+. According to the degree of unsaturation and fragmentation information, this metabolite may contain a pyridine ring and an amide group. To further elucidate the structure of M1, the database HMDB (http://www.hmdb.ca/) was searched by the molecular weight and the MSE spectrum. The above data matched those of niacinamide. Therefore, M1 was tentatively identified as niacinamide (Fig. S7†). For another example, the ion at m/z 191.0193 (elemental composition: C6H7O7) was the [M − H]− of metabolite M2. Its MS2 spectrum showed fragment ions at m/z 173.0084, m/z 129.0181 and m/z 85.0280, which were produced by the sequential losses of H2O, CO2, and CO2 from [M − H]−. This suggests that there are at least two carboxyl groups in the structure of M2. These data were consistent with those of isocitric acid, which was also supported by the HMDB database (Fig. S8†). Other metabolites were determined using the same method described above.To further reveal potential biomarkers related to the syndrome progression, common features among the differential metabolites at different time points were selected using a Venn diagram (Fig. 7). The trends in the change of the common metabolites of 8 h and 24 h, and 2 h and 24 h were different, but the trend in the change of the common metabolites of 2 h and 8 h was the same. Combined with the opposite distribution of 2 h and 24 h in the PCA plot (Fig. 4), these results indicated that the metabolic disturbance of the excessive heat and little blood stasis stage (2 h) and blood stasis stage (24 h) are of opposing directionality. The Venn diagram showed 21 common metabolites at the three time points (Table S7†). Additionally, analysis of the temporal changes of these metabolites revealed that 7 metabolites, i.e., isocitric acid, glucose, 3-dehydroxycarnitine, N-α-acetylcitrulline, N-acetylglumine, iduronic acid and homocystein sulfinic acid were in a consensus change trend with the syndrome progression. These characteristic changes could serve as potential biomarkers of THBSS. Except glucose, the other 6 metabolites were firstly reported as the potential biomarkers of blood stasis syndrome, among which homocystein sulfinic acid was firstly regarded as a potential biomarker. The changes in potential biomarkers from the onset to the progression of THBSS are shown in Fig. 8. Compared with the normal rats, the levels of several glucose metabolism intermediates (such as isocitric acid and glucose) were elevated in the samples collected from THBSS rats at 2 h, 5 h, 8 h and 12 h and reduced at 24 h, 36 h and 48 h. The levels of 3-dehydroxycarnitine related to β-oxidation of long-chain fatty acids down-regulated in the samples collected at 2 h, 5 h, 8 h and 12 h and up-regulated at 24 h, 36 h and 48 h. These changes indicate excessive energy consumption in the excessive heat and little blood stasis stage and the blockade of the energy metabolism.19 The levels of N-acetylglutamine and N-α-acetylcitrulline, which are associated with nervous system functions, were elevated in the samples collected at 2 h, 5 h, 8 h and 12 h and reduced at 24 h, 36 h and 48 h, suggesting that the nervous system is disturbed in THBSS.20,21 The levels of iduronic acid and homocysteine sulfinic acid, which can affect coagulation function, were altered, demonstrating the dysfunction of coagulation during THBSS progression.22,23
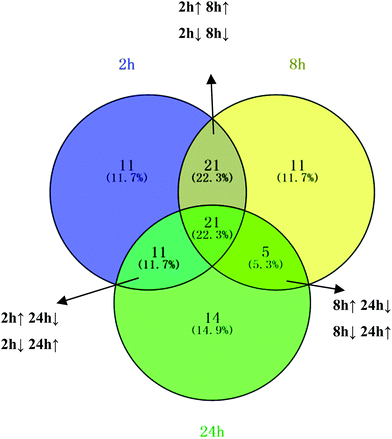 | ||
| Fig. 7 The conclusion of urine metabolite changes at three time points after modeling. The Venn diagram shows the distribution of metabolites altered at different time points. | ||
| Pathway | Impact | ||
|---|---|---|---|
| 2 h | 8 h | 24 h | |
| a ↓ represents down regulation; ↑ represents up regulation; the impact is the pathway impact value calculated from the pathway topology analysis; “—” represents no metabolites related with the pathway obtained at this time-point. | |||
| Histidine metabolism | 0.3871↓ | 0.3871↓ | 0.3871↓ |
| Arginine and proline metabolism | 0.1214↓ | 0.1509↓ | 0.09374↓ |
| Nicotinate and nicotinamide metabolism | 0.3631↓ | 0.3631↓ | 0.2381↓ |
| Citrate cycle (TCA cycle) | 0.1132↑ | 0.09488↑ | 0.1400↓ |
| Taurine and hypotaurine metabolism | 0.4286↑ | 0.4286↑ | — |
| Pyruvate metabolism | 0.1875↑ | — | 0.1875↓ |
| Valine, leucine and isoleucine biosynthesis | 0.3333↓ | — | 0.3333↑ |
| Alanine, aspartate and glutamate metabolism | 0 | 0.2595↓ | 0.2627↓ |
| Glyoxylate and dicarboxylate metabolism | 0 | 0.2963↑ | 0 |
Discussion
Nicotinate and nicotinamide metabolism
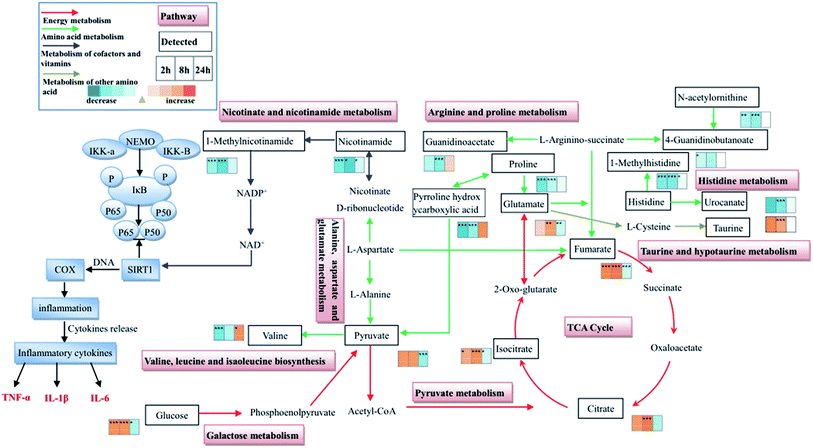
In the present study, the significantly decreased levels of nicotinamide (at 2 h, 8 h and 24 h) and 1-methylnicotinamide (at 2 h and 8 h) of the model group showed a hampered nicotinate and nicotinamide metabolism during the THSBB progression. Moreover, at 24 h only nicotinamide decreased, thus nicotinate and nicotinamide metabolism had a weak inhibition at this time point (Fig. 9, Tables S3–S5†).It has been reported that nicotinamide is the main precursor of nicotinamide adenine dinucleotide (NAD+) formed by transamination in vivo. NAD+ as a sirtuin 1 (SIRT1) agonist may activate SIRT1 by regulating the ratio of NAD+/NADH. SIRT1 is a positive regulator of NF-κB which is considered to be an important transcriptional factor involved in the production of pro-inflammatory cytokines.25 In this study, the inhibition of nicotinate and nicotinamide metabolism in model rats at 2 h, 8 h and 24 h may lead to the inhibition of SIRT1, resulting in the activation of NF-κB and the elevation of inflammatory cytokines as an inflammatory response. Besides, the extent of inhibition of nicotinate and nicotinamide metabolism was reduced at 24 h, suggesting that the inflammatory response decreased, which was consistent with the decreasing levels of IL-6, TNF-α and IL-1β over time. Thus the inhibition of nicotinate and nicotinamide metabolism may be the key reason for inflammation in THBSS. In addition, an inflammatory response is firstly observed in THBSS and it may be the induction factor of abnormal hemorheology and coagulation, indicating that nicotinate and nicotinamide metabolism is the key pathway in the initiation of THBSS. The disorder of nicotinate and nicotinamide metabolism has not been reported in other blood stasis syndromes (including blood deficiency and blood stasis, cold coagulation and blood stasis, etc.), so it may be the characteristic metabolic pathway of THBSS.
Energy metabolism
In this study, the levels of several glycolysis intermediates (glucose and pyruvate) and citrate cycle intermediates (isocitrate, citrate and fumarate) altered in the progression of THBSS. Compared with the normal rats, the levels of pyruvate, isocitrate and glucose increased at 2 h; citrate, isocitrate and glucose increased at 8 h; fumarate, pyruvate, isocitrate and glucose decreased at 24 h in the THBSS rats. Moreover, the content of creatinine and pyroglutamic acid reduced at 2 h and 8 h (Fig. 9, Tables S3–S5†).Glycolysis is the metabolic pathway that converts glucose into pyruvate. The free energy released in this process is used to form the high-energy molecules ATP and NADH. Pyruvate could be converted into acetyl CoA, entering the citrate cycle under aerobic conditions. The citrate cycle is the main approach for energy supply, which unifies carbohydrate, fat and protein metabolism.26 The creatine/creatine phosphate shuttle system plays an essential role in energy homeostasis.27 Creatine kinase catalyzes the reaction of ADP with phosphocreatine to generate ATP, serving as fuel in the case of energy deficiency.28 The increase of citrate cycle intermediates (isocitrate, citrate and pyruvate) and glycolysis intermediates (pyruvate and glucose) in urine samples collected at 2 h and 8 h of THBSS rats as compared with normal rats demonstrates an activated energy metabolism. The decrease of citrate cycle intermediates (fumarate, pyruvate and isocitrate) and glycolysis intermediates (pyruvate and glucose) suggests that the energy metabolism is suppressed.
The inhibition of nicotinate and nicotinamide metabolism leads to the inflammation at 2 h (the excessive heat and little blood stasis stage) and 8 h (the coexistence of heat and blood stasis stage) after modeling, resulting in the increase of energy demand. Therefore, compared with the control group, the energy metabolism of model rats is enhanced. Moreover, it has been reported that citrate cycle intermediates are inflammatory signals,26 so the citrate cycle is regarded as the metabolic pathway related to inflammation. The suppression of energy metabolism induces an insufficient supply for the heart, causing the disturbance of normal blood flow. What is worse, oxygen transport may be restrained in such a state, leading to the disturbance of energy metabolism. Eventually, the blood stasis status of model rats will not be recovered over time.
Amino acid metabolism
In this study, 23 differential amino acids involved in histidine metabolism, arginine and proline metabolism, valine, leucine and isoleucine biosynthesis, and alanine, aspartate and glutamate metabolism were found (Table S7†). Among them, the levels of 11 amino acids (L-lysine, proline, N-acetylornithine) decreased at 2 h and 8 h in the model group. The content of valine (branched chain amino acid) and 5-L-glutamylglycine (dipeptide) increased at 24 h in the model group. Their alterations indicate that, due to the inflammation, amino acids are used for acute-phase protein synthesis, inducing the decrease of amino acids in the model group at 2 h and 8 h.29 Besides, the elevated amino acids at 24 h suggest that protein degradation is enhanced to compensate for the clearance of amino acids.30,31This study also found that the content of histidine reduced at 2 h, 8 h and 24 h in the model group. Histamine converted from histidine by histidine decarboxylase can induce the expression of tissue factor. The tissue factor as the initiation factor of the extrinsic coagulation pathway has a strong procoagulant activity.32 The change of histidine in model rats indicates that the extrinsic coagulation pathway is affected. It is consistent with the inference obtained from the blood biochemical analysis, showing that the decrease of PT resulted in the emergence of blood stasis in the later stage of THBSS. Therefore, the disorder of histidine metabolism was closely related to the aggravation of the blood stasis syndrome.
Moreover, the content of isovalerylglycine, 2-methylbutyrylglycine, and isobutyrylglycine increased at 2 h and 8 h and decreased at 24 h in the model group. It has been reported that the deficiency of isovaleryl-CoA dehydrogenase, 2-methylbutyryl-CoA dehydrogenase and isobutyryl-CoA dehydrogenase involved in the valine, leucine, and isoleucine degradation leads to the increase of the excretion of isovalerylglycine, 2-methylbutyrylglycine, and isobutyrylglycine, and those enzymes can catalyze the degradation of valine, leucine and isoleucine into succinyl coenzyme A and acetyl coenzyme A to participate in the citrate cycle.33 Therefore, the experimental results demonstrate that the activities of isovaleryl-CoA dehydrogenase, 2-methylbutyryl-CoA dehydrogenase and isobutyryl-CoA dehydrogenase are inhibited, inducing the elevation of branched chain amino acids for the synthesis of acute-phase protein. Nevertheless, at 24 h the activities of those enzymes were promoted to enhance the degradation of the branched chain amino acid into succinyl coenzyme A and acetyl coenzyme A, resulting in the enhancement of energy metabolism.
Other metabolic pathways
Taurine with favorable antioxidant activity can decrease myocardial cellular membrane damage. In addition, it can also inhibit platelet adhesion and aggregation.34 The level of taurine in the model group at 2 h and 8 h was elevated, suggesting that the oxidative injury is serious at this time resulting in the increase of defense function. Pyruvate, as the final product of glycolysis, is an important source of mitochondrial ATP, and is closely related to the relevant biosynthesis pathway of the citrate cycle. The disturbance of pyruvate metabolism can affect tissues with high energy demands such as myocardial tissue.35 The content of pyruvate in the urine samples of the model rats was increased at 2 h and decreased at 24 h, demonstrating the enhancement of energy metabolism at 2 h (the excessive heat and little blood stasis stage) and the blockage of energy metabolism at 24 h (the blood stasis stage).The nature of THSSB based on the metabonomics
Combining the metabonomic analysis and biochemistry parameters, the nature of THBSS progression was tentatively elucidated. The inhibition of nicotinate and nicotinamide metabolism leads to the inhibition of SIRT1, resulting in the inflammatory response. The inflammation increases the energy demand and synthesis of acute-phase proteins so that energy metabolism and amino acid metabolism are disturbed. Therefore, in the excessive heat and little blood stasis stage, the inflammation cytokines (IL-6 and TNF-α) and forehead temperature are elevated significantly; but the blood biochemical parameters (including whole blood viscosity, PT, etc.) vary slightly. As the energy is consumed, insufficient energy supply for the heart causes the disturbance of blood circulation. The alteration of several important amino acids (including histidine, homocysteine sulfinic acid, etc.) also influences the coagulation and hemorheology. Meanwhile, the inflammatory response is relieved. So the coexistence of heat and blood stasis stage is manifested as the level of inflammation cytokines (IL-6, IL-1β and TNF-α) and forehead temperature decreased, but the blood biochemical parameters (whole blood viscosity and APTT) increased. Furthermore, the inhibition of the nicotinate and nicotinamide metabolism alleviates. However, the abnormal blood circulation restrains the oxygen transport, leading to the inhibition of energy metabolism; the insufficient energy aggravates the disturbance of blood circulation. Therefore, the blood stasis stage shows normal levels of IL-6 and TNF-α, significant change of blood biochemical parameters (whole blood viscosity and PT) and the most serious damage of the liver and lung (red cells clustered in the hepatic sinus and central vein of hepatic lobules, large numbers of red cells emerged in small pulmonary veins and alveolar wall capillaries, etc.) in the model group.Conclusion
In summary, studying the metabolic network changes during syndrome progression can elucidate the scientific basis of TCM syndrome systemically and dynamically and benefit the discovery of biomarkers and drug targets. Through this study, the constructed metabolic trajectories were consistent with the results of the syndrome progression diagnosed based on the TCM criterion, which showed three stages: excessive heat and little blood stasis (2–5 h), coexistence of heat and blood stasis (8–12 h), and blood stasis (24–48 h). The mechanism of THBSS progression was that the inhibition of nicotinate and nicotinamide metabolism may lead to the activation of SIRT1 producing an inflammatory response, which then resulted in the disorder of energy metabolism and amino acid metabolism, and eventually the blood stasis appeared. Among them, nicotinate and nicotinamide metabolism and histidine metabolism could be the target pathways for intervention. Nicotinate and nicotinamide metabolism might be the characteristic metabolic pathway of THBSS, which can distinguish it from other types of blood stasis syndrome. The alterations of isocitric acid, glucose, 3-dehydroxycarnitine, N-acetylglutamine, N-α-acetylcitrulline, iduronic acid and homocysteine sulfinic acid associated with the progression of THBSS were identified as potential biomarkers. Besides, the metabolic disturbance of the excessive heat and little blood stasis stage (2 h) and blood stasis stage (24 h) were of opposing directionality, indicating that the therapeutic Chinese medicine of THBSS probably has a bi-directional regulation mechanism, which enriches the modern connotation of the TCM theory system. The discovery of the holistic and dynamic metabolic alterations of THBSS provides a reference for clinical diagnosis and rational drug treatment of the critical diseases associated with THBSS, and it also paves a new way to elucidate the scientific basis of TCM syndrome evolution. According to the clues obtained in this study, we will further qualitatively and quantitatively determine the important metabolites and potential biomarkers. Simultaneously, we will collect clinical samples and data to verify the process and essence of THBSS.Conflict of interest
The authors declare no competing financial interests.Acknowledgements
This study was financially supported by the National Natural Science Foundation of China (No. 81573593). We are grateful to Dr Fei Shang for his routine management and careful maintenance of the UPLC/Q-TOF MS instrument.References
- M. Jiang, J. Yang, C. Zhang, B. Liu, K. Chan, H. Cao and A. Lu, Clinical studies with traditional Chinese medicine in the past decade and future research and development, Planta Med., 2010, 76(17), 2048–2064 CrossRef CAS PubMed.
- P. Wang and Z. Chen, Traditional Chinese medicine ZHENG and OMICS convergence: A systems approach to post-genomics medicine in a global world, OMICS: J. Integr. Biol., 2013, 17(9), 451–459 CrossRef CAS PubMed.
- Q. Qiu, C. Li, Y. Wang, C. Xiao, Y. Li, Y. Lin and W. Wang, Plasma metabonomics study on Chinese medicine syndrome evolution of heart failure rats caused by LAD ligation, BMC Complementary Altern. Med., 2014, 14(1), 232–245 CrossRef PubMed.
- Y. Y. Chen, Y. T. Hsue, H. H. Chang and M. J. Gee, The association between post-menopausal osteoporosis and kidney-vacuity syndrome in traditional Chinese medicine, Am. J. Chin. Med., 1999, 27(1), 25–35 CrossRef CAS PubMed.
- S. W. Shen, J. P. Hui, Y. Yuwen, J. H. Wang, L. Y. Chen, Y. Niu, N. Peng, Z. H. Yang and Y. Zhao, Study on canceration law of gastric mucosal dysplasia based on syndromes of Chinese medicine, Chin. J. Integr. Med., 2011, 17(5), 346–350 CrossRef PubMed.
- K. J. Chen, D. Z. Shi and H. Xu, The criterion of syndrome differentiation and quantification for stable coronary heart disease caused by etiological toxin of Chinese medicine, Chin. J. Integr. Med., 2011, 31(3), 313–314 Search PubMed.
- Y. Gu, C. Lu, Q. L. Zha, H. W. Kong, X. Lu, A. P. Lu and G. W. Xu, Plasma metabonomics study of rheumatoid arthritis and its Chinese medicine subtypes by using liquid chromatography and gas chromatography coupled with mass spectrometry, Mol. BioSyst., 2012, 8(5), 1535–1543 RSC.
- H. Wei, W. Pasman, C. Rubingh, S. Wopereis, M. Tienstra, J. Schroen, M. Wang, E. Verheij and J. van der Greef, Urine metabolomics combined with the personalized diagnosis guided by Chinese medicine reveals subtypes of pre-diabetes, Mol. BioSyst., 2012, 8(5), 1482–1491 RSC.
- J. Shang, J. Liu, M. He, E. X. Shang, L. Zhang, M. Q. Shan, W. F. Yao, B. Yu, Y. Z. Yao and A. W. Ding, UHPLC/Q-TOF MS-based plasma metabolic profiling analysis of the bleeding mechanism in a rat model of yeast and ethanol-induced blood heat and hemorrhage syndrome, J. Pharm. Biomed. Anal., 2014, 92, 26–34 CrossRef CAS PubMed.
- R. Q. Chen, J. Wang, C. B. Liao, N. Ma, L. Zhang and X. F. Wang, 1H NMR studies on serum metabonomic changes over time in a kidney-Yang deficiency syndrome model, RSC Adv., 2017, 7, 34251–34261 RSC.
- Y. Wang, S. J. Zhou, M. Wang, S. Y. Liu, Y. J. Hu, C. W. He, P. Li and J. B. Wan, UHPLC/Q-TOFMS-based metabolomics for the characterization of cold and hot properties of Chinese material media, J. Ethnopharmacol., 2015, 179, 234–242 CrossRef PubMed.
- G. Q. Xie, Exploration and analysis on toxic heat and blood stasis syndrome, China J. Tradit. Chin. Med. Pharm., 2013, 28, 3472–3474 Search PubMed.
- M. Xue, H. J. Yin, C. F. Wu, X. J. Ma, C. Y. Guo, Y. Huang, D. Z. Shi and K. J. Chen, Effect of Chinese drugs for activating blood circulation and detoxifying on indices of thrombosis, inflammatory reaction, and tissue damage in a rabbit model of toxin-heat and blood stasis syndrome, Chin. J. Integr. Med., 2013, 19, 42–47 CrossRef CAS PubMed.
- J. Yang and P. C. Lu, Construction of rabbit model series of toxic heat and blood stasis syndromes, J. Nanjing Univ. Tradit. Chin. Med., 1995, 11, 70–72 Search PubMed.
- Y. S. Xu, Y. L. Ou and D. H. Wang, Study on blood stasis of warm disease essence, Shanghai J. Tradit. Chin. Med., 1989, 5, 31–34 Search PubMed.
- A. H. Liang, X. S. Ding, W. Li, B. Y. Xue, J. H. Wang and H. J. Yang, Development of an animal model of blood stasis syndrome and thrombosis, China J. Chin. Mater. Med., 2005, 30, 1613–1616 Search PubMed.
- S. N. Lv, B. B. Han, S. J. Wang, C. L. Liu and L. X. Dong, Berberine substance groups obtained from HPLC have effects on the content of IL-1β, IL-6, IL-8 and TNF-α of the excessive heat syndrome model rats, Pharmacol. Clin. Chin. Mater. Med., 2012, 28, 130–131 Search PubMed.
- X. C. Lin, B. H. Zhan, S. Wen, Z. S. Li, H. G. Huang and J. H. Feng, Metabonomic alterations from pancreatic intraepithelial neoplasia to pancreatic ductal adenocarcinoma facilitate the identification of biomarkers in serum for early diagnosis of pancreatic cancer, Mol. BioSyst., 2016, 12, 2883–2892 RSC.
- M. Moeder, A. Kiessling and H. Loester, Current methods for determination of L-carnitine and acylcarnitines, Monatsh. Chem., 2005, 136(8), 1279–1291 CrossRef CAS.
- M. Wasa, H. Soh, Y. Shiminzu and M. Fukuzawa, Glutamine stimulates amino acid transport during is chemia-reperfasion in human intestinal epithelial cells, J. Surg. Res., 2005, 123(1), 75–81 CrossRef CAS PubMed.
- L. E. Laróvere, S. M. Ruiz, C. J. Angaroni and R. D. de Kremer, Molecular epidemiology of citrullinemia type I in a risk region of Argentina: a first step to preconception heterozygote detection, JIMD Rep., 2012, 6, 27–29 Search PubMed.
- M. A. Thelin, B. Bartolini, J. Axelsson, R. Gustafsson, E. Tykesson, E. Pera, A. Oldberg, M. Maccarana and A. Malmstrom, Biological functions of iduronic acid in chondroitin/dermatan sulfate, FEBS J., 2013, 280(10), 2431–2446 CrossRef CAS PubMed.
- J. H. Kim, J. O. Lee, S. K. Lee, J. W. Moon, G. Y. You, S. J. Kim, S. H. Park, J. M. Park, S. Y. Lim, P. G. Suh, K. O. Uhm, M. S. Song and H. S. Kim, The glutamate agonist homocysteine sulfinic acid stimulates glucose uptake through the calcium-dependent AMPK-p38 MAPK-protein kinase C Pathway in skeletal muscle cells, J. Biol. Chem., 2011, 286(9), 7567–7576 CrossRef CAS PubMed.
- H. Miao, M. H. Li, X. Zhang, S. J. Yuan, C. C. Yo and Y. Y. Zhao, The antihyperlipidemic effect of Fu-Ling-Pi is associated with abnormal fatty acid metabolism as assessed by UPLC-HDMS-based lipidomics, RSC Adv., 2015, 5(79), 64208–64219 RSC.
- Y. Ma, Y. R. Bao, S. Wang, T. J. Li, X. Chang, G. Yang and X. Meng, Anti-inflammation effects and potential mechanism of saikosaponins by regulating nicotinate and nicotinamide metabolism and arachidonic acid metabolism, Inflammation, 2016, 39(4), 1453–1461 CrossRef CAS PubMed.
- Z. J. Zou, Z. H. Liu, M. J. Gong, B. Han, S. M. Wang and S. W. Liang, Intervention effects of puerarin on blood stasis in rats revealed by a 1H NMR-based metabonomic approach, Phytomedicine, 2015, 22(3), 333–343 CrossRef CAS PubMed.
- S. Matsuoka, H. Jo, N. Sarai and A. Noma, An in silico study of energy metabolism in cardiac excitation-contraction coupling, Jpn. J. Physiol., 2004, 54(6), 517–522 CrossRef CAS PubMed.
- A. P. Gimenez-Roqueplo, J. Favier, P. Rustin, J. J. Mourad, P. F. Plouin, P. Corvol, A. Rotig and X. Jeunemaitre, The R22X mutation of the SDHD gene in hereditary paraganglioma abolishes the enzymatic activity of complex II in the mitochondrial respiratory chain and activates the hypoxia pathway, Am. J. Hum. Genet., 2001, 69(6), 1186–1197 CrossRef CAS PubMed.
- S. P. Whelan, E. H. Carchman, B. Kautza, I. Nassour, K. Mollen, D. Escobar, H. Gomez, M. A. Rosengart, S. Shiva and B. S. Zuckerbraun, Polymicrobial sepsis is associated with decreased hepatic oxidative phosphorylation and an altered metabolic profile, J. Surg. Res., 2014, 186(1), 297–303 CrossRef CAS PubMed.
- K. Kamisoglu, K. E. Sleight, S. E. Calvano, S. M. Coyle, S. A. Corbett and I. P. Androulakis, Temporal metabolic profiling of plasma during endotoxemia in humans, Shock, 2013, 40(6), 519–526 CrossRef CAS PubMed.
- P. Li, S. T. Liao, J. S. Wang, D. Q. Xu, Q. Zhang, M. H. Yang and L. Y. Kong, NMR metabolic profiling of lipopolysaccharide-induced mice sepsis and the treatment effects of berberine, RSC Adv., 2016, 6(53), 47474–47485 RSC.
- A. Donaszi-Ivanov, P. Scharek, A. Falus and A. K. Fulop, Hepatic acute-phase reaction in histamine-deficient gene targeted mice, Inflammonpharmacology, 2004, 12(1), 47–55 CrossRef CAS PubMed.
- U. F. Engelke, M. L. Liebrand-van Sambeek, J. G. de Jong, J. G. Leroy, E. Morava, E. Morava, J. A. Smeitink and R. A. Wevers, N-Acetylated metabolites in urine: proton nuclear magnetic resonance spectroscopic study on patients with inborn errors of metabolism, Clin. Chem., 2004, 50(1), 58–66 CAS.
- W. Chen, J. Guo, Y. Zhang and J. Zhang, The beneficial effects of taurine in preventing metabolic syndrome, Food Funct., 2016, 7(4), 1849–1863 CAS.
- L. R. Gray, S. C. Tompkins and E. B. Taylor, Regulation of pyruvate metabolism and human disease, Cell. Mol. Life Sci., 2014, 71(14), 2577–2604 CrossRef CAS PubMed.
Footnote |
| † Electronic supplementary information (ESI) available. See DOI: 10.1039/c7ra11748e |
| This journal is © The Royal Society of Chemistry 2017 |

