 Open Access Article
Creative Commons Attribution 3.0 Unported Licence
Characterization of protein adsorption on stretched polyurethane nanofibers prepared by electrospinning
Yuko Morita*a,
Hiroaki Sakamoto *ab and
Shin-ichiro Suyea
aFiber Technology Science, Graduate School of Engineering, University of Fukui, 3-9-1 Bunkyo, Fukui-shi, Fukui 910-8507, Japan. E-mail: hi-saka@u-fukui.ac.jp
bTenure-Track Program for Innovative Research, University of Fukui, 3-9-1 Bunkyo, Fukui-shi, Fukui 910-8507, Japan
First published on 15th December 2017
Abstract
Conformation and activity control of proteins adsorbed on certain material surfaces enables the development of numerous high-performance applications. Herein, we examined the relationship between the diameter (surface shape) of polyurethane (PU) nanofibers and the conformation/activity of proteins adsorbed thereon, showing that hard segments align linearly in the long-axis direction when the PU structure is changed from random-segment to stretched nanofibers. Moreover, we revealed that the clustering of hydrophobic hard PU segments and protein adsorption are caused by hydrophobic interactions. Proteins adsorbed on thick nanofibers (diameter = 950 nm) showed decreased activity due to large conformational changes, whereas those adsorbed on thin nanofibers (diameter = 480 nm) retained a close-to-natural shape and thus showed relatively high activity, confirming that the shape of PU nanofiber surface affects the conformation and activity of proteins adsorbed thereon.
1. Introduction
Adsorption of biomolecules (e.g., proteins) onto material surfaces is important for biotechnology development, with immobilized biomolecule-based devices finding numerous applications in biomimetic materials,1,2 biosensors,3,4 biochips,5,6 and drug delivery.7,8 Importantly, the performance of these devices depends not only on the amount of adsorbed biomolecules but also on their conformational stability and activity.Protein adsorption behavior can be controlled by adsorbent chemistry, particle size, and surface morphology, with previous studies9–13 demonstrating that hydrophilic materials induce less pronounced structural changes of adsorbed proteins than hydrophobic ones. Furthermore, investigations of the influence of material surface shape, e.g., of the relationship between nanoparticle size and protein conformation,14–16 illustrated that the protein structure stabilizes with decreasing particle size, with a close-to-natural structure observed when the particle size matches that of the protein. Therefore, it is expected that material performance can be adjusted by controlling the surface chemistry and shape at the nanoscale.
Polyurethane (PU) forms a phase separation structure comprising a random sequence of aromatic segments, hard segments composed of urethane bonds, polyester, and soft polyether segments.17,18 The above structure prevents protein adsorption, making PU a useful biomaterial (e.g., for lining artificial blood vessels).
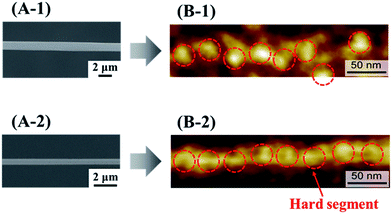
Electrospinning is an efficient technique for preparing polymer nanofibers, with high collector rotation speeds resulting in a large elongation force that controls not only fiber orientation and diameter but also the orientation of constituent molecules.19,20 Herein, we imaged the surface of electrospun PU nanofibers by atomic force microscopy (AFM), revealing that the hard segments in PU nanofibers subjected to an elongation force at the time of preparation (stretched PU nanofibers) were linearly arranged in the long axis direction, in contrast to the hard segments in PU nanofibers not subjected to this force (non-stretched PU nanofibers)21 (Fig. 1).
Therefore, the above change of fiber structure was thought to influence surface physical properties, inspiring us to evaluate protein adsorption onto PU nanofibers.
Two types of bovine serum albumin (BSA) (pKa 4.7, negatively charged at pH 7.4) and lysozyme (Lyz) (pKa 11, positively charged at pH 7.4) were used as model proteins. Both BSA and Lyz were not adsorbed on non-stretched PU nanofibers, whereas the protein adsorption capability of stretched PU nanofibers increased with their decreasing diameter. The above behavior was ascribed to a surface structural change caused by the linear arrangement of randomly distributed hard segments experiencing an elongation force at the time of fiber preparation. Moreover, BSA and Lyz showed similar adsorption behaviors, which implied that protein charge did not influence adsorption behavior and thus indicated that adsorption was probably not caused by electrostatic interactions. Importantly, protein desorption could be achieved by washing with a nonionic surfactant (Tween 20). Moreover, the fact that the protein–surfactant interaction was not affected by protein charge implied that the above adsorption was most likely caused by hydrophobic interactions.22
Thus, in contrast to poorly protein-adsorbing conventional PU fibers, stretched PU nanofibers featured extended hydrophobic regions comprising linearly arranged hard segments. As a result, the latter fibers engaged in enhanced hydrophobic interactions with proteins and thus showed enhanced protein adsorption capability.
In view of the above, we herein focused on the secondary structure and activity of proteins adsorbed on PU nanofibers. Notably, the extensive investigation of nanoparticles performed in recent years has enabled their numerous in vivo applications in nanomedicine,23,24 drug delivery, and cell imaging.8,25 However, the structural changes of proteins adsorbed on nanoparticles cause protective responses of host organisms and can thus have dangerous consequences, requiring the relationship between material surface shape and protein conformation to be investigated in detail. Herein, we aimed to shed light on this topic, evaluating changes of adsorbed protein conformation and activity by utilizing stretched PU nanofibers with different diameter and controlled surface shape.
2. Experimental
2.1 Materials and sample preparation
PU pellets (BASF; Elastollan 1180A; Mw = 60![[thin space (1/6-em)]](https://www.rsc.org/images/entities/char_2009.gif) 000 Da) were dissolved in a 95
000 Da) were dissolved in a 95![[thin space (1/6-em)]](https://www.rsc.org/images/entities/char_2009.gif) :
:![[thin space (1/6-em)]](https://www.rsc.org/images/entities/char_2009.gif) 5 (v/v) mixture of tetrahydrofuran (THF; Wako) and N,N-dimethylformamide (DMF; Wako) by stirring at room temperature overnight to obtain 8.0, 10.0, and 16.0% (w/v) solutions. Ethanol (Wako) was diluted to 70% prior to use. Phosphate buffer solution (PBS) (pH 7.4) was prepared using Na2HPO4 (50 mM) and NaH2PO4 (50 mM). Fluorescein isothiocyanate (FITC-I; Dojindo) was coupled with horseradish peroxidase (HRP; Sigma) to prepare FITC-labeled HRP (FITC-HRP). FITC-HRP and HRP solutions (0.1 mg mL−1) were prepared in 50 mM PBS. Ultrapure water was used for dilution.
5 (v/v) mixture of tetrahydrofuran (THF; Wako) and N,N-dimethylformamide (DMF; Wako) by stirring at room temperature overnight to obtain 8.0, 10.0, and 16.0% (w/v) solutions. Ethanol (Wako) was diluted to 70% prior to use. Phosphate buffer solution (PBS) (pH 7.4) was prepared using Na2HPO4 (50 mM) and NaH2PO4 (50 mM). Fluorescein isothiocyanate (FITC-I; Dojindo) was coupled with horseradish peroxidase (HRP; Sigma) to prepare FITC-labeled HRP (FITC-HRP). FITC-HRP and HRP solutions (0.1 mg mL−1) were prepared in 50 mM PBS. Ultrapure water was used for dilution.
2.2 Preparation of stretched PU nanofibers by electrospinning
Stretched PU nanofibers were electrospun (MECC, Inc.) from 8, 10, and 16% PU solutions. A 1 mm-thick acrylic plate was machined to a length/width of 6/10 mm using a laser processing instrument (Universal Laser Systems Inc., Universal Laser Systems). To prevent background fluorescence, a 1 mm-long and 6 mm-wide hole was made in the middle of the above plate, and PU nanofibers were spun into a bridged state.The PU solution was placed into a 10 mL syringe (Henke Sass Wolf Inc.), and a metallic 27 G needle (Terumo Needle Inc.) was attached. The syringe was connected to a syringe pump (ULVAC Inc.; DA-30D), with the injection rate of PU solution and applied voltage set at 1.0 mL h−1 and 25 kV (8%, 10% PU) or 30 kV (16% PU), respectively. The acrylic substrate was cleaned by sequential 10 min ultrasonication (Honda Inc.) in 70% ethanol and ultrapure water, and subsequently attached to a collector (MECC Inc.; SD-02). A glass substrate (1 mm-thick, 2 cm-long, 1 cm-wide) was cleaned by sequential 10 min sonication in THF and ultrapure water, and then attached to the collector. Stretched PU nanofibers were prepared by spinning at a collector rotation speed of 2000 rpm for 10 s or 15–60 min and dried under reduced pressure in a desiccator (AS ONE Inc.) overnight.
2.3 Quantitation of adsorbed protein
FITC-HRP (excitation at 488 nm, emission at 530 nm; pKa 7.2) was used as a model protein for adsorption.Stretched PU nanofibers prepared on the acrylic substrate were immersed into a solution of FITC-HRP (0.1 mg mL−1) held in a polystyrene dish (diameter = 35 mm, height = 10 mm) and incubated overnight at 37 °C. Subsequently, the incubated nanofibers were immersed into 50 mM PBS and washed with deionized water. The thus conditioned stretched PU nanofibers with adsorbed proteins were imaged by fluorescence microscopy (Olympus Inc.). Fluorescence images were analyzed by ImageJ software, and the amount of adsorbed protein was calculated by quantifying fluorescence intensity. Thereafter, scanning electron microscopy (SEM; JEOL) was used to image fibers and measure their diameters.
2.4 Evaluation of adsorbed protein conformation
HRP (pKa 7.2) was used as a model protein to be adsorbed. According to the abovementioned procedure, stretched PU nanofibers prepared on the glass substrate were immersed in 0.1 mg mL−1 HRP solution, and the conformation of adsorbed HRP was analyzed using Fourier transform infrared (FTIR) spectroscopy (Thermo Fisher Scientific), with the spectrum of adsorbed HRP obtained as the difference between the spectrum of pristine PU nanofibers and that of PU nanofibers + HRP.2.5 Evaluation of adsorbed enzyme activity
According to the abovementioned procedure, stretched PU nanofibers produced on the acrylic substrate were immersed into 0.1 mg mL−1 HRP solution, and the adsorbed HRP was allowed to react with a luminescent substrate (luminol), with reaction progress monitored using a luminometer (Matou Inc.).3. Results and discussion
3.1 Quantitation of adsorbed HRP
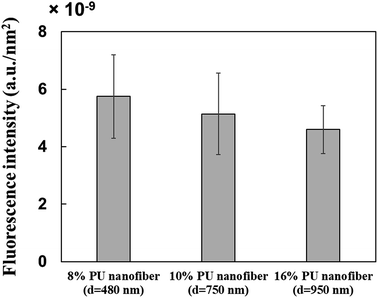
Three types of PU fibers were prepared at a constant collector rotation speed (2000 rpm) by controlling the PU solution concentration, with the average nanofiber diameters obtained using 8, 10, and 16% solutions equaling 482 ± 145, 756 ± 152, and 947 ± 163 nm, respectively. The commonly observed viscoelasticity increase with increasing polymer concentration26 also applies to stretched fibers.27 Thus, 16% PU nanofibers with the highest viscoelasticity probably featured the hardest surface among the three types of PU nanofibers.Single fibers were observed to assess the amounts of HRP adsorbed thereon. The observation of fluorescence for all types of stretched PU nanofibers (Fig. 2B) confirmed that HRP was adsorbed on the nanofiber surface. Therefore, even when stretched nanofibers were prepared using solutions with different PU concentrations, their surfaces exhibited a similar segment structure (hard segments linearly arranged in the major axis direction). In addition, the amount of adsorbed HRP per unit area, calculated by quantifying the fluorescence intensity, was almost independent of nanofiber diameter (Fig. 3).
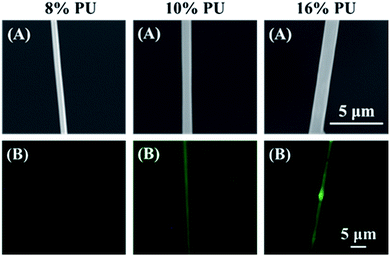 | ||
| Fig. 2 SEM (A) and fluorescence microscopy (B) images of stretched PU nanofibers with different diameters. | ||
3.2 Structural changes of adsorbed HRP
Adsorption of biomolecules such as proteins results in pronounced conformational changes due to biomolecule–adsorbent interactions, with the largest structural changes observed for planar-surface materials, whereas these changes are reported to decrease with decreasing particle size for curved-surface materials such as nanoparticles.The secondary structure of adsorbed HRP was analyzed by FTIR spectroscopy to calculate α-helix and β-sheet percentages. In the acquired spectra, the peak centered at 1700–1600 cm−1 was denoted as the amide I band, being ascribed to the C![[double bond, length as m-dash]](https://www.rsc.org/images/entities/char_e001.gif) O stretching vibration of the peptide bond (Fig. 4). Since the position and shape of this peak depend on the secondary structure of the protein, this band is often used in conformational analysis.14,16
O stretching vibration of the peptide bond (Fig. 4). Since the position and shape of this peak depend on the secondary structure of the protein, this band is often used in conformational analysis.14,16
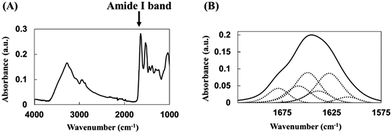 | ||
| Fig. 4 (A) Representative FTIR spectrum of native HRP. (B) Deconvolution of the HRP amide I band into structural components, with dotted lines showing fitted component peaks. | ||
Compared to those of the natural state, the α-helix and β-sheet percentages in HRP adsorbed on thick 16% PU nanofibers significantly decreased, implying the occurrence of large conformational changes. On the other hand, the above percentages were almost unchanged in HRP adsorbed on thin 8% PU nanofibers, indicating that almost no structural change occurred and suggesting that the adsorbed protein retained a close-to-natural shape in this case (Fig. 5). Since thick 16% PU nanofibers exhibited a flatter surface than thin 8% PU nanofibers, it was believed that the conformation change was largely caused by the increased protein–fiber junction area.
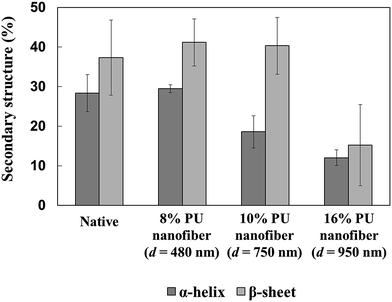 | ||
| Fig. 5 α-Helix and β-sheet percentages in native HRP and HRP adsorbed on stretched PU nanofibers of different diameters. | ||
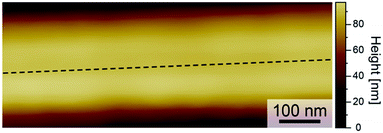
Prior to adsorption experiments, the surface roughness of 10% PU nanofibers determined by AFM was small (Fig. 6). However, the above technique does not allow one to observe molecular-level surface roughness (1–5 nm) of PU nanofibers, which, if present, can affect the retention of protein structure, with the magnitude of this influence increasing with decreasing concentration.
Proteins are polymers of amino acids, thus containing both polar and nonpolar side groups. In solution, most polar groups are found on the external surface of proteins and engage in strong interactions with water molecules. However, if HRP is attached to the nonpolar surface of PU nanofibers, its hydrophobic amino acid groups interact with the hydrophobic areas (hard segments) of these nanofibers, inducing a conformational change. The above interaction is thought to be more detrimental to β-sheets than to the more weakly hydrogen-bonded α-helices, explaining the higher decrease observed for the percentage of the former structure. The active site of HRP (i.e., heme) features a random coil formed from secondary structures such as α-helices and β-sheets, and thus, structural changes affecting α-helices are also thought to affect heme structure (Fig. 7). Thus, the abovementioned results imply that HRP was adsorbed onto PU nanofibers via hydrophobic interactions.
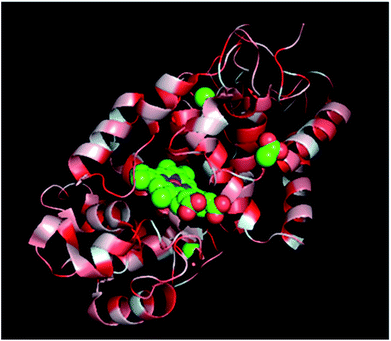 | ||
| Fig. 7 Secondary structure of a single HRP subunit: red = hydrophobic amino acid group, center = heme active site. | ||
3.3 Activity change of adsorbed HRP as a function of PU nanofiber diameter
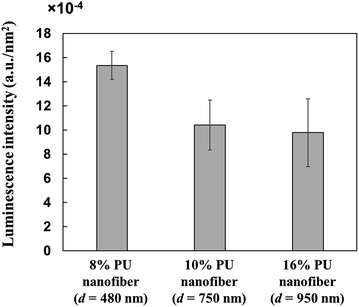
Since PU nanofiber diameter influenced the conformation of adsorbed HRP, we evaluated the relationship between the above diameter and the activity of adsorbed proteins, revealing that HRP adsorbed on thin 8% PU nanofibers was more active than that adsorbed on thick 16% PU nanofibers (Fig. 8). Since the amount of adsorbed HRP was almost independent of nanofiber diameter (Section 3.1), it could not account for such an activity difference. Therefore, the above behavior implied that HRP adsorbed on thick PU nanofibers underwent a significant structural change and thus lost much of its activity. Conversely, HRP adsorbed on thin nanofibers was believed to retain a close-to-natural structure and thus show relatively high activity.The abovementioned variation of HRP structure with nanofiber diameter was explained by the corresponding change of the PU nanofiber–HRP junction area and thus, of the hydrophobic interaction during adsorption. As mentioned above, since the amounts of adsorbed HRP were almost independent of fiber diameter, the observed activity differences implied that the surface shape of PU nanofibers influenced the conformation and activity of adsorbed HRP. However, since all PU nanofibers were very large compared to HRP, they could not be viewed as curved surfaces from the viewpoint of HRP. Nevertheless, unlike in previous studies dealing with nanoparticles, we herein observed that the conformation of HRP was stabilized upon adsorption onto 480 nm-diameter nanofibers. Therefore, the surface of stretched PU nanofibers was though to feature a certain asperity at a level from several nanometers to several tens of nanometers.
4. Conclusions
Herein, we evaluated the conformational and activity changes of HRP adsorbed on the surface of stretched PU nanofibers with different diameters (Fig. 9), demonstrating that the nanofiber–HRP junction area can be adjusted by controlling nanofiber diameter and the strength of the hydrophobic interaction at adsorption. However, in contrast to previous results, wherein the conformation of adsorbed proteins was retained when the size of nanoparticles approximately equaled that of the protein, the conformation of HRP was herein stabilized upon adsorption on 480 nm-diameter nanofibers, suggesting the formation of a certain asperity at a level from several nanometers to several tens of nanometers on the surface of these stretched PU nanofibers. In the future, we plan to investigate this asperity at a several-nanometer level, evaluate interactions between PU nanofibers and proteins, and discuss the relationship between nanofiber surface shape and protein conformation/activity in detail. Finally, we have shown that the use of nanofibers instead of nanoparticles allows proteins to be arranged in the major axis direction, opening up the way to the creation of higher functional materials.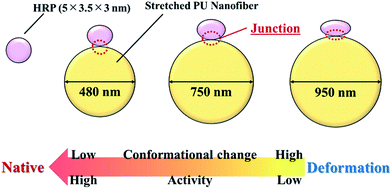 | ||
| Fig. 9 Relationship between the diameter of stretched PU nanofibers and the conformation and activity of adsorbed HRP. | ||
Conflicts of interest
The authors declare no competing financial interest.Acknowledgements
This work was supported by the Japan Society of the Promotion of Science (JSPS) KAKENHI (17K17765) Grant-in-Aid for Young Scientists (B).Notes and references
- B. Kasemo and J. Gold, Adv. Dent. Res., 1999, 13, 8 CrossRef CAS PubMed.
- D. A. Puleo and A. Nanci, Biomaterials, 1999, 20, 2311 CrossRef CAS PubMed.
- J. M. Nam, C. S. Thaxton and C. A. Mirkin, Science, 2003, 301, 1884 CrossRef CAS PubMed.
- B. Leca-Bouvier and L. J. Blum, Anal. Lett., 2005, 38, 1491 CrossRef CAS.
- A. Lagraulet, JALA, 2010, 15, 405 CAS.
- V. Stadler, T. Felgenhauer, M. Beyer, S. Fernandez, K. Leibe, S. Güttler, M. Gröning, K. König, G. Torralba, M. Hausmann, V. Lindenstruth, A. Nesterov, I. Block, R. Pipkorn, A. Poustka, F. R. Bischoff and F. Breitling, Angew. Chem., Int. Ed., 2008, 47, 7132 CrossRef CAS PubMed.
- I. Brigger, C. Dubertnet and P. Couvreur, Adv. Drug Delivery Rev., 2002, 54, 631 CrossRef CAS PubMed.
- W. H. De Jong and P. J. A. Borm, Int. J. Nanomed., 2008, 3, 133 CrossRef CAS.
- S. Srivastava, A. Verma, B. L. Frankamp and V. M. Rotello, Adv. Mater., 2005, 17, 617 CrossRef CAS.
- P. Roach, D. Farrar and C. C. Perry, J. Am. Chem. Soc., 2005, 127, 8168 CrossRef CAS PubMed.
- L.-C. Lora Huang and H.-C. Chang, Langmuir, 2004, 20, 5879 CrossRef.
- B. G. Keselowsky, D. M. Collard and A. J. Garcia, Biomaterials, 2004, 25, 5947 CrossRef CAS PubMed.
- K. P. Fears and R. A. Latour, Langmuir, 2009, 25, 13926 CrossRef CAS PubMed.
- P. Roach, D. Farrar and C. C. Perry, J. Am. Chem. Soc., 2006, 128, 3939 CrossRef CAS PubMed.
- K. Rechendorff, M. B. Hovgaard, M. Foss and V. P. Zhdanov, Langmuir, 2006, 22, 10885 CrossRef CAS PubMed.
- A. Seehuber and R. Dahint, J. Phys. Chem. B, 2013, 117, 6980 CrossRef CAS PubMed.
- Y. Li, T. Gao, J. Liu, K. Linliu, R. C. Desper and B. Chu, Macromolecules, 1992, 25, 7365 CrossRef CAS.
- G. Hayase, K. Kanamori, K. Abe, H. Yano, A. Maeno, H. Kaji and K. Nakanishi, ACS Appl. Mater. Interfaces, 2014, 6, 9466 CAS.
- M. Takasaki, Y. Ohkoshi, Y. Gotoh and M. Nagura, Sen'i Gakkaishi, 2000, 56, 428 CrossRef CAS.
- D. H. Reneker and I. Chun, Nanotechnology, 1996, 7, 216 CrossRef CAS.
- H. Sakamoto, H. Asakawa, T. Fukuma, S. Fujita and S. Suye, Sci. Technol. Adv. Mater., 2014, 15, 15008 CrossRef PubMed.
- Y. Morita, G. Koizumi, H. Sakamoto and S. Suye, Mater. Chem. Phys., 2017, 187, 1 CrossRef CAS.
- K. K. Jain, Med. Princ. Pract., 2008, 17, 89 CrossRef CAS PubMed.
- A. Elsaesser and C. V. Howard, Adv. Drug Delivery Rev., 2012, 64, 129 CrossRef CAS PubMed.
- S. Nie, Y. Xing, G. J. Kim and J. W. Simons, Annu. Rev. Biomed. Eng., 2007, 9, 257 CrossRef CAS PubMed.
- Y. Isono, T. Fujimoto, N. Takeno, H. Kajiura and M. Nagasawa, Macromolecules, 1978, 11, 888 CrossRef CAS.
- S. Toki, I. Sics, S. B. Hsiao, S. Murakami, M. Tosaka, S. Poompradub, S. Kohjiya and Y. Ikeda, J. Polym. Sci., Part B: Polym. Phys., 2004, 42, 956 CrossRef CAS.
| This journal is © The Royal Society of Chemistry 2017 |

