Activity of N–H in phenothiazine derivatives: synthesis and applications in fluoride ions sensing and electrochromism†
Weidong
Zhang
*a,
Xiucun
Feng
a,
Chao
Zhang
 a,
Qiangqiang
Jia
d,
Xingliang
Liu
 *a and
Kun
Zhou
 *bc
*bc
aSchool of Chemical Engineering, Qinghai University, Xining, 810016, China. E-mail: zhangwd@qhu.edu.cn
bSchool of Science and Engineering, Shenzhen Institute of Aggregate Science and Technology, The Chinese University of Hong Kong, Shenzhen, Guangdong 518172, China. E-mail: zhoukun@cuhk.edu.cn
cGuangdong Provincial Key Laboratory of Luminescence from Molecular Aggregates (South China University of Technology), Guangzhou 510640, China
dState Key Laboratory of Plateau Ecology and Agriculture, Qinghai University, Xining, 810016, China
First published on 28th January 2023
Abstract
A series of phenothiazine derivatives containing N–H, 3a, 3b, 3c and a N-substituted phenothiazine derivative, 3d were synthesized. These phenothiazine derivatives exhibited good air/moisture stability and excellent fluorescence properties. They showed excellent chromic behaviour in response to multiple external stimuli, especially fluoride ions and the application of electric voltages. The addition of fluoride ions to these phenothiazine derivatives induced a rapid change in the emission colour from blue to yellow, accompanied by significant changes in the emission intensity. This response was shown to be highly selective to fluoride ions. Films deposited from solutions of a blend of 3a and polycaprolactone also demonstrated a good ratiometric sensing ability for fluoride ions. Electrochromic devices (ECDs) fabricated from these composites exhibited reversible changes in color that depended on the applied voltage.
1. Introduction
Driven by the increasing importance of intelligent technology, significant progress has been made in recent times in the development of stimuli-sensitive, “intelligent” materials for various applications, which include mimicking photosynthesis,1–3 catalysis,4 diverse biological applications,5–7 sensing,8–11 and smart windows.12,13 As highly reactive intermediate species, organic radicals play an important role in the fabrication and the characteristic properties of numerous engineered, stimuli sensitive-materials. Recently, chemists and materials scientists have given a lot of attention to long-lived, organic radical species that have unique electronic properties due to their magnetic spin moments arising from singly occupied molecular orbitals.14–16 However, they come with their own set of challenges because these radicals generally tend to be very reactive, and unstable, as well as mono-stimuli-responsive. Thus, the development of novel, long-lived, and fast, multi-stimuli-responsive radical species is vital to the development of applications that can exploit their unique properties.The phenothiazine (PTZ) unit is an electron-rich tricyclic heteroarene, characterized by the presence of powerful electron donors like nitrogen and sulphur atoms. PTZ materials typically exhibit relatively intense luminescence, high photoconductivity, and reversible oxidation.17–19 The success of PTZ-based optoelectronic devices is attributed to the stable, heterocyclic structure of their radical cations. A region of significant electron density, primarily localized on the sulphur atom in the phenothiazine core scaffold, is associated with electrophores, producing dyads and triads. This makes the phenothiazine unit highly sensitive to oxidizing agents and is especially susceptible to electronic substitutions at the 3, or 7-position. PTZ has tuneable redox properties and can exhibit reversible and fast electron transfer reactions to form stable neutral, monocation, and dication radicals.20–22 Because of the presence of electron-rich sulphur and nitrogen heteroatoms, and an ionization potential of 6.73 eV, phenothiazine is well suited for the synthesis of donor–acceptor (D–A) materials with enhanced intramolecular charge transfer (ICT) characteristics in the ground state and photoinduced electron transfer (PET) properties in the excited-state, which are widely used as photoactive materials in organic electronic devices, such as organic light-emitting diodes (OLEDs), organic field effect transistors (OFETs), chemical sensors, organic solar cells (OSCs), and batteries.23–27 However, most these photoactive materials use the protected PTZ structure (N-substituted phenothiazine derivatives), in which the nitrogen atom at the 10-position (10 N–H) is replaced by a covalent group.28–30
Because of its highest charge density and Lewis basic nature, fluoride has received well-deserved attention from the scientific community owing to its association with a diverse array of biological, medical, and technological processes.31–33 Since the fluoride ion is a strong hydrogen bond acceptor, a large number of optical sensors have been developed based on fluoride induced deprotonation through H-bonding for detecting fluoride ions. However, most of the H-bonding type fluoride ion sensors involve expensive and lengthy synthetic protocols and show relatively poor selectivity, especially interfered by alkaline anions like AcO− and H2PO4−.34,35 Therefore, the development of simple organic receptors containing functional groups or heterocyclic rings proficient for the selective detection of fluoride with high selectivity and sensitivity have become a highly popular topic of interest to scientists. PTZ materials are typical excited-state intramolecular proton transfer (ESIPT) materials,36 in which the acidity of the H-bond donor within the ICT chromophores can be synthetically manipulated to allow selective interaction with the basic fluoride. Based on these considerations, we synthesized the phenothiazine derivatives by a typical Suzuki–Miyaura coupling reaction, which were successfully used as chemosensors for the ratiometric detection of F− with high selectivity and sensitivity.
Electrochromism is a phenomenon in which the colour of a material changes reversibly depending on the redox reactions when an electrical potential is applied. This feature is very important for a wide range of applications such as smart windows, screens, solar-to-fuel conversion, sensors, energy storage, and versatile functional electrochromic displays.37,38 In recent years, a lot of research has focused on electrochromic materials like transition metal oxides, organic molecules (viologens), and polymeric electrochromic materials, which can achieve electro-induced colouration and colour switching on the application of an external voltage.39–44 Whereas, because of the complex synthesis process and unstable radical cation, those materials would be the limiting factor for excellent device performance and broader applications. Therefore, we successfully used the phenothiazine derivatives in devices on account of the highly stable radical cation, and they showed excellent advantages as electrochromic materials.
2. Results and discussion
2.1 Synthesis and characterization
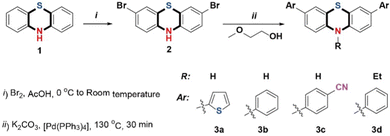
Precursor 2 was synthesized as described by Xiao-Qing Zhu, et al.45 10H-Phenothiazine was suspended in glacial acetic acid and a solution of bromine in glacial acetic acid was added dropwise with continuous stirring to yield compound 2 as green crystals. A typical Suzuki-Miyaura coupling reaction, significantly modified to avoid column chromatography, was carried out. Precursor 2 was dissolved in a boiling, 10![[thin space (1/6-em)]](https://www.rsc.org/images/entities/char_2009.gif) :
:![[thin space (1/6-em)]](https://www.rsc.org/images/entities/char_2009.gif) 1 mixture of ethoxyethanol and water under a nitrogen atmosphere. Immediately after that, aromatic boronic acid, potassium carbonate, and Pd(PPh3)4 were added with vigorous stirring at 130 °C for 30 minutes to get the compounds 3a, 3b, and 3c, with yields of 93%, 95%, and 92%, respectively. The peak of N–H in the phenothiazine unit appears at 8.906 ppm (3a), 8.847 ppm (3b), and 9.084 ppm (3c). The N-substituted phenothiazine derivative 3d was also successfully synthesized with an 86% yield (Scheme 1). The intermediate and the target molecules were characterized by 1H and 13C nuclear magnetic resonance (NMR) spectroscopy, high-resolution mass spectrometry (HRMS) and elemental analyses (C, H and N).
1 mixture of ethoxyethanol and water under a nitrogen atmosphere. Immediately after that, aromatic boronic acid, potassium carbonate, and Pd(PPh3)4 were added with vigorous stirring at 130 °C for 30 minutes to get the compounds 3a, 3b, and 3c, with yields of 93%, 95%, and 92%, respectively. The peak of N–H in the phenothiazine unit appears at 8.906 ppm (3a), 8.847 ppm (3b), and 9.084 ppm (3c). The N-substituted phenothiazine derivative 3d was also successfully synthesized with an 86% yield (Scheme 1). The intermediate and the target molecules were characterized by 1H and 13C nuclear magnetic resonance (NMR) spectroscopy, high-resolution mass spectrometry (HRMS) and elemental analyses (C, H and N).
2.2. Photophysical properties
Phenothiazine derivatives are well-known as fluorophores and are widely used as conjugated components in luminescent organic materials.46 As compared to the photophysical and electrochemical properties of the N-substituted phenothiazine derivative 3d, the derivatives 3a, 3b, and 3c provided a clear-cut view of the characteristic properties. It was found that the absorption maxima of 3a, 3b, and 3c increased gradually, while their band gaps decreased. The phenothiazine derivative 3a, modified with thienyl moieties, showed the lowest-energy absorption peak and the major absorption band at 296 nm was assigned to the π–π* transitions of the aromatic rings and the absorption peaks at 363 nm was attributed to the stronger electron-donating character of the thiophene unit,47 while it showed maximum emission at 476 nm (Φ = 0.18, τ = 1.43 ns) (Fig. 1 and Table 1 and Fig. S2–S6, S12, ESI†). A similar phenomenon was also observed for 3b (λmax = 338 nm, λmax,em = 461 nm, Φ = 0.46, τ = 4.39 ns), which means extended directions of electron-donating moieties can affect the electron transfer process.48 Due to the growth of conjugated chains and the introduction of the electrophilic –CN units into the structures, the absorption spectrum of 3c showed maxima at 301 nm and 360 nm, and the emission spectra showed a local maximum at 510 nm (Φ = 0.40, τ = 4.38 ns), which indicated a slight bathochromic shift caused by electron transfer from the phenothiazine donor to the –CN acceptor compared to 3a and 3b.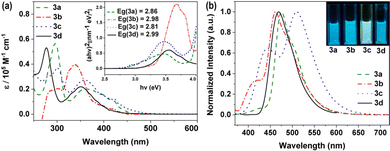 | ||
| Fig. 1 UV-Vis absorption spectra (left) and photoluminescence (PL) spectra (right) of the phenothiazine derivatives in THF solutions; the extrapolated optical band gaps (Eg) is shown as insets. | ||
| Comp. | λabsa (nm) | ε (105 M−1 cm−1) | λemb (nm) | SSc (cm−1) | τ (ns) | QYe (%) |
|---|---|---|---|---|---|---|
| a The longest λmax values in the UV-Vis spectra. b Emission maxima in THF. c Stokes shift = 1/λabs − 1/λem. d Lifetimes in THF. e Quantum yield in THF. | ||||||
| 3a | 363 | 0.27 | 476 | 6539 | 1.43 | 18 |
| 3b | 338 | 0.40 | 461 | 7894 | 4.39 | 46 |
| 3c | 360 | 0.20 | 510 | 8170 | 4.38 | 40 |
| 3d | 351 | 0.22 | 466 | 7031 | 5.64 | 37 |
2.3 Redox properties
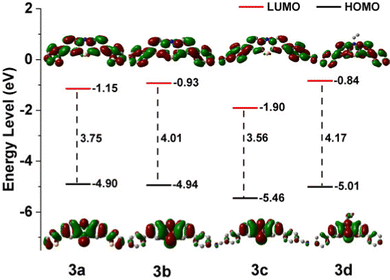
The electrochemical characteristics of the phenothiazine derivatives were studied by cyclic voltammetry (CV) in DMF solution (Fig. S7, ESI†). The results are summarized in Table S5, ESI.† These CV curves show that all the phenothiazine derivatives have a reversible one-electron reductions process, and the redox potentials of 3a, 3b, 3c and 3d were measured to be −1.15 (ELUMO = −3.65 eV), −1.08 (ELUMO = −3.72 eV), −1.16 (ELUMO = −3.64 eV), and −1.20 V (ELUMO = −3.60 eV) (vs. Fc/Fc+), respectively (Fig. 2 and Fig. S8–S11, ESI†). Therefore, substitution with moieties with different electron-donating abilities has very little effect on the reduction potential of the phenothiazine derivatives and the relatively low LUMO (lowest unoccupied molecular orbital) energy levels.28,49 However, mutual orthogonalization of the substituent groups indicates that the electrophilic –CN group is effective and even causes a shift of the anodic reduction potential of 3c. The highest occupied molecular orbital (HOMO) levels, as calculated from the LUMO levels and the optical band gaps (3a, 2.86 eV; 3b, 2.98 eV; 3c, 2.81 eV; 3d, 2.99 eV), were −6.51, −6.70, −6.45 and −6.59 eV, respectively, mimic the trend shown by the calculated values.2.4. Ratiometric fluoride-ion sensing properties
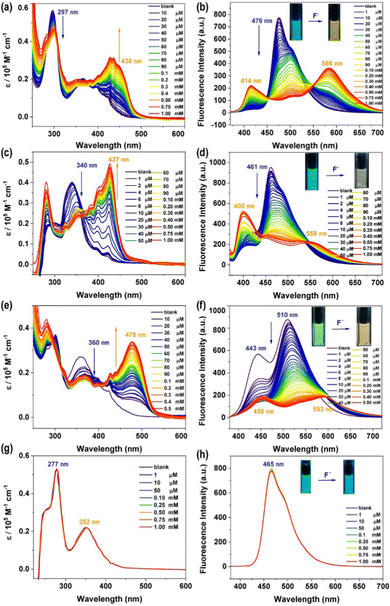
The combination of an anion acceptor with a chromogenic moiety is a convenient and efficient strategy for designing a colourimetric anion sensor, in which the targeted binding event is manifested as a colour change visible to the naked eye.50 Many specific photophysical behaviors of these compounds for binding F− ions were developed.35,51–53 Considering the existence of the N–H bond in the phenothiazine derivatives, we decided to investigate the response of these compounds to fluoride anions using UV-vis and fluorescence titration experiments, which were carried out using a solution of n-tetrabutylammonium fluoride (TBAF), which was added to the prepared solutions (10 μM) with a certain number of compounds every time. As shown in Fig. 3a, the titration of 3a with TBAF (1 mM in THF) resulted in a gradual decrease in the maximum absorption intensity at 297 nm, accompanied by the formation of a new absorption peak at 438 nm. In addition, upon excitation at 365 nm, the addition of F− ions cause a drastic decrease in emission at 476 nm and the simultaneous appearance of two new emission bands at 414 nm and 586 nm (Fig. 3b), which is manifested in the emission colour changing from blue to deep yellow after titration. This may be due to the PTZ derivative 3a undergoing hydrogen bond formation and the subsequent deprotonation of the N–H.54,55 Compounds 3b and 3c also exhibited almost identical titration behaviour (Fig. 3c–f). The UV-vis spectra of 3b (λmax = 340 nm) and 3c (λmax = 360 nm) showed a gradual decrease in the absorption intensity at 340 nm and 360 nm respectively and the emergence of a new absorption peak in each spectrum at 427 nm and 478 nm, which further intensified on binding of F−. A similar phenomenon was observed in the fluorescence spectra, where the emissions of 3b (λem = 461 nm) and 3c (λem = 510 nm) gradually decreased with the addition of F−, and two new emission bands appeared in each spectrum (3b: λem = 400 and 558 nm, 3c: λem = 450 and 593 nm) that steadily grew with the addition of more F− solution due to mono-deprotonation processeS.56 The behavior of the N-substituted phenothiazine derivative 3d, as characterized by UV-vis and fluorescence titration experiments, was significantly different from that of 3a, 3b, and 3c after the addition of fluoride ions (Fig. 3g and f). The absorption and emission bands of 3d showed almost no change even at a F− concentration of 1 mM. This remarkable difference between the phenothiazine derivatives and the N-substituted phenothiazine derivative implies the existence of a strong ground state F⋯H–N interaction for the PTZ derivatives 3a, 3b, and 3c, which was confirmed through DFT calculations (Fig. S13, ESI†). To better understand the origin of the observed response of N–H to fluoride ions, corresponding experiments were performed on 3a as a molecular model system. Upon addition of different equivalents of TBAF to compound 3a, the N–H signal in the phenothiazine unit that appeared at 8.906 ppm gradually decreased, indicating the formation of a 3a–F complex (Fig. S14, ESI†). These results also mean that an instantaneous colour change from blue to yellow occurs, an event that allows visible, naked eye detection of fluoride. The as-calculated detection limits (DL), based on three times the standard deviation regulation,57 were 31.7 μM, 41.6 μM, and 48.5 μM, respectively (Fig. S15–S19, ESI†).The anion sensing properties of the selectivity of the phenothiazine derivatives were assessed by the simultaneous addition of a certain amount of different anions such as F−, Cl−, Br−, I−, NO3−, ClO4−, BF4−, PF6−, AcO−, H2PO4−, and SO42−. Histograms of (I0/I)-1 plotted against concentrations of F− and other anions (Fig. 4 and Fig. S21, S22, ESI†) showed that the fluorescence spectra of 3a showed distinct changes both in intensity and emission wavelength upon the addition of fluoride anions, while other anions did not have any significant effect, except for some slight interference due to AcO−. Similarly, due to the differences in the basicity and the ability of the aforementioned anions to form hydrogen bonds, 3b and 3c showed a highly selective response to the fluoride anions (apart from a marginal response to AcO− anions). This anion-specific behaviour shows that the phenothiazine derivatives 3a, 3b, and 3c can be used as highly selective colourimetric sensors for the detection of fluoride.
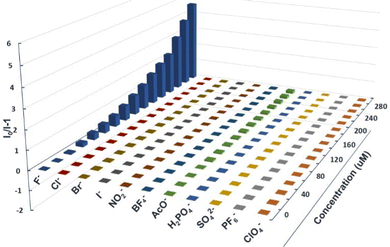 | ||
| Fig. 4 (I0/I)-1 of 11 anions for the emission of 3a in THF (10 μM in THF) at different equivalents of anions. | ||
A fluoride-sensing film (Fig. 5) was fabricated from a solution of 3a and polycaprolactone (PCL) (weight ratio: 1/400) in THF. While this film showed blue-green luminescence visible to the naked eye under ultraviolet irradiation (λex = 365 nm), on exposure to a fluoride solution, a yellow luminescence was observed and the detection limit was 0.1 mM (Fig. S20, ESI†). This demonstrated the excellent potential of 3a for optoelectronic applications as solid-state fluoride ion sensors.
2.5 Fabrication of electrochromic devices (ECDs) and spectroelectrochemical properties
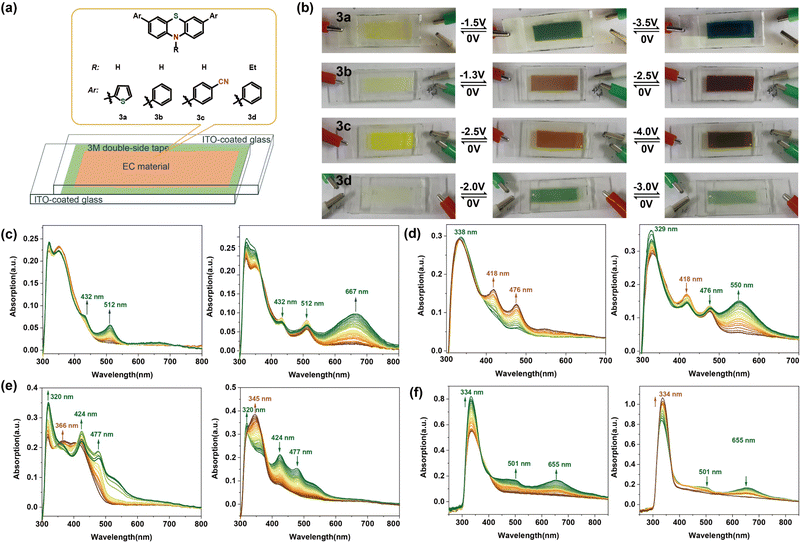
Some proof-of-concept electrochromic devices were fabricated to explore the application of these phenothiazine derivatives. To facilitate the observation of the colour changes and electrochromic behaviour of these new electrochromic composites, fluorine-doped tin oxide (ITO)-coated glasses,58–60 because of the good light transmission and electrical conductivity, were used as electrodes, and 3a/3b/3c/3d were used as the active components. Fig. 6 shows the observed colour changes and the spectroelectrochemical data of the devices based on these phenothiazine derivatives in DMF solution at different voltages. A direct current instrument was attached to this electrochromic device, and when the voltage was set between 0 V and −3.5 V, as shown in Fig. 6b, a yellow colouration was observed in the neutral state, with the UV-vis absorption maxima below 400 nm without an applied potential. On gradually increasing the potential from 0 V to −1.5 V, a colour change from yellow to green could be observed, with an increase in the intensities of the absorption bands at 432 and 512 nm. The new species are thought to be the radical cations produced in the electrochemical oxidation process.61 A deep teal color was observed and the UV-vis absorption peak at 667 nm further intensified as the potential was changed from −1.5 to −3.5 V. A further decrease in the UV-vis absorption intensity was seen with a further increase in the potential over −3.5 V (Fig. 6c). The ECD containing 3b appears light yellow (its original colour) at 0 V. When the applied voltage is changed from 0 to −1.3 V, the absorption intensities around the wavelength bands of 418 nm and 476 nm increased due to the formation of the new radical species, and the device colour changed to brown. Moreover, when the potential was further changed from −1.3 to −2.5 V, the absorption intensity for wavelengths around 550 nm increased to some extent, and the colour of the ECD changed to dark brown (Fig. 6d). We observed that whenever the application of the voltage was stopped, the colour recovered to the original light yellow accompanied by absorption intensities at 418 nm, 476 nm and 550 nm decreasing to those seen originally. This demonstrated good, reversible electrochromic switching capability (Fig. S24, ESI†). The changes in colour and absorption intensity of 3c in the visible range of wavelengths were similar (Fig. 6e). This shows that the phenothiazine derivatives could function as electrochromic devices switching between two colours. The original ECD containing 3d, which was nearly colourless at 0 V, turned green when the applied voltage was changed to −2.0 V with an increase in the absorption intensity around the wavelengths of 501 nm and 655 nm. However, on further increasing the potential to −3 V, the intensity of the green colour decreased (due to a decrease in absorption intensity). The proposed mechanism for the electrochromism of 3a can be described in Fig. S23 (ESI†). The colour changes of 3a can be attributed to the different oxidation states, which were confirmed through DFT calculations. Moreover, the ECDs fabricated from 3a, 3b, and 3c continued to show reversible colour changes even after 30 cycles, while, the performance of the ECD of 3d declined significantly after several cycles (Fig. S24, ESI†).3. Conclusions
In summary, a novel phenothiazine derivative material with N–H has been synthesized and characterized. The results showed that the PTZ derivatives 3a, 3b, and 3c showed good stability and bright, intense fluorescence, which made them suitable for the colourimetric detection of fluoride ions among the common interferents, manifesting as a change in the fluorescence intensity and colour (from blue to yellow). In contrast, the N-substituted phenothiazine derivative (3d) did not show any conspicuous change in fluorescent emissions even after increasing the F− concentration to 1 mM, which implied the existence of a strong ground state F⋯H–N interaction for 3a, 3b, and 3c. With multiple redox centers and light absorption in the visible region, the proof-of-concept of solution-based ECDs were demonstrated successfully. The integration of two kinds of applications of the phenothiazine derivative would provide an effective strategy for developing applications of multi-stimuli-responsive materials. We are continuing further research and development on the detection of fluoride anions in aqueous media, enhancing their electrochromic performance, and increasing their potential applications.4. Experimental
General
All commercially available chemicals were used without further purification unless otherwise noted. THF was distilled from sodium/benzophenone prior to use. Ethoxyethanol, tetrakis(triphenylphosphine) palladium (Pd(Ph3P)4) (99%), potassium carbonate (99%), thiophene-2-boronic acid (99%), phenylboronic acid (99%), 4-cyanophenyl)boronic acid (99%) and bromoethane (99%) were purchased from Energy Chemical Inc. 3,7-Dibromo-10H-phenothiazine (2) was prepared according to the literature procedures.62NMR spectra were measured on a Bruker Avance-600 spectrometer in the solvents indicated; chemical shifts are reported in units (ppm) by assigning the TMS resonance in the 1H spectrum as 7.26 ppm, and the CDCl3 resonance in the 13C spectrum as 77.0 ppm. Coupling constants are reported in Hz with multiplicities denoted as s (singlet), d (doublet), t (triplet), q (quartet) and m (multiplet). UV-vis measurements were performed using a DH-2000-BAL scan spectrophotometer. Fluorescence measurements were conducted on a FLS920 system. The cyclic voltammetry (CV) spectra were measured using a Metrohm PGSTAT204 set up.
All the computational calculations reported in this work were performed using the Gaussian 09 code. The geometries for the ground state of these compounds were optimized at the B3LYP[3,4]-D3 hybrid functional, and the 6-311G(d,p) basis set for 3a, 3b, 3c, and 3d, and the 6-311+G(d,p) basis set for 3a–F.
Synthetic procedures
![[thin space (1/6-em)]](https://www.rsc.org/images/entities/char_2009.gif) :
:![[thin space (1/6-em)]](https://www.rsc.org/images/entities/char_2009.gif) 1, 110 mL). To the resulting green solution, a finely ground mixture of arylboronic acid (28.0 mmol, 2.80 equiv.), K2CO3 (7.73 g, 56.0 mmol, 5.60 equiv.) and Pd(PPh3)4 (200 mg, 0.17 mmol, 1.73 mol%) was added immediately under vigorous stirring. The reaction mixture was kept under reflux conditions at 130 °C for 30 minutes and then was allowed to cool to room temperature. The product precipitated during cooling. The suspension was diluted with deionized water (100 mL) to increase precipitation. The crude product was filtered over a Büchner funnel, washed with ethanol and cold acetone (3 × 30 mL each) and air dried to give compounds 3a–c.
1, 110 mL). To the resulting green solution, a finely ground mixture of arylboronic acid (28.0 mmol, 2.80 equiv.), K2CO3 (7.73 g, 56.0 mmol, 5.60 equiv.) and Pd(PPh3)4 (200 mg, 0.17 mmol, 1.73 mol%) was added immediately under vigorous stirring. The reaction mixture was kept under reflux conditions at 130 °C for 30 minutes and then was allowed to cool to room temperature. The product precipitated during cooling. The suspension was diluted with deionized water (100 mL) to increase precipitation. The crude product was filtered over a Büchner funnel, washed with ethanol and cold acetone (3 × 30 mL each) and air dried to give compounds 3a–c.
Preparation of the film
Polycaprolactone (PCL) (4 g) was dissolved in 10 mL THF in a round bottom flask at 40 °C. After the solid was completely dissolved, compound 3a (10 mg) was added dropwise at 40 °C, and was stirred for another 6 h. Then the solution above was further cast on a pre-cleaned glass substrate to fabricate the sensor films.Fabrication of the electrochromic devices (ECDs)
The original ITO glasses were 100 × 100 × 1.1 mm and the resistance was 10 Ω. A glass cutter was used to cut the original ITO glasses for different types of ECDs. Two ITO-coated glasses (5 cm × 2 cm) were bent with 3 M double-side tapes (width: 4 mm, thickness: 0.5 mm) and a cavity formed between them. Compounds 3a–3d were dissolved in DMF solution, c ∼ 5 × 10⁻³ M, with ethyl-3-methylimidazolium bis(trifluoromethylsulfonyl) act as the supporting electrolyte. The solution was injected into the cavity by a syringe, then a UV-cured gasket was used to seal the cavity further.Conflicts of interest
There are no conflicts to declare.Acknowledgements
We gratefully acknowledge financial support from the Natural Science Foundation of China (Grants No. 22265027), the Project of Qinghai Science & Technology Department (Grant No. 2021-ZJ-979Q) and the Open Fund of Guangdong Provincial Key Laboratory of Luminescence from Molecular Aggregates (No. 2019B030301003), Guangzhou 510640, China (South China University of Technology).Notes and references
- T. Hisatomi, J. Kubota and K. Domen, Chem. Soc. Rev., 2014, 43, 7520–7535 RSC.
- J. Hou, O. Inganas, R. H. Friend and F. Gao, Nat. Mater., 2018, 17, 119–128 CrossRef CAS PubMed.
- A. K. Jena, A. Kulkarni and T. Miyasaka, Chem. Rev., 2019, 119, 3036–3103 CrossRef CAS PubMed.
- S. Yuan, L. Feng, K. Wang, J. Pang, M. Bosch, C. Lollar, Y. Sun, J. Qin, X. Yang, P. Zhang, Q. Wang, L. Zou, Y. Zhang, L. Zhang, Y. Fang, J. Li and H.-C. Zhou, Adv. Mater., 2018, 30, 1704303 CrossRef PubMed.
- C. He, X. Zhuang, Z. Tang, H. Tian and X. Chen, Adv. Healthcare Mater., 2012, 1, 48–78 CrossRef CAS PubMed.
- T. Urbanek, E. Jaeger, A. Jaeger and M. Hruby, Polymers, 2019, 11, 1061–1082 CrossRef CAS PubMed.
- A. Beck, F. Obst, D. Gruner, A. Voigt, P. J. Mehner, S. Gruenzner, R. Koerbitz, M. H. Shahadha, A. Kutscher, G. Paschew, U. Marschner and A. Richter, Adv. Mater. Technol., 2022, 2200417 CrossRef.
- Y.-S. Lim, J. S. Kim, J. H. Choi, J. M. Kim and T. S. Shim, Colloid Interface Sci. Commun., 2022, 48, 100624 CrossRef CAS.
- B. Meng, Y. Zhang and P.-C. Ma, Macromol. Chem. Phys., 2020, 221, 1900552 CrossRef CAS.
- S. Topp, V. Prasad, G. C. Cianci, E. R. Weeks and J. P. Gallivan, J. Am. Chem. Soc., 2006, 128, 13994–13995 CrossRef CAS PubMed.
- K. R. Raghupathi, J. Guo, O. Munkhbat, P. Rangadurai and S. Thayumanavan, Acc. Chem. Res., 2014, 47, 2200–2211 CrossRef CAS PubMed.
- C. Gu, A.-B. Jia, Y.-M. Zhang and S. X.-A. Zhang, Chem. Rev., 2022, 122, 14679–14721 CrossRef CAS PubMed.
- S.-L. Li, M. Han, Y. Zhang, G.-P. Li, M. Li, G. He and X.-M. Zhang, J. Am. Chem. Soc., 2019, 141, 12663–12672 CrossRef CAS PubMed.
- P. Murto and H. Bronstein, J. Mater. Chem. C, 2022, 10, 7368–7403 RSC.
- Z.-M. Chen, X.-M. Zhang and Y.-Q. Tu, Chem. Soc. Rev., 2015, 44, 5220–5245 RSC.
- L. Ji, J. Shi, J. Wei, T. Yu and W. Huang, Adv. Mater., 2020, 32, 1908015 CrossRef CAS PubMed.
- I. J. Al-Busaidi, A. Haque, N. K. Al Rasbi and M. S. Khan, Synth. Met., 2019, 257, 116189 CrossRef CAS.
- J. Yang, X. Zhen, B. Wang, X. Gao, Z. Ren, J. Wang, Y. Xie, J. Li, Q. Peng, K. Pu and Z. Li, Nat. Commun., 2018, 9, 2963–2973 CrossRef PubMed.
- B. Wu, Y. Liu, Y. Zhang, L. Fan, Q.-Y. Li, Z. Yu, X. Zhao, Y.-C. Zheng and X.-J. Wang, J. Mater. Chem. A, 2022, 10, 12489–12496 RSC.
- Y. Rout, A. Ekbote and R. Misra, J. Mater. Chem. C, 2021, 9, 7508–7531 RSC.
- X. Pan, C. Fang, M. Fantin, N. Malhotra, W. Y. So, L. A. Peteanu, A. A. Isse, A. Gennaro, P. Liu and K. Matyjaszewskit, J. Am. Chem. Soc., 2016, 138, 2411–2425 CrossRef CAS PubMed.
- Z. Xie, C. Chen, S. Xu, J. Li, Y. Zhang, S. Liu, J. Xu and Z. Chi, Angew. Chem., Int. Ed., 2015, 54, 7181–7184 CrossRef CAS PubMed.
- S. Revoju, A. Matuhina, L. Canil, H. Salonen, A. Hiltunen, A. Abate and P. Vivo, J. Mater. Chem. C, 2020, 8, 15486–15506 RSC.
- M. Zhai, Y. Miao, H. Wang, L. Wang, X. Ding, C. Chen and M. Cheng, Dyes Pigm., 2022, 202, 110279 CrossRef CAS.
- M. Okazaki, Y. Takeda, P. Data, P. Pander, H. Higginbotham, A. P. Monkman and S. Minakata, Chem. Sci., 2017, 8, 2677–2686 RSC.
- J. K. Salunke, F. L. Wong, K. Feron, S. Manzhos, M. F. Lo, D. Shinde, A. Patil, C. S. Lee, V. A. L. Roy, P. Sonar and P. P. Wadgaonkar, J. Mater. Chem. C, 2016, 4, 1009–1018 RSC.
- K. M. Vengaian, C. D. Britto, K. Sekar, G. Sivaraman and S. Singaravadivel, Sens. Actuators, B, 2016, 235, 232–240 CrossRef CAS.
- Y. Yoon, S. Shin and M. W. Shin, ACS Appl. Mater. Interfaces, 2022, 14, 4220–4229 CrossRef CAS PubMed.
- M. Garcia-Iglesias, K. Peuntinger, A. Kahnt, J. Krausmann, P. Vazquez, D. Gonzalez-Rodriguez, D. M. Guldi and T. Torres, J. Am. Chem. Soc., 2013, 135, 19311–19318 CrossRef CAS PubMed.
- A. Jimenez-Almarza, A. Lopez-Magano, R. Mas-Balleste and J. Aleman, ACS Appl. Mater. Interfaces, 2022, 14, 16258–16268 CrossRef CAS PubMed.
- S. Jagtap, M. K. Yenkie, N. Labhsetwar and S. Rayalus, Chem. Rev., 2012, 112, 2454–2466 CrossRef CAS PubMed.
- U. Manna, G. Das and M. A. Hossain, Coord. Chem. Rev., 2022, 455, 214357 CrossRef CAS.
- P. P. Hujoel, Nutrients, 2022, 14, 4263–4295 CrossRef CAS PubMed.
- V. Amendola, G. Bergamaschi, M. Boiocchi, L. Fabbrizzi and M. Milani, Chem. – Eur. J., 2010, 16, 4368–4380 CrossRef CAS PubMed.
- Y. Zhou, J. F. Zhang and J. Yoon, Chem. Rev., 2014, 114, 5511–5571 CrossRef CAS PubMed.
- V. S. Padalkar and S. Seki, Chem. Soc. Rev., 2016, 45, 169–202 RSC.
- W. Wu, M. Wang, J. M. Ma, Y. L. Cao and Y. H. Deng, Adv. Electron. Mater., 2018, 4, 1800185 CrossRef.
- S. H. Yan, K. P. Abhilash, L. Y. Tang, M. Yang, Y. F. Ma, Q. Y. Xia, Q. B. Guo and H. Xia, Small, 2019, 15, 1804371 Search PubMed.
- Y. Wang, X. Jia, E. B. Berda, J. Zhao, X. Liu and D. Chao, Eur. Polym. J., 2020, 138, 109979 CrossRef CAS.
- D. P. Dubal, N. R. Chodankar, D.-H. Kim and P. Gomez-Romero, Chem. Soc. Rev., 2018, 47, 2065–2129 RSC.
- H. Sun, S. Liu, W. Lin, K. Y. Zhang, W. Lv, X. Huang, F. Huo, H. Yang, G. Jenkins, Q. Zhao and W. Huang, Nat. Commun., 2014, 5, 3601–3610 CrossRef PubMed.
- V. K. Thakur, G. Ding, J. Ma, P. S. Lee and X. Lu, Adv. Mater., 2012, 24, 4071–4096 CrossRef CAS PubMed.
- L. Striepe and T. Baumgartner, Chem. – Eur. J., 2017, 23, 16924–16940 CrossRef CAS PubMed.
- G. He, G. Li, L. Xu, W. Zhang, K. Zhou, Y. Ding, F. Liu and X. He, Angew. Chem., Int. Ed., 2018, 57, 4897–4901 CrossRef PubMed.
- X.-Q. Zhu, Z. Dai, A. Yu, S. Wu and J.-P. Cheng, J. Phys. Chem. B, 2008, 112, 11694–11707 CrossRef CAS PubMed.
- A. F. Buene and D. M. Almenningen, J. Mater. Chem. C, 2021, 9, 11974–11994 RSC.
- Z. Liu, E. Shi, Y. Wan, N. Li, D. Chen, Q. Xu, H. Li, J. Lu, K. Zhang and L. Wang, J. Mater. Chem. C, 2015, 3, 2033–2039 RSC.
- S. M. Sartor, C. H. Chrisman, R. M. Pearson, G. M. Miyake and N. H. Damrauer, J. Phys. Chem. A, 2020, 124, 817–823 CrossRef CAS PubMed.
- Z. Li, Q. Dong, Y. Li, B. Xu, M. Deng, J. Pei, J. Zhang, F. Chen, S. Wen, Y. Gao and W. Tian, J. Mater. Chem., 2011, 21, 2159–2168 RSC.
- W. P. Lustig, S. Mukherjee, N. D. Rudd, A. V. Desai, J. Li and S. K. Ghosh, Chem. Soc. Rev., 2017, 46, 3242–3285 RSC.
- L. Ji, S. Griesbeck and T. B. Marder, Chem. Sci., 2017, 8, 846–863 RSC.
- W.-D. Zhang, G. Li, L. Xu, Y. Zhuo, W.-M. Wan, N. Yan and G. He, Chem. Sci., 2018, 9, 4444–4450 RSC.
- S. Zhang, X. Yang, X. Liu, L. Xu, B. Rao, N. Yan and G. He, J. Mater. Chem. C, 2021, 9, 4053–4061 RSC.
- M. Boiocchi, L. Del Boca, D. E. Gomez, L. Fabbrizzi, M. Licchelli and E. Monzani, J. Am. Chem. Soc., 2004, 126, 16507–16514 CrossRef CAS PubMed.
- C. Bhaumik, S. Das, D. Maity and S. Baitalik, Dalton Trans., 2011, 40, 11795–11808 RSC.
- T. Kundu, A. D. Chowdhury, D. De, S. M. Mobin, V. G. Puranik, A. Datta and G. K. Lahiri, Dalton Trans., 2012, 41, 4484–4496 RSC.
- X. Sun, Y. Qi, H. Liu, J. Peng, K. Liu and Y. Fang, ACS Appl. Mater. Interfaces, 2014, 6, 20016–20024 CrossRef CAS PubMed.
- N. Yan, W. Zhang, G. Li, S. Zhang, X. Yang, K. Zhou, D. Pei, Z. Zhao and G. He, Mater. Chem. Front., 2021, 5, 4128–4137 RSC.
- R. Song, G. Li, Y. Zhang, B. Rao, S. Xiong and G. He, Chem. Eng. J., 2021, 422, 130057 CrossRef CAS.
- S. Zhang, L. Ma, W. Ma, L. Chen, K. Gao, S. Yu, M. Zhang, L. Zhang and G. He, Angew. Chem., Int. Ed., 2022, 61, e202209054 CAS.
- S. Zhuang, X. Li and J. Liu, Dyes Pigm., 2021, 193, 109464 CrossRef CAS.
- A. F. Buene, N. Uggerud, S. P. Economopoulos, O. R. Gautun and B. H. Hoff, Dyes Pigm., 2018, 151, 263–271 CrossRef CAS.
Footnote |
| † Electronic supplementary information (ESI) available: Experimental details, NMR spectra for all the new compounds, cyclic voltammogram data and results of theoretical calculations. See DOI: https://doi.org/10.1039/d2tc04079d |
| This journal is © The Royal Society of Chemistry 2023 |

