 Open Access Article
Creative Commons Attribution 3.0 Unported Licence
Heterobimetallic conducting polymers based on salophen complexes via electrosynthesis†
Francesca
Bia
 a,
Isacco
Gualandi
 *b,
Jan
Griebel
 c,
Leon
Rasmussen
 d,
Bassam
Hallak
d,
Domenica
Tonelli
d,
Bassam
Hallak
d,
Domenica
Tonelli
 b and
Berthold
Kersting
 *a
*a
aInstitut für Anorganische Chemie, Universität Leipzig, Johannisallee 29, 04103 Leipzig, Germany. E-mail: b.kersting@uni-leipzig.de
bDipartimento di Chimica Industriale “Toso Montanari”, Università di Bologna, Viale Risorgimento 4, 40136 Bologna, Italy. E-mail: isacco.gualandi2@unibo.it
cLeibniz Institute of Surface Engineering (IOM), Permoserstraße 15, 04318 Leipzig, Germany
dInstitut für Technische Chemie, Linnéstraße 3, 04103 Leipzig, Germany
First published on 26th January 2023
Abstract
In this work, we report the first electrochemical synthesis of two copolymeric bimetallic conducting polymers by a simple anodic electropolymerization method. The adopted precursors are electroactive transition metal (M = Ni, Cu and Fe) salophen complexes, which can be easily obtained by direct chemical synthesis. The resulting films, labeled poly-NiCu and poly-CuFe, were characterized by cyclic voltammetry in both organic and aqueous media, attenuated total reflectance Fourier transform infrared spectroscopy, UV-vis spectroscopy, scanning electron microscopy, and coupled energy dispersive X-ray spectroscopy. The films are conductive and exhibit great electrochemical stability in both organic and aqueous media (resistant over 100 cycles without significant loss in current response or changes in electrochemical behavior), which makes them good candidates for an array of potential applications. Electrochemical detection of ascorbic acid was performed using both materials.
Introduction
Schiff base (SB) ligands were first synthesized by the German chemist Hugo Schiff in 1864.1 They have been widely employed in coordination chemistry to synthesize a huge variety of transition metal complexes due to their imine functionality and more broadly by their ease of synthesis, high degree of tunability and general versatility. Such complexes have been over time investigated and applied in several fields, such as catalysis,2 medicine,3 sensing4 and materials science.5,6 It is also well known that SB complexes can undergo polymerization, both chemically and electrochemically,7 forming metal-containing polymers.8 Electropolymerization provides some advantages as a method of synthesis since it is less time-consuming than traditional chemical polymerization, enables easy control of film thickness while it is building up on the electrode surface and ensures good adhesion of the film to the substrate.8 Salen and salophen complexes, a distinguished class of SB complexes known for their potentially tetradentate N2O2 coordination pocket, have often been the subject of electropolymerization studies, starting from Goldsby's work in 1989.9–12 In later studies, electrochemical polymerization of such complexes was carried out to achieve the modification of electrode surfaces and to investigate their performance as electrocatalysts,13,14 sensors,15 supercapacitors16 and even as cathode materials for batteries.17 In particular, the interest in heterometallic catalysts – especially based on abundant metals – continues to grow18 thanks to the combined activity of different metal centers and the improved catalytic performance, as well as the importance of intrinsically conducting polymers (ICPs).19 We decided to investigate the feasibility of electrochemical synthesis of copolymers made out of two metal complexes derived from a single salophen-type ligand, thereby providing an extended π framework, a feature of all ICPs. In this paper, we report the potentiodynamic deposition of two heterobimetallic polymers, resulting from the combination of either the NiII and CuII or the CuII and FeIII complexes of (3-OMe)salophen, a derivative of the standard salophen ligand (Scheme 1). The decision to place a methoxy group in the 3 position of the ligand was motivated by the possibility to create an extra coordination pocket and by further electronic reasons: the methoxy function has an electron-donating effect which lowers the redox-potential of the salicylidene moiety and also induces and spurs charge transfer. All the films were characterized by means of cyclic voltammetry (CV), attenuated total reflectance Fourier transform infrared spectroscopy (ATR-FTIR), UV-visible spectroscopy (UV-Vis), scanning electron microscopy (SEM) and energy dispersive X-ray spectroscopy (EDX). Finally, we decided to test the materials for the electrooxidation of ascorbic acid (AA), a key analyte in biochemistry and highly relevant in industrial applications, in order to investigate the possibility of developing a sensor for this compound. To the best of our knowledge, this is the first research ever carried out on such a matter.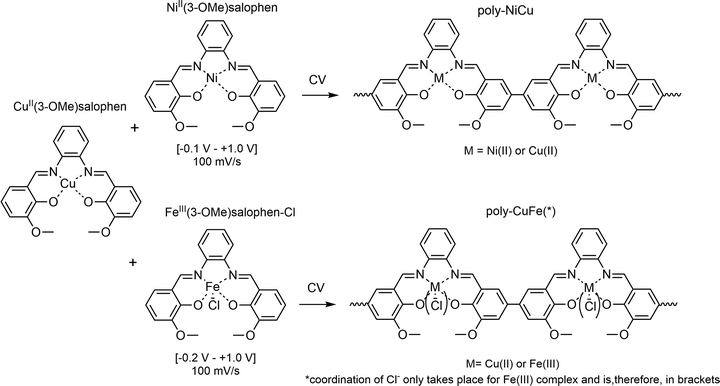 | ||
| Scheme 1 Electrochemical synthesis of the heterobimetallic polymers starting from the salophen complexes. | ||
Experimental
Materials and apparatus
1,2-Phenylendiamine (Merck), 2-hydroxy-3-methoxy-benzaldehyde (99%, Alfa Aesar), Ni(II) acetate tetrahydrate (98%, Sigma-Aldrich), Cu(II) acetate monohydrate (technical grade), Fe(III) chloride hexahydrate (97%, Fluka), triethylamine (99%, Sigma-Aldrich), absolute ethanol and methanol (spectroscopic grade, ChemSolute) were employed for synthesis and used directly without any special treatment. Dimethylformamide (DMF, VWR Chemicals) for UV-Visible analysis was of spectroscopic grade. Acetonitrile (MeCN, spectroscopic grade, VWR Chemicals) for electrochemistry was dried on 3 Å molecular sieves and stored under nitrogen. Tetrabutylammonium hexafluorophosphate (TBAHFP, 98%, TCI), lithium perchlorate trihydrate (99%, Acros Organics) and sodium dihydrogen phosphate dihydrate (99%, Alfa Aesar) were used as supporting electrolytes in the electrochemical experiments without further purification.All electrochemical experiments and measurements were carried out in a standard three-electrode cell, consisting of glassy carbon (GC) as the working electrode (3 mm diameter) and a platinum wire as the counter electrode. The choice of the reference electrode was solvent-dependent: in organic media, an Ag+/Ag couple electrode was employed (Ag wire inserted in a 0.01 M AgNO3 and 0.1 M TBAHFP/MeCN solution), while a saturated calomel electrode (SCE) was used in aqueous solutions. The concentration of supporting electrolyte solutions was 0.1 M. For characterization in acidic and basic aqueous solutions, no extra supporting electrolyte was employed in addition to the chosen acid or base. For sensing measurements, a buffered phosphate solution (pH = 7.35) was used as a supporting electrolyte. The ferrocene signal was always checked before each electrosynthesis experiment and the ohmic drop in the solution was compensated in each measurement. Electrodes and the materials for their cleaning, such as 1 μm diamond paste and 0.05 μm alumina and glass cells, were purchased from ALS Japan. All experiments were performed with an SP-150 BioLogic potentiostat at room temperature after purging the solutions for 15 minutes with nitrogen. GC electrodes employed for modification and subsequent spectroscopic analysis (2 mm diameter) were homemade, fabricated from a GC rod (Metrohm) and covered by an insulating layer made from Teflon.
The morphology of the films and their chemical composition were investigated by SEM-EDX with a Nova NanoLab 200 Dual Beam microscope by FEI, equipped with a Bruker XFlash 6/10 detector. SEM pictures were taken with a voltage of 10 kV. ATR measurements of films were performed with Bruker Tensor II and Bruker Vector 80V spectrometers. UV-Vis spectra were collected on a Jasco V-670 spectrophotometer using 1 cm quartz cells.
The complexes were characterized by an array of techniques. 1H-NMR spectra were recorded with a Bruker Avance III HD 400 instrument. Mass spectra were obtained by electrospray ionization in positive mode (ESI+) on an Impact II Bruker Daltonics mass spectrometer. Infrared spectroscopy was performed on pellet samples formulated with KBr using a Bruker Tensor 27 spectrometer. UV-Vis spectra were recorded with the same spectrometer and equipment as stated before. Elemental analyses were performed on a Vario EL elemental analyzer.
Syntheses
![[small nu, Greek, tilde]](https://www.rsc.org/images/entities/char_e0e1.gif) [cm−1] = 3491–3270 (OH), 2954–2836w (w, C–H), 1612 (s, C
[cm−1] = 3491–3270 (OH), 2954–2836w (w, C–H), 1612 (s, C![[double bond, length as m-dash]](https://www.rsc.org/images/entities/char_e001.gif) N), 1585, 1571 (m, C
N), 1585, 1571 (m, C![[double bond, length as m-dash]](https://www.rsc.org/images/entities/char_e001.gif) C) 1469 (s, Csp3–H), 1432–1385 (m, CH3) 1354 (m, Csp2–N) 1254 (s, Csp2–O), 1069 (s, Csp3–O), 781 (m,
C) 1469 (s, Csp3–H), 1432–1385 (m, CH3) 1354 (m, Csp2–N) 1254 (s, Csp2–O), 1069 (s, Csp3–O), 781 (m, ![[double bond, length as m-dash]](https://www.rsc.org/images/entities/char_e001.gif) C–H), 742 (s,
C–H), 742 (s, ![[double bond, length as m-dash]](https://www.rsc.org/images/entities/char_e001.gif) C–H). UV-Vis (MeCN): λmax [nm] (ε [L mol−1 cm−1]) = 228 (38
C–H). UV-Vis (MeCN): λmax [nm] (ε [L mol−1 cm−1]) = 228 (38![[thin space (1/6-em)]](https://www.rsc.org/images/entities/char_2009.gif) 079, π–π*), 280 (27
079, π–π*), 280 (27![[thin space (1/6-em)]](https://www.rsc.org/images/entities/char_2009.gif) 496, π–π*), 330 (20523, n–π*). Elemental analysis calculated for C22H20N2O4: C, 70.20; H, 5.36; N, 7.44. Found: C, 70.30; H 4.89; N, 7.63.
496, π–π*), 330 (20523, n–π*). Elemental analysis calculated for C22H20N2O4: C, 70.20; H, 5.36; N, 7.44. Found: C, 70.30; H 4.89; N, 7.63.
![[small nu, Greek, tilde]](https://www.rsc.org/images/entities/char_e0e1.gif) [cm−1] = 3458–3396 (w, hydrogen bonds), 2954–2836w (w, C–H), 1610 (s, C
[cm−1] = 3458–3396 (w, hydrogen bonds), 2954–2836w (w, C–H), 1610 (s, C![[double bond, length as m-dash]](https://www.rsc.org/images/entities/char_e001.gif) N), 1581(s, C
N), 1581(s, C![[double bond, length as m-dash]](https://www.rsc.org/images/entities/char_e001.gif) C), 1544 (s, C
C), 1544 (s, C![[double bond, length as m-dash]](https://www.rsc.org/images/entities/char_e001.gif) C), 1467 (s, C–H), 1340 (w, Csp2–N), 1248 (s, Csp2–O), 1108m (s, Csp3–O), 734 (s,
C), 1467 (s, C–H), 1340 (w, Csp2–N), 1248 (s, Csp2–O), 1108m (s, Csp3–O), 734 (s, ![[double bond, length as m-dash]](https://www.rsc.org/images/entities/char_e001.gif) C–H), 531 (w, Ni–N), 468 (w, Ni–O). UV-Vis (CH3CN): λmax [nm] (ε [L mol−1 cm−1]) = 256 (45
C–H), 531 (w, Ni–N), 468 (w, Ni–O). UV-Vis (CH3CN): λmax [nm] (ε [L mol−1 cm−1]) = 256 (45![[thin space (1/6-em)]](https://www.rsc.org/images/entities/char_2009.gif) 884, π–π*), 297 (19
884, π–π*), 297 (19![[thin space (1/6-em)]](https://www.rsc.org/images/entities/char_2009.gif) 816, π–π*), 377 (25
816, π–π*), 377 (25![[thin space (1/6-em)]](https://www.rsc.org/images/entities/char_2009.gif) 204, n–π*), 488 (7024, LMCT). Elemental analysis calculated for C22H18NiN2O4 × H2O: C, 58.58; H, 4.47; N, 6.21. Found: C, 58.38; H 4.30; N, 6.38.
204, n–π*), 488 (7024, LMCT). Elemental analysis calculated for C22H18NiN2O4 × H2O: C, 58.58; H, 4.47; N, 6.21. Found: C, 58.38; H 4.30; N, 6.38.
![[small nu, Greek, tilde]](https://www.rsc.org/images/entities/char_e0e1.gif) [cm−1] = 3504–3270 (w, hydrogen bonds), 2954–2836w (w, C–H), 1609 (s, C
[cm−1] = 3504–3270 (w, hydrogen bonds), 2954–2836w (w, C–H), 1609 (s, C![[double bond, length as m-dash]](https://www.rsc.org/images/entities/char_e001.gif) N), 1581(s, C
N), 1581(s, C![[double bond, length as m-dash]](https://www.rsc.org/images/entities/char_e001.gif) C), 1542 (s, C
C), 1542 (s, C![[double bond, length as m-dash]](https://www.rsc.org/images/entities/char_e001.gif) C), 1467 (s, C–H), 1331 (w, Csp2–N), 1242 (s, Csp2–O), 1108m (s, Csp3–O), 733 (s,
C), 1467 (s, C–H), 1331 (w, Csp2–N), 1242 (s, Csp2–O), 1108m (s, Csp3–O), 733 (s, ![[double bond, length as m-dash]](https://www.rsc.org/images/entities/char_e001.gif) C–H), 541 (w, Cu–N), 443 (w, Cu–O). UV-Vis (CH3CN): λmax [nm] (ε [L mol−1 cm−1]) = 248 (29
C–H), 541 (w, Cu–N), 443 (w, Cu–O). UV-Vis (CH3CN): λmax [nm] (ε [L mol−1 cm−1]) = 248 (29![[thin space (1/6-em)]](https://www.rsc.org/images/entities/char_2009.gif) 632, π–π*), 322 (23
632, π–π*), 322 (23![[thin space (1/6-em)]](https://www.rsc.org/images/entities/char_2009.gif) 466, π–π*), 341 (19
466, π–π*), 341 (19![[thin space (1/6-em)]](https://www.rsc.org/images/entities/char_2009.gif) 974, n–π*), 360 (18
974, n–π*), 360 (18![[thin space (1/6-em)]](https://www.rsc.org/images/entities/char_2009.gif) 250, n–π*), 438 (10237, LMCT). Elemental analysis calculated for C22H18CuN2O4 × H2O: C, 57.95; H, 4.42; N, 6.14. Found: C, 57.28; H 4.24; N, 6.24.
250, n–π*), 438 (10237, LMCT). Elemental analysis calculated for C22H18CuN2O4 × H2O: C, 57.95; H, 4.42; N, 6.14. Found: C, 57.28; H 4.24; N, 6.24.
![[small nu, Greek, tilde]](https://www.rsc.org/images/entities/char_e0e1.gif) [cm−1] = 2954–2836 (w, C–H), 1601 (s, C
[cm−1] = 2954–2836 (w, C–H), 1601 (s, C![[double bond, length as m-dash]](https://www.rsc.org/images/entities/char_e001.gif) N), 1577, 1542 (s, C
N), 1577, 1542 (s, C![[double bond, length as m-dash]](https://www.rsc.org/images/entities/char_e001.gif) C), 1460 (w, C–H), 1435, 1377 (s, CH3) 1324 (w, Csp2–N), 1250 (s, Csp2–O), 1108m (s, Csp3–O), 742 (s,
C), 1460 (w, C–H), 1435, 1377 (s, CH3) 1324 (w, Csp2–N), 1250 (s, Csp2–O), 1108m (s, Csp3–O), 742 (s, ![[double bond, length as m-dash]](https://www.rsc.org/images/entities/char_e001.gif) C–H), 528 (w, Fe–N), 456 (w, Fe–O). UV-Vis (CH3CN): λmax [nm] (ε [L mol−1 cm−1]) = 200 (32
C–H), 528 (w, Fe–N), 456 (w, Fe–O). UV-Vis (CH3CN): λmax [nm] (ε [L mol−1 cm−1]) = 200 (32![[thin space (1/6-em)]](https://www.rsc.org/images/entities/char_2009.gif) 419, π–π*), 234 (26
419, π–π*), 234 (26![[thin space (1/6-em)]](https://www.rsc.org/images/entities/char_2009.gif) 511, π–π*), 305 (29
511, π–π*), 305 (29![[thin space (1/6-em)]](https://www.rsc.org/images/entities/char_2009.gif) 305, n–π*), 346 (17
305, n–π*), 346 (17![[thin space (1/6-em)]](https://www.rsc.org/images/entities/char_2009.gif) 247, n–π*), 402 (8469, LMCT). Elemental analysis calculated for C22H18FeClN2O4 × 1.5H2O: C, 55.32; H, 4.08; N, 5.86. Found: C, 55.33; H 3.94; N, 6.04.
247, n–π*), 402 (8469, LMCT). Elemental analysis calculated for C22H18FeClN2O4 × 1.5H2O: C, 55.32; H, 4.08; N, 5.86. Found: C, 55.33; H 3.94; N, 6.04.
Electrode modification
Prior to electrode modification, the GC electrode was rinsed with distilled water and methanol, polished first with 1 μm diamond paste and then with 0.05 μm alumina, quickly placed in an ultrasonic bath and finally rinsed again with distilled water and methanol. The electrode was then left to dry in air. The modification was achieved by anodic polymerization (30 scans, 100 mV s−1, between −0.1 and 1.0 V) of a 0.5 mM solution of Ni(3-OMe)salophen or Cu(3-OMe)salophen or both (1![[thin space (1/6-em)]](https://www.rsc.org/images/entities/char_2009.gif) :
:![[thin space (1/6-em)]](https://www.rsc.org/images/entities/char_2009.gif) 1 molar ratio, total concentration 1.0 mM). A slightly larger potential interval (−0.2 to 1.0 V) was scanned in experiments involving Fe(3-OMe)salophen but with the other conditions such as scan rate, concentration and molar ratios remaining the same. The amounts of complexes needed for the preparation of the solution were always dried overnight at 60 °C before the experiment.
1 molar ratio, total concentration 1.0 mM). A slightly larger potential interval (−0.2 to 1.0 V) was scanned in experiments involving Fe(3-OMe)salophen but with the other conditions such as scan rate, concentration and molar ratios remaining the same. The amounts of complexes needed for the preparation of the solution were always dried overnight at 60 °C before the experiment.
Results and discussion
Electropolymerization studies
It has been already established that NiII,23 CuII![[thin space (1/6-em)]](https://www.rsc.org/images/entities/char_2009.gif) 24 and FeIII
24 and FeIII![[thin space (1/6-em)]](https://www.rsc.org/images/entities/char_2009.gif) 13 salen or salophen single complexes alone can be polymerized electrochemically in acetonitrile solutions. It is important to point out that the oxidation of the ligand (3-OMe)salophen does not lead to the deposition of an electroactive material. The first scan (Fig. S1, ESI†) displays an oxidation peak at 0.64 V, corresponding to the irreversible monomer oxidation. This wave possessed the greatest intensity at the start of the experiment while subsequent scans showed a continued decrease of the current response. A further oxidation peak at 0.44 V emerges from the second cycle onward, but its current intensity decreases after each cycle, which means that some oligomeric material probably precipitates on the electrode but it is not fully conductive and above all, not very stable. The investigation of the electrochemical polymerization behavior of the complexes considered in this study at the selected concentration (0.5 mM) is a fundamental starting point before proceeding to the copolymerization experiments. Fig. 1 summarizes the voltammograms recorded during the potentiodynamic polymerizations of the single metal salophen complexes and the electrochemical characterization of their thin films.
13 salen or salophen single complexes alone can be polymerized electrochemically in acetonitrile solutions. It is important to point out that the oxidation of the ligand (3-OMe)salophen does not lead to the deposition of an electroactive material. The first scan (Fig. S1, ESI†) displays an oxidation peak at 0.64 V, corresponding to the irreversible monomer oxidation. This wave possessed the greatest intensity at the start of the experiment while subsequent scans showed a continued decrease of the current response. A further oxidation peak at 0.44 V emerges from the second cycle onward, but its current intensity decreases after each cycle, which means that some oligomeric material probably precipitates on the electrode but it is not fully conductive and above all, not very stable. The investigation of the electrochemical polymerization behavior of the complexes considered in this study at the selected concentration (0.5 mM) is a fundamental starting point before proceeding to the copolymerization experiments. Fig. 1 summarizes the voltammograms recorded during the potentiodynamic polymerizations of the single metal salophen complexes and the electrochemical characterization of their thin films.
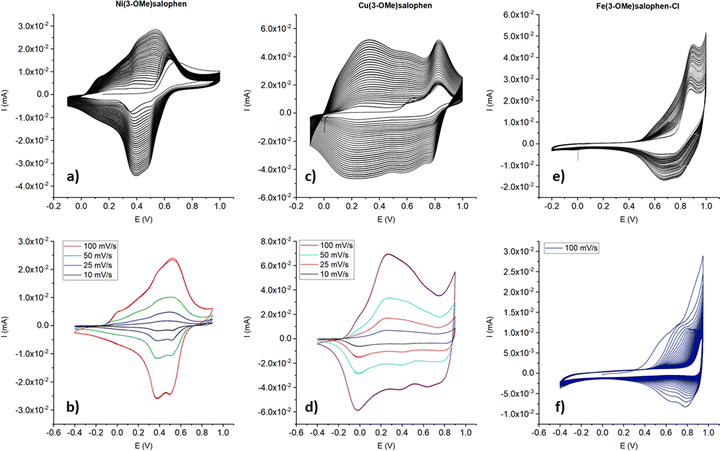 | ||
| Fig. 1 Electropolymerization (first row) voltammograms of 0.5 mM single salophen complexes solutions and cyclic voltammograms (second row) of their corresponding thin films in 0.1 M TBAHFP/MeCN. | ||
Ni(3-OMe)salophen (NiL) exhibits an oxidation peak at 0.68 V (Fig. 1(a)) in its first cycle, associated with a reduction process at +0.35 V. From the second cycle onward, a progressive increase in the current response can be noticed in the potential range 0–0.7 V, which is consistent with conducting polymer (CP) film formation that fully covers the electrode surface. Although it is difficult to define the exact potentials at which the redox processes involving the CP occur, the maximum values of anodic and cathodic currents were recorded at about 0.50 and 0.39 V, respectively. Bedioui et al. in their study about electropolymerization of Ni-salen in MeCN also saw the emergence of a new couple around 0.4 V (vs. SCE) whose intensity increased during cycling and whose potential slightly shifted to higher values.12 Cyclic voltammograms for poly-NiL films were subsequently recorded at different scan rates (Fig. 1(b)). Under these conditions, stable voltammograms were observed during over 50 repeated cycles, indicating the good chemical and electrochemical stability of the electrodeposited single metal polymer which displays two redox couples at 0.42 V/0.38 V and 0.52 V/0.5 V. It is possible to hypothesize that the former redox couple originates from the highly conjugated polymeric backbone of the film, whereas the latter might be attributed to the NiIII/NiII couple since many reports, although at different potentials due to different experimental conditions, assume its presence in the film.10,12,25–27 Unlike the metal-free monomer polymerization attempt, the electropolymerization of the NiL complex occurred much better. Such an improvement in the electrooxidation process should result from the presence of the coordinated metal, which would act as an electronic relay and, therefore, favor the charge propagation within the salophen units.
Cu(3-OMe)salophen (CuL) shows two irreversible oxidation peaks at 0.64 V, ascribable to the oxidation of the ligand, and at 0.82 V, relevant to the oxidation of CuII to CuIII (Fig. 1(c)). Audebert et al. reported an analogous behavior for Cu-salen complexes and mentioned that the presence of the electron donor group methoxy lowered the potential for the occurrence of such redox phenomena.22 The first oxidation peak disappears after the first cycle, whereas a new broad one around 0.27 V appears, corresponding to the early stage of polymer deposition. Overall, the electropolymerization process for CuL seems to proceed in a way similar to that of NiL but more easily and again leads to a stable polymer. In fact, also in such a case, the cyclic voltammograms show stable responses over 50 repeated cycles (Fig. 1(d)). The major differences are related to the higher recorded currents and to the wider potential range (−0.3 V to +0.7 V) where the polymer displays the oxidation (doping) and reduction (de-doping) processes. Most likely the reason for such a difference stems from the metal center, since the ligand and the complex geometry are the same, which gives further evidence of the importance of the kind of metal in the polymerization process.
Fe(3-OMe)salophen-Cl (FeL) shows an irreversible oxidation peak at 0.88 V during the first segment of potential application (Fig. 1(e)). From the second cycle onward, poly-FeL starts to be deposited on the electrode surface, as suggested by the appearance of a moderate anodic current increase cycle by cycle, starting from a potential value higher than 0.45 V and of the corresponding reduction process. The electrochemical behavior matches that described in previous reports,13,28 and it can be ascribed to the formation of the ligand radical cation, since oxidation to FeIV is highly unlikely.13 The oxidation process in FeL occurs at a more anodic potential, if compared to the same process for the salophen alone due to the presence of iron. In this case, the salophen complex has a square pyramidal geometry around Fe with a chlorine atom in the apical position, and also acetonitrile can act as a ligand for the metal center through the unoccupied sixth position in the coordination sphere of iron.13 Poly-FeL shows the typical oxidation/reduction processes of a CP at potentials higher than 0.5 V, yet as soon as the maximum of the anodic current is reached, overoxidation clearly takes place, and consequently, the response of poly-FeL starts to diminish after each cycle (Fig. 1(f)). These are the main differences between poly-NiL and poly-CuL which display their redox activity at much less anodic potential values and are stable up to a large number of cycles (>50).
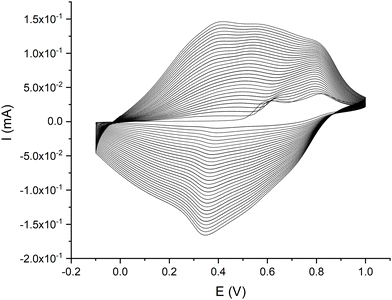 | ||
| Fig. 2 Electropolymerization voltammogram for poly-NiCu, recorded in a solution made up of 0.5 mM Ni(3-OMe)salophen and 0.5 mM Cu(3-OMe)salophen in 0.1 M TBAHFP/MeCN at 100 mV s−1 for 30 cycles. | ||
In the first cycle, two irreversible oxidation events occur at 0.63 V (NiL) and 0.8 V (CuL). The former peak can be attributed to ligand oxidation in both complexes since both exhibit an oxidation peak at such a voltage on their electropolymerization voltammograms, whereas the latter peak is ascribable to CuL, which unlike NiL shows an oxidation peak at this potential. From the second cycle onward, the heterobimetallic polymer starts to deposit on the electrode surface, as confirmed by the broad current signals both in oxidation and in reduction. We can assume that the polymerization process involves both complexes on the basis of two observations: first, the fact that the relative current intensity of the two oxidation peaks is more or less the same, while in the first oxidation segment of poly-CuL, the current related to the least anodic couple was much less intense – this confirms the redox involvement of the NiL. Second, the trend of the currents due to the polymer growth displayed in Fig. 2 is intermediate between the ones recorded for the electropolymerization of the single metal complexes. The results obtained from EDX (reported in a specific section) will further support this statement.
Fig. 3 shows the electrosynthesis voltammogram for poly-CuFe, i.e. the material resulting from the solution containing CuL and FeL complexes. Again, we can confirm the involvement of both complexes in the process of growth of the resulting polymer on the basis of the relative current intensity of the two oxidation peaks recorded in the first anodic segment and from the appearance of the trend of the current increase displayed during the 30 CV cycles. In fact in such a case, the intensity of the more anodic wave (around 0.85 V) is much higher than the one relevant to the ligand oxidation (at 0.60 V) if compared with the first cycle of the polymerization of CuL, confirming the signal is due also to the redox activity of FeL, for which the oxidation of the ligand alone occurs at more anodic potentials as explained before. Furthermore, the oxidation process of the growing metal polymer starts at a potential close to 0.2 V which is intermediate between the values observed for CuL (about 0 V) and FeL (>0.5 V).
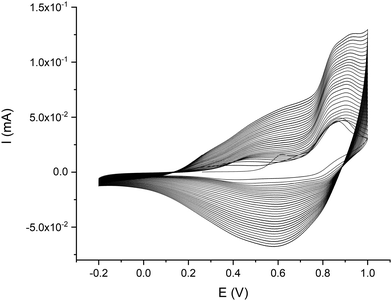 | ||
| Fig. 3 Electropolymerization voltammograms for poly-CuFe, recorded in a solution made up of 0.5 mM Fe(3-OMe)salophen-Cl and 0.5 mM Cu(3-OMe)salophen in 0.1 M TBAHFP/MeCN at 100 mV s−1 for 30 cycles. | ||
Cyclic voltammograms for poly-NiCu and poly-CuFe in the organic supporting electrolyte solution are shown in Fig. 4(a) and (b), respectively. Both materials clearly undergo a charge–discharge process upon cycling, poly-NiCu between −0.2 V to +0.8 V, approximately, and poly-CuFe in a narrower potential window (0.1–0.8 V). While no clear values for oxidation and reduction events can be properly indicated for poly-CuFe, it is possible to highlight for poly-NiCu three oxidation waves at 0.0, 0.4 and 0.73 V and three reduction waves at 0.58, 0.35 and −0.03 V. All potential values and ranges are independent of scan rate, suggesting favorable charge transfer kinetics with the glassy carbon electrode and a good film conductivity. Additionally, materials were exceptionally stable and could undergo a high number of cycles (>100), without an appreciable change in the electrochemical response. The reproducibility of the electrosynthesis was also studied (Fig. 4(c) and (d)): the materials clearly appear to be reproducible from the point of view of the involved redox processes. In particular, the electrosynthesis of poly-NiCu shows a high degree of reproducibility, since performing three independent depositions, the CVs display current values which are similar enough (Fig. 4(c)), whereas this is not the case of poly-CuFe: each deposition – for the same number of cycles – produces a layer with different electroactivity in terms of current (Fig. 4(d)).
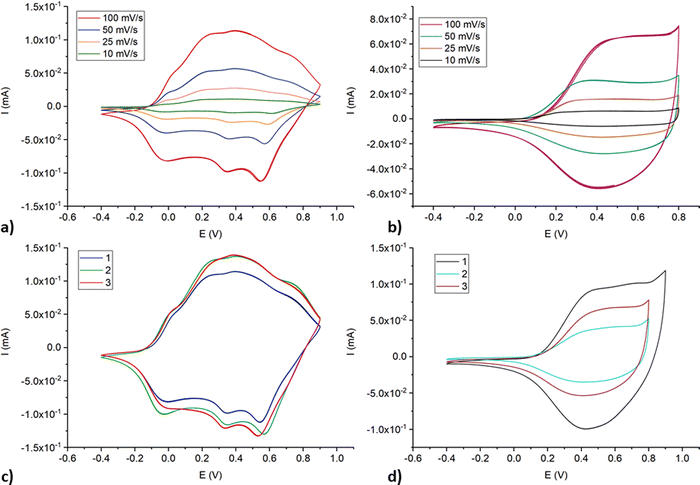 | ||
| Fig. 4 CVs at different scan rates and single characterization at 100 mV s−1 scan rate for poly-NiCu (a and c) and poly-CuFe (b and d) in 0.1 TBAHFP/MeCN. | ||
To confirm the copolymeric nature of the poly-NiCu and poly-CuFe, a few experiments were carried out to synthesize a bi-layer material consisting of two monometallic polymers. Only one complex was first electropolymerized for 15 cycles and then the GC electrode was further electromodified in a solution of the other complex, again for 15 more cycles. The effect of the complex order was also investigated. The deposition conditions were the same as previously described. The electropolymerization voltammograms and the relevant CVs of the bilayers poly-NiL/poly-CuL and poly-NiL/poly-CuL and poly-CuL/polyFeL and poly-FeL/polyCuL are shown in Fig. S2 and S3 (ESI†), respectively. Looking at the responses shown in Fig. 1, it is possible to state that they appear as the sum of the two contributions relevant to each monometal polymer, with the layer which was electrosynthesized second having a seemingly larger influence on the electrochemical behavior of the film. This behaviour could be expected since the second polymer exhibits its electrochemical properties more easily, due to the fact that it does not suffer from diffusion limitations as the first electrodeposited layer does. Therefore, since the CVs of the poly-NiCu and poly-CuFe are different from the ones of the monometallic polymers sequentially electrodeposited, we can therefore assume that the electrosynthesized heterometallic polymers are most probably copolymers.
Physical characterization of films
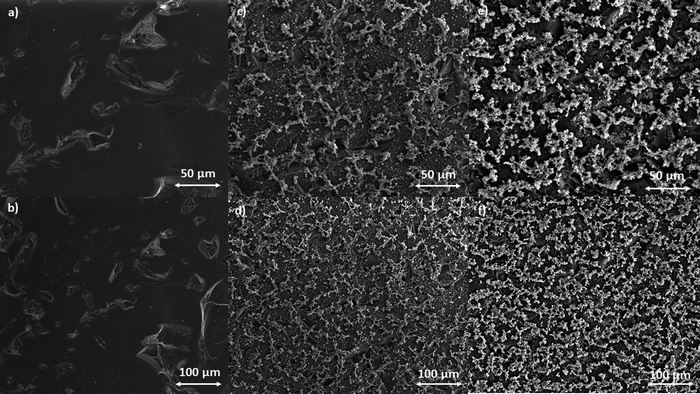 | ||
| Fig. 5 SEM images of the GC electrode surface (a) and (b), poly-NiCu (c) and (d) and poly-CuFe (e) and (f). | ||
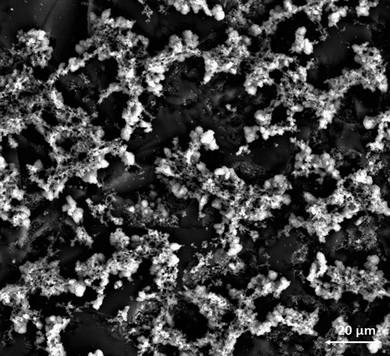
Recording images at higher magnitudes proved to be more challenging; however, a successful attempt is displayed in Fig. 6, with a resolution of 20 μm.
Table 1 summarizes the findings from the EDX analysis. For each material, the presence of the two metals is verified, being both nickel and copper detected in poly-NiCu, as well as copper and iron in poly-CuFe. The mapping of backscattered electrons shows a homogeneous distribution of the metal centers on the electrode surface (see Fig. S4a and b, ESI†). The presence of phosphorus and fluorine is surely due to the fact that PF6− anions remain inside the film during the doping process to compensate for the charge of the partially oxidized film (indeed all CV cycles stop at the open circuit potential value, which displays a positive value). Even though the response sensitivity of fluorine is particularly high (the molar ratio between phosphorus and fluorine is ∼18 for poly-NiCu and ∼11 for poly-CuFe), the results obtained from EDX analyses allow drawing some conclusions. The ratio of the two metal centers is between 1 and 2, with a slight predominance of Cu. This value, although not accurate, confirms what was observed during the CV recorded for the electropolymerization of the heterobimetallic polymers, and it is further supported by the observation that for poly-CuFe the molar ratio Fe/Cl is about 1.6. Aluminium is also found in very small amounts and its presence can be explained as an alumina residue resulting from the polishing process of the GC electrode, despite the sonication treatment and the rinsing in water. Further evidence comes from the detection of aluminum traces also on the bare electrode surface (see S5a–c, ESI† for EDX spectra). The glassy carbon underlying the film most likely contributes to the measured carbon content.
| Detected element | Poly-NiCu (%) | Poly-CuFe (%) | Absolute error (%) |
|---|---|---|---|
| C | 80.17 | 81.90 | 3.21 |
| N | 6.81 | 7.26 | 0.42 |
| O | 9.17 | 5.99 | 0.48 |
| P | 0.17 | 0.33 | 0.03 |
| F | 3.20 | 3.71 | 0.24 |
| Cu | 0.25 | 0.28 | 0.07 |
| Ni | 0.13 | — | 0.03 |
| Fe | — | 0.18 | 0.03 |
| Al | 0.09 | 0.24 | 0.02 |
| Cl | — | 0.11 | 0.01 |
![[double bond, length as m-dash]](https://www.rsc.org/images/entities/char_e001.gif) O groups, others in the 1611–1500 cm−1 range and one complex band between 1160 and 1000 cm−1 which can be attributed to C–O vibrations, with peaks at 1153, 1100 and 1042 cm−1. These results are consistent with the formation of phenolic and carboxylic species on the GC polished surface because of the occurrence of oxidation reactions.29
O groups, others in the 1611–1500 cm−1 range and one complex band between 1160 and 1000 cm−1 which can be attributed to C–O vibrations, with peaks at 1153, 1100 and 1042 cm−1. These results are consistent with the formation of phenolic and carboxylic species on the GC polished surface because of the occurrence of oxidation reactions.29
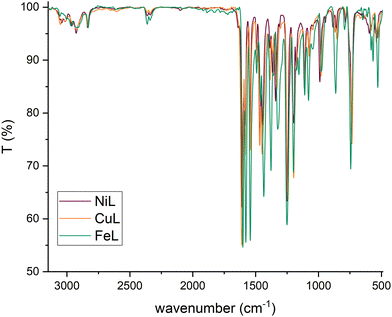
The spectra of poly-NiCu and poly-CuFe were examined by comparing them first with the FT-IR spectra of the complexes (shown in Fig. 7, in the discussion approximate values of main peaks will be reported when making comparisons) and then with the FT-ATR spectra of the films formed by electropolymerization of single metal complexes only, recorded for the sake of the work's robustness.
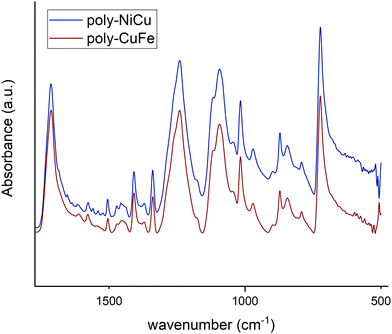
Fig. 8 shows the spectra of poly-NiCu and poly-CuFe, which are mostly superimposable. An important feature is the presence of a sharp peak at 1714 cm−1, which is absent in the spectra of the complexes. Peaks around 1700 cm−1 are usually attributed to C![[double bond, length as m-dash]](https://www.rsc.org/images/entities/char_e001.gif) O groups, but they might also be typical of particularly electron-rich imine functionalities30,31 – which are present in these polymeric materials due to extensive conjugation effects. It should also be pointed out that the glassy carbon electrode might give strong interactions between the groups present on its surface and the imine functionality, with a consequent strong shift in the band. The absence of strong stretching bands around 1630–1600 cm−1 – typically assigned to C
O groups, but they might also be typical of particularly electron-rich imine functionalities30,31 – which are present in these polymeric materials due to extensive conjugation effects. It should also be pointed out that the glassy carbon electrode might give strong interactions between the groups present on its surface and the imine functionality, with a consequent strong shift in the band. The absence of strong stretching bands around 1630–1600 cm−1 – typically assigned to C![[double bond, length as m-dash]](https://www.rsc.org/images/entities/char_e001.gif) N, present in the ligand at 1612 cm−1 and in complexes at lower wavenumbers as an effect of coordination by the azomethine nitrogen – makes a case for assuming a shift for the imine due to a change in its chemical environment rather than to an electrochemical modification affecting it, as imine functionalities should not take part in the electropolymerization mechanism. Such a band was therefore attributed to the imine functionality.
N, present in the ligand at 1612 cm−1 and in complexes at lower wavenumbers as an effect of coordination by the azomethine nitrogen – makes a case for assuming a shift for the imine due to a change in its chemical environment rather than to an electrochemical modification affecting it, as imine functionalities should not take part in the electropolymerization mechanism. Such a band was therefore attributed to the imine functionality.
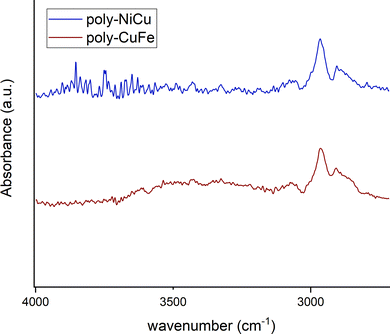
In the 1600–1500 cm−1 range, many bands, though very low in intensity, attributable to aromatic C![[double bond, length as m-dash]](https://www.rsc.org/images/entities/char_e001.gif) C stretchings can be seen in the films’ spectra, whereas the complexes display only two absorption bands at 1579 cm−1 and 1541 cm−1. The higher number of bands can be explained as an effect of the extensive conjugation, making other vibrations possible due to new bonds having been formed and having increased the rigidity of the systems.23 The spectra of the complexes show several bands at 1198 cm−1, 1173 cm−1 and 1155 cm−1 while none is present in the films’ spectra in this range of wavenumbers. On the other side, a new band at 1016 cm−1 in the film spectra (absent in the spectra of the complexes) is detected. Such differences might stem from and reflect the chemical environment due to the new bonds linking the monomeric units: the bands in the range 1200–1150 cm−1 in the complexes could belong to C–H bendings of the vicinal trisubstituted aromatic units,32 which then are hindered by the new C–C bonds merging the complex units. Therefore, the band at 1016 cm−1 could also be attributed to these new C–C bonds. Bands ascribable to functional groups are also visible in the films’ spectra, such as –CH3 (1409 cm−1 and 1371 cm−1, in complexes 1435 cm−1 and 1375 cm−1), Csp2–N (1340 cm−1, in complexes 1335 cm−1) and C–O (1241 cm−1 for the stretching with aromatic carbons, same for complexes, and 1093 cm−1 for aliphatic carbons, in complexes 1108 cm−1). The presence of electrolyte (PF6−) in the film is also confirmed by a band at 845 cm−1.23 Bands below 1000 cm−1 are difficult to interpret, as aromatic C
C stretchings can be seen in the films’ spectra, whereas the complexes display only two absorption bands at 1579 cm−1 and 1541 cm−1. The higher number of bands can be explained as an effect of the extensive conjugation, making other vibrations possible due to new bonds having been formed and having increased the rigidity of the systems.23 The spectra of the complexes show several bands at 1198 cm−1, 1173 cm−1 and 1155 cm−1 while none is present in the films’ spectra in this range of wavenumbers. On the other side, a new band at 1016 cm−1 in the film spectra (absent in the spectra of the complexes) is detected. Such differences might stem from and reflect the chemical environment due to the new bonds linking the monomeric units: the bands in the range 1200–1150 cm−1 in the complexes could belong to C–H bendings of the vicinal trisubstituted aromatic units,32 which then are hindered by the new C–C bonds merging the complex units. Therefore, the band at 1016 cm−1 could also be attributed to these new C–C bonds. Bands ascribable to functional groups are also visible in the films’ spectra, such as –CH3 (1409 cm−1 and 1371 cm−1, in complexes 1435 cm−1 and 1375 cm−1), Csp2–N (1340 cm−1, in complexes 1335 cm−1) and C–O (1241 cm−1 for the stretching with aromatic carbons, same for complexes, and 1093 cm−1 for aliphatic carbons, in complexes 1108 cm−1). The presence of electrolyte (PF6−) in the film is also confirmed by a band at 845 cm−1.23 Bands below 1000 cm−1 are difficult to interpret, as aromatic C![[double bond, length as m-dash]](https://www.rsc.org/images/entities/char_e001.gif) C and C–H bending vibrations can overlap. The functional group region for the films (Fig. 9) did not show any –OH stretching but possessed a new profile in the C–H stretching bands with just two peaks at 2963 cm−1 and 2908 cm−1, whereas in the spectra of the complexes, multiple bands at 3060 cm−1, 3015 cm−1, 2927 cm−1 and 2838 cm−1 were recorded. This further suggests a change in vibrational modes for C–H, caused by a new chemical environment after the electropolymerization process.
C and C–H bending vibrations can overlap. The functional group region for the films (Fig. 9) did not show any –OH stretching but possessed a new profile in the C–H stretching bands with just two peaks at 2963 cm−1 and 2908 cm−1, whereas in the spectra of the complexes, multiple bands at 3060 cm−1, 3015 cm−1, 2927 cm−1 and 2838 cm−1 were recorded. This further suggests a change in vibrational modes for C–H, caused by a new chemical environment after the electropolymerization process.
No major differences were noticed between the bimetallic films and the monometallic ones (Fig. S7, ESI†), which suggests that structurally the films are similar to a very high degree, i.e., they are characterized by the presence of the same bonds. In the fingerprint region of the monometallic films, weak bands at wavenumbers corresponding to the M–N stretching vibrations in the spectra of the complexes were found (Fig. S8, ESI†): at 527 cm−1 for poly-FeL (at 528 cm−1 in the spectrum of the Fe complex), also present in poly-CuFe at 526 cm−1; at 531 cm−1 for poly-NiL (found at the same wavenumber in the spectrum of the Ni complex), also present in poly-NiCu at 527 cm−1; and at 544 cm−1 for poly-CuL (at 541 cm−1 in the spectrum of the Cu complex), also present both in poly-CuFe at the same wavenumber and in poly-NiCu at 542 cm−1. The shape of the bands also helps in observing the similarities. This is further experimental evidence that both complexes are involved in the electropolymerization of the films and that the ratio of the metals cannot differ significantly from 1.
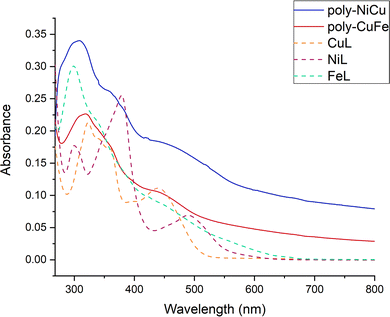 | ||
| Fig. 10 UV-Vis spectra of the copolymers (unknown concentration) and the single complexes (c = 1.0 × 10⁻⁵ M) in DMF between 268–800 nm. | ||
The UV-vis spectrum of NiL shows three absorption maxima bands at 300, 378, and 491 nm. A shoulder is seen at 349 nm. The UV-vis spectrum of CuL displays two absorption bands peaking at 324 and 441 nm. Two shoulders are also evident at ∼342 and 390 nm. The UV-vis spectrum of FeL shows an intense narrow absorption band with a maximum of 298 nm. Again, a shoulder is present around ∼340 nm. There are also absorptions in the visible range which extend to 600 nm, but with no clear maxima. The absorption maxima bands in the 250 to 400 nm range are attributed to intraligand π → π* and n → π* transitions. The absorption maxima in the 400 to 600 nm region correspond to the phenolate-to-metal charge transfer (LMCT) transitions.
The spectra of the copolymers are similar but not identical. Thus, intense absorption is observed peaking at 300 nm (for poly-NiCu) and 320 nm for (poly-CuFe). These absorption bands exhibit long tails on the lower energy scale, which, in contrast to the monomeric complexes, extend over the full visible range. Shoulders are evident in the spectra as well, for polyNiCu at ∼360 and ∼440 nm and for (poly-CuFe) at similar wavelengths. The latter feature for both copolymers may be ascribed to the presence of CuL, which appears to be in slight excess with respect to the other metals in both copolymers, as already said in the paragraph about SEM/EDX. Poly-NiCu also shows a shoulder around 490 nm, corresponding to the presence of NiL inside the polymeric structure. Finally, it can also be seen that between 800–650 nm, both copolymers possess a higher residual absorbance than one of the single complexes, which tends to be zero. This result can be also assigned to the extensive conjugation of the polymeric structure. Overall, UV-Vis analysis clearly confirms the presence of both metals in the copolymers.
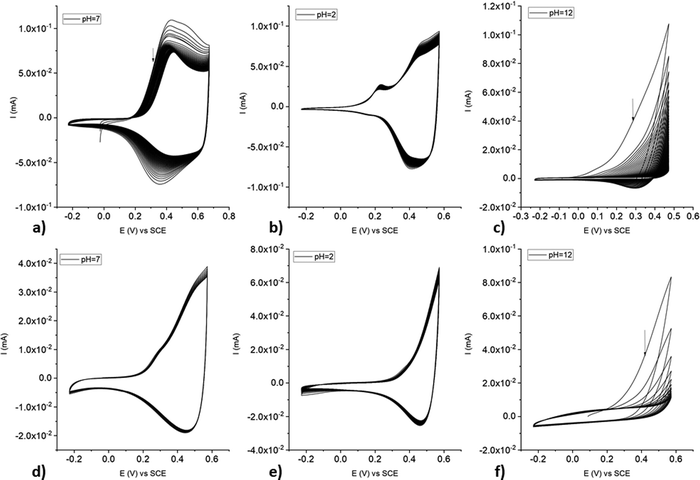
Electrochemical characterization in water
poly-NiCu and poly-CuFe were also characterized in aqueous solutions at different pH values. Overall, poly-NiCu (Fig. 11(a)–(c)) is conductive and stable in water, although the current slightly decreases during cycling. pH is clearly a strong influencing factor: both at acidic (pH = 2, 0.01 M H2SO4) and neutral pH the material can sustain many cycles (up to 100) but undergoes a slow modification in the former case: a new small peak emerges around 0.21 V. The charge/discharge process takes place in a narrower potential window in comparison to organic media, i.e., between 0.1–0.7 V. The material is however unstable at basic pH (pH = 12, 0.01 M NaOH), undergoing strong irreversible oxidation, whose current intensity decreases considerably after each cycle. The characterization of poly-CuFe (Fig. 11(d)–(f)) shows strong similarities to poly-NiCu concerning stability: the material is stable at acidic and neutral pH but not in basic solutions. Possibly OH− anions are intercalated during the oxidation process and both coordinate the metal centers and attack the imine functionalities, hindering the conducting process. Different potential ranges were explored in acidic solutions for poly-CuFe but no notable differences were recorded. Also in this case, the charge/discharge process occurred in a smaller potential range, i.e., between 0.2 and 0.6 V. Decomposition of the material started when the potential was set higher than 0.7 V.Sensing of ascorbic acid
A preliminary study of the oxidation of AA was carried out by CV and chronoamperometry. In addition, the performance of films formed by single complexes only was evaluated by CV to compare them with poly-NiCu and poly-CuFe and gain more insight into the metals responsible for catalytic effects. AA was shown to oxidize irreversibly at 0.33 V at the bare GC electrode surface and all monometallic films appeared to effect electrocatalysis: in the presence of AA, poly-NiL showed two new oxidation peaks at 0.07 V and 0.15 V, poly-CuL a new one at 0.16 V and poly-FeL a new one at 0.18 V (Fig. S9–S11, ESI†). The current of these peaks increased linearly with AA concentration in the solution, even though the potential slightly shifted anodically after every addition, possibly as a result of the higher occupation of the active sites and slower charge transfer kinetics. We might hypothesize that the catalytic oxidation around 0.18 V, found in each monometallic film, originates from the CP backbone which is the common feature among them.CVs for poly-NiCu and poly-CuFe are shown in Fig. 12(a) and (c). Increases in the anodic currents proportional to the AA concentration are recorded for both materials, although they differ in their electrocatalytic behavior: whereas a new oxidation peak at 0.18 V appears in poly-NiCu voltammogram, no gain in terms of lower potential is observed in poly-CuFe, since one new oxidation wave appears at 0.38 V. The shifts to higher potential as AA concentration increases seem to be more marked than for the monometallic films. On the other hand, the presence of two different metals enhances the sensitivity (Fig. S12, ESI†). In fact, the recorded anodic currents for poly-NiCu and poly-CuFe are higher than those for monometallic films at the same AA concentration (1.5 mM). Such stark differences between these two sets of films suggest that the chemistry of poly-NiCu and poly-CuFe is rather different from the one of poly-NiL, poly-CuL and poly-FeL.
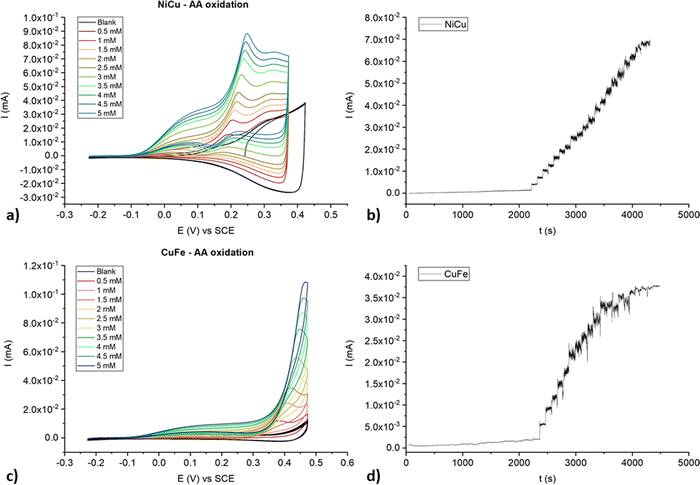 | ||
| Fig. 12 CVs recorded for poly-NiCu and poly-CuFe at different concentrations of AA, 50 mV s−1 scan rate ((a) and (c), respectively) and chronoamperometric (b) and (d) profiles. | ||
Higher potentials (E = +0.3 V for poly-NiCu and +0.5 V for poly-CuFe) were set when performing chronoamperometry to ensure full AA oxidation despite potential shifts taking place as AA concentration increases through repeated additions. The concentration ranges explored were between 10−6 M and 10−3 M. For poly-NiCu, the current is always proportional to the concentration of AA in the cell (Fig. 12(b)), while poly-CuFe current signal is not linearly dependent on concentration shortly after passing the 10−3 M threshold (Fig. 12(d)). The sensitivities and limits of detection (LOD) values for the two materials are listed in Table 2.
| Sensitivity (AM−1) | LOD (M) | |
|---|---|---|
| Poly-NiCu | 16.05 ± 0.2 | 4 × 10⁻⁶ |
| Poly-CuFe | 18.6 ± 0.4 | 2 × 10⁻⁵ |
Conclusions
We synthesized two new salophen-based materials, likely copolymeric in nature, by a simple electrochemical approach based on anodic electropolymerization. EDX proved indeed the homogeneously distributed presence of both metal centers in the materials deposited on the electrode surface. The films appear to be very stable electrochemically as they can undergo a large number of cycles (n ≥ 100) and show electrochemical behavior that is unaffected by the applied scan rate in organic media. The materials were also very stable in aqueous media. It is possible to assume that such stability stems from internal structural features – such as an extended π conjugation provided by imine linkages and aromatic rings – and from firm interactions between the material and the GC substrate, as both are organic in nature. Metal centers do play a role in the polymerization mechanism, as the ligand alone does not polymerize electrochemically under the same conditions. Overall, such bimetallic conducting polymers are candidates for several applications, such as electrocatalysis and energy storage devices like supercapacitors or sensing. The electrosynthesis method reported here is easy, fast and enables control of film thickness on a carbonaceous substrate, which is appropriate for industrial applications. Further new materials could be synthesized by choosing a combination of other different metal centers or different substituents. Such fine tuning can be very easily achieved by the simplicity of synthesis of salen and salophen ligands and complexes. Finally, the sensing of ascorbic acid was explored as a potential application.Author contributions
FB conceived the idea; FB and IG designed the electrochemical experiments; FB carried out the synthetic and characterization work of the complexes and performed all electrochemical experiments; JG recorded the FT-ATR spectra of the thin films; LR and BH recorded the SEM images and performed EDX analysis; FB, DT and BK wrote the paper; DT supervised the electrochemical work; BK supervised the overall work.Conflicts of interest
There are no conflicts to declare.Acknowledgements
We are thankful to DFG for providing financial support. FB wishes to acknowledge and thank Dr Manuela Reichelt (Wilhelm Ostwald Institute, Faculty of Chemistry, Leipzig University) and Julia Emilie Knapp for their help and support. We wish to thank also Dr Winfried Böhlmann (Faculty of Physics, Leipzig University) for allowing us to use the electron microscope.References
- H. Schiff, Mittheilungen aus dem Universitätslaboratorium in Pisa: Eine neue Reihe organischer Basen, Justus Liebigs Ann. Chem., 1864, 131, 118–119 CrossRef.
- K. C. Gupta and A. K. Sutar, Catalytic activities of Schiff base transition metal complexes, Coord. Chem. Rev., 2008, 252, 1420–1450 CrossRef CAS.
- M. N. Uddin, S. S. Ahmed and S. M. R. Alam, Biomedical applications of Schiff base metal complexes, J. Coord. Chem., 2020, 73, 3109–3149 CrossRef CAS.
- E. N. Oiye, M. F. Muzzetti Ribeiro, J. M. Toia Katayama, M. C. Tadini, M. A. Balbino, I. C. Eleotério, J. Magalhães, A. Soares Castro, R. Roares Mota Silva, J. W. da Cruz Jùnior, E. R. Dockal and M. F. de Oliveira, Electrochemical Sensors Containing Schiff Bases and their Transition Metal Complexes to Detect Analytes of Forensic, Pharmaceutical and Environmental Interest. A Review, Crit. Rev. Anal. Chem., 2019, 49, 488–509 CrossRef CAS PubMed.
- S. Wezenberg and A. Kleij, Material Applications for Salen Frameworks, Angew. Chem., Int. Ed., 2008, 47, 2354–2364 CrossRef CAS PubMed.
- J. Zhang, L. Xu and W. Y. Wong, Energy materials based on metal Schiff base complexes, Coord. Chem. Rev., 2018, 355, 180–198 CrossRef CAS.
- A. C. W. Leung and M. J. MacLachlan, Schiff Base Complexes in Macromolecules, J. Inorg. Organomet. Polym., 2007, 17, 57–89 CrossRef CAS.
- C. Friebe, M. D. Hager, A. Winter and U. S. Schubert, Metal-containing Polymers via Electropolymerization, Adv. Mater., 2012, 24, 332–345 CrossRef CAS PubMed.
- K. A. Goldsby, J. K. Blaho and L. A. Hoferkamp, Oxidation of nickel(II) bis(salicylaldimine) complexes: Solvent control of the ultimate redox site, Polyhedron, 1989, 8, 113–115 CrossRef CAS.
- L. A. Hoferkamp and K. A. Goldsby, Surface-Modified Electrodes Based on Nickel(II) and Copper(II) Bis(salicylaldimine) Complexes, Chem. Mater., 1989, 1, 348 CrossRef CAS.
- P. Audebert, P. Capdeville and M. Maumy, Description of new redox and conducting polymers based on Copper containing units: Emphasis on the role of Copper in the electron transfer mechanism, Synth. Met., 1991, 43, 3049–3052 CrossRef CAS.
- F. Bedioui, E. Labbe, S. Gutierrez-Granados and J. Devynck, Electrooxidative polymerization of cobalt, nickel and manganese salen complexes in acetonitrile solution, J. Electroanal. Chem. Interfacial Electrochem., 1991, 301, 267–274 CrossRef CAS.
- F. Miomandre, P. Audebert, M. Maumy and L. Uhl, Electrochemical behaviour of iron(III) salen and poly(iron–salen). Application to the electrocatalytic reduction of hydrogen peroxide and oxygen, J. Electroanal. Chem., 2001, 516, 66–72 CrossRef CAS.
- D. Cakmak, T. Bulut and D. Uzun, Electrocatalytic Investigations of Cu(II) and Fe(III) Complexes of Salophen Derivative Schiff Bases on the Pencil Graphite Electrode, Electroanalysis, 2020, 32, 1559–1570 CrossRef CAS.
- T. R. L. Dadamos and M. F. S. Teixeira, Electrochemical sensor for sulfite determination based on a nanostructured copper-salen film modified electrode, Electrochim. Acta, 2009, 54, 4552–4558 CrossRef CAS.
- G. Yan, J. Li, Y. Zhang, F. Gao and F. Kang, Electrochemical Polymerization and Energy Storage for Poly[Ni(salen)] as Supercapacitor Electrode Material, J. Phys. Chem. C, 2014, 118, 9911–9917 CrossRef CAS.
- S. N. Eliseeva, E. V. Alekseeva, A. A. Vereshchagin, A. I. Volkov, P. S. Vlasov, A. S. Konev and O. V. Levin, Nickel-Salen Type Polymers as Cathode Materials for Rechargeable Lithium Batteries, Macromol. Chem. Phys., 2017, 218, 1700361 CrossRef.
- P. Buchwalter, J. Rosé and P. Braunstein, Multimetallic catalysis based on heterometallic complexes and clusters, Chem. Rev., 2015, 115, 28–126 CrossRef CAS PubMed.
- K. Namsheer and C. Sekhar Rout, Conducting polymers: a comprehensive review on recent advances in synthesis, properties and applications, RSC Adv., 2021, 11, 5659–5697 RSC.
- S. Y. Lee, A. Hille, C. Frias, B. Kater, B. Bonitzki, S. Wölfl, H. Scheffler, A. Prokop and R. Gust, [NiII(3-OMe-salophene)]: A Potent Agent with Antitumor Activity, J. Med. Chem., 2010, 53, 6064–6070 CrossRef CAS PubMed.
- D. Tomczyk, W. Bukowski and K. Bester, Redox processes in the solution of Ni(II) complex with salen type ligand and in the polymer films, Electrochim. Acta, 2018, 267, 181–194 CrossRef CAS.
- P. Audebert, P. Capdeville and M. Maumy, Redox and cundicting polymers based on salen-type metal units; Electrochemical study and some characteristics, New J. Chem., 1992, 16, 697–703 CAS.
- D. Tomczyk, W. Bukowski, K. Bester, P. Urbaniak, P. Seliger, G. Andrijewski and S. Skrzypek, The mechanism of electropolymerization of nickel(II) salen type complexes, New J. Chem., 2017, 41, 2112–2123 RSC.
- P. Audebert, P. Hapiot, P. Capdevielle and M. Maumy, Electrochemical polymerization of several salen-type complexes. Kinetic studies in the microsecond time range, J. Electroanal. Chem., 1992, 338, 269–278 CrossRef CAS.
- K. A. Goldsby, Symmetric and Unsymmetric Nickel(II) Schiff Base Complexes; Metal-Localized Versus Ligand-Localized Oxidation, J. Coord. Chem., 1988, 19, 83–90 CrossRef CAS.
- C. E. Dahm, D. G. Peters and J. Simonet, Electrochemical and spectroscopic characterization of anodically formed nickel salen polymer films on glassy carbon, platinum, and optically transparent tin oxide electrodes in acetonitrile containing tetramethylammonium tetrafluoroborate, J. Electroanal. Chem., 1996, 410, 163–171 CrossRef.
- M. Vilas-Boas, C. Freire, B. de Castro, P. A. Christensen and A. R. Hillman, New Insights into the Structure and Properties of Electroactive Polymer Films Derived from [Ni(salen)], Inorg. Chem., 1997, 36, 4919–4929 CrossRef CAS.
- L. Mao, K. Yamamoto, W. Zhou and L. Jin, Electrochemical Nitric Oxide Sensors Based on Electropolymerized Film of M(salen) with Central Ions of Fe, Co, Cu, and Mn, Electroanalysis, 2000, 12, 72–77 CrossRef CAS.
- G. N. Kamau, Surface preparation of glassy carbon electrodes, Anal. Chim. Acta, 1988, 207, 1–16 CrossRef CAS.
- G. Socrates, Infrared and Raman Characteristic Group frequencies, 3rd edn, John Wiley & Sons, 2004 Search PubMed.
- M. Hesse, H. Meier and B. Zeeh, Spektroskopische Methoden in der organischen Chemie, 4th edn, Thieme, 1991 Search PubMed.
- P. Yurkanis Bruice, Organic Chemistry, 6th edn, Pearson, 2010 Search PubMed.
Footnote |
| † Electronic supplementary information (ESI) available. See DOI: https://doi.org/10.1039/d2tc04372f |
| This journal is © The Royal Society of Chemistry 2023 |


