 Open Access Article
Tuning oxidative modification by a strong electric field using nanoESI of highly conductive solutions near the minimum flow rate†
Zhongbao
Han
,
Nozomu
Omata
,
Takeshi
Matsuda
,
Shoki
Hishida
,
Shuuhei
Takiguchi
,
Ryoki
Komori
,
Riku
Suzuki
and
Lee Chuin
Chen
 *
*
Faculty of Engineering, University of Yamanashi, 4-3-11, Takeda, Kofu, Yamanashi 400-8511, Japan. E-mail: leechuin@yamanashi.ac.jp; Tel: +81-55-220-8072
First published on 11th April 2023
Abstract
Oxidative modification is usually used in mass spectrometry (MS) for labeling and structural analysis. Here we report a highly tunable oxidation that can be performed in line with the nanoESI-MS analysis at the same ESI emitter without the use of oxidative reagents such as ozone and H2O2, and UV activation. The method is based on the high-pressure nanoESI of a highly conductive (conductivity >3.8 S m−1) aqueous solution near the minimum flow rate. The ion source is operated under super-atmospheric pressure (0.5 MPa gauge pressure) to avoid the contribution of electric discharge. The analyte at the tip of the Taylor cone or in the emitter droplet can be locally oxidized in an on-demand manner by varying the nanoflow rate. With an offline nanoESI, the degree of oxidation, i.e., the average number of incorporated oxygen atoms, can be finely tuned by voltage modulation using spray current as the feedback signal. Oxidations of easily oxidized residues present in peptides/proteins and the double bonds of the unsaturated phosphatidylcholine occur at low flow rate operation (<5 nL min−1) when the electric field at the tip of the Taylor cone and the initially produced charged droplet reaches approximately 1.3 V nm−1. The oxidized ion signal responds instantaneously to changes in flow rate, indicating that the oxidation is highly localized. Using isotope labeling, it was found that the incorporated oxygen primarily originates from the gas phase, suggesting a direct oxidation pathway for the analyte enriched on the liquid surface via the reactive oxygen atoms formed by the strong electric field.
Introduction
Electrospray ionization mass spectrometry (ESI-MS) is an indispensable analytical method for a wide range of compounds and biological samples. In ESI, the analyte-containing solution is dispersed electrically to produce charged micro/nanodroplets. The excess charges on the charged droplet are ultimately transferred to the solute, generating gaseous ions for mass spectrometry. Depending on the experimental conditions, ions owing to the incorporation of the oxygen atom (such as [M + nH + mO]n+) can appear along with their protonated ion species.1 Such oxidative modification of the analytes can be caused by (i) electrochemical reactions involved in the electrospraying process, and (ii) electric discharge (such as corona discharge) when the high voltage (HV) applied to the emitter is increased to a much higher than normal value.2,3For sustained electrospray, the continuous flow of the spray current involves electrochemical reactions (ECRs) at the liquid/electrode interface. The electrospray source can thus be regarded as a “special kind of electrolytic cell”.4 The adverse effects of ECR include corrosion of the electrode, change of pH, and oxidation of the analyte that result in artifacts in the mass spectra.5–7 Inert platinum electrodes are usually a preferred choice to avoid corrosion, and there are also ways to reduce the ECR effects by operating the ESI at a higher flow rate and the separation of ECR products from the ionization. The supposed “downside” of ESI oxidation has also been utilized for special-purpose analyses.3,8–12 For example, Cheng et al. used a Pd electrode to release the Pd cation to catalyze the Suzuki coupling reaction at room temperature during mass spectrometry analysis.8 Tang et al. identified the position of lipid C![[double bond, length as m-dash]](https://www.rsc.org/images/entities/char_e001.gif) C isomers and sn-isomers by combining two voltage-dependent electrochemical reactions, interfacial electro-epoxidation, and cobalt anodic corrosion in a single nano-ESI.9,12 Double bonds are widely present in biomolecules, and are a significant contributor to the spatial conformation of biomolecules. The efficient identification of the position and the number of double bonds in biomolecules is important in biochemistry as it helps reflect the misexpression of cells and other related information of metabolic diseases.
C isomers and sn-isomers by combining two voltage-dependent electrochemical reactions, interfacial electro-epoxidation, and cobalt anodic corrosion in a single nano-ESI.9,12 Double bonds are widely present in biomolecules, and are a significant contributor to the spatial conformation of biomolecules. The efficient identification of the position and the number of double bonds in biomolecules is important in biochemistry as it helps reflect the misexpression of cells and other related information of metabolic diseases.
Electric discharge (e.g., corona discharge) takes place when the potential at the ESI emitter or on the conductive liquid surface exceeds the threshold voltage for gaseous breakdown. The reactive oxygen species (ROS) generated by the discharge is known to cause oxidation of the analyte generated from ESI. Because the discharge could disrupt the stability of the electrospray and generate unwanted background ions, it usually needs to be avoided. A method like high-pressure ESI has been developed to prevent the discharge during the electrospraying of pure aqueous solutions.13 Nevertheless, the discharge has been generated alongside electrospray (with a higher HV) for the selective oxidation of the peptide, tagging the oxygen atom to easily oxidized residues such as Met, Trp, and Tyr of the peptide or protein.1 The oxidation effect was further enhanced by using oxygen as the nebulizing gas for ESI to increase the abundance of ROS in the plasma.14 The oxidation is also found to attack the C![[double bond, length as m-dash]](https://www.rsc.org/images/entities/char_e001.gif) C bond preferably, forming signature fragments when the oxidatively modified ion is subject to dissociative activation. This enables the determination of the double bond position for structural analysis of compounds.10 Selective epoxidation with discharge in combination with ESI tandem mass spectrometry has also been performed using AC paper spray with co-induced mild discharge,11 field-induced droplet ionization (FIDI) technique with the dielectric barrier discharge (DBD),15 co-spraying the sample with radical water ions generated from corona-discharge,16 and nanoESI with sample pretreatment with a low-temperature plasma (LTP) torch.17 Recently, it has been reported by Zare et al. that oxidation can take place even in the uncharged microdroplets, leading to the spontaneous generation of H2O2 from neutral spray,18 and condensation of water on a cooled substrate.19 Although there is a possibility that air-borne ozone might contribute to H2O2 formation,20,21 Zare et al. managed to reproduce the results in the absence of ozone.22 Simultaneous and spontaneous oxidation and reduction of phosphonates are also reported in microdroplets, and the active reagent is thought to be the free water radical cation and anion (H2O+˙ & H2O−˙).23,24 It is speculated that the high electric fields at the air–water interface, which can reach as high as 1 V nm−1 on the surface of the neutral microdroplet, are responsible for the unusual chemical transformations.25
C bond preferably, forming signature fragments when the oxidatively modified ion is subject to dissociative activation. This enables the determination of the double bond position for structural analysis of compounds.10 Selective epoxidation with discharge in combination with ESI tandem mass spectrometry has also been performed using AC paper spray with co-induced mild discharge,11 field-induced droplet ionization (FIDI) technique with the dielectric barrier discharge (DBD),15 co-spraying the sample with radical water ions generated from corona-discharge,16 and nanoESI with sample pretreatment with a low-temperature plasma (LTP) torch.17 Recently, it has been reported by Zare et al. that oxidation can take place even in the uncharged microdroplets, leading to the spontaneous generation of H2O2 from neutral spray,18 and condensation of water on a cooled substrate.19 Although there is a possibility that air-borne ozone might contribute to H2O2 formation,20,21 Zare et al. managed to reproduce the results in the absence of ozone.22 Simultaneous and spontaneous oxidation and reduction of phosphonates are also reported in microdroplets, and the active reagent is thought to be the free water radical cation and anion (H2O+˙ & H2O−˙).23,24 It is speculated that the high electric fields at the air–water interface, which can reach as high as 1 V nm−1 on the surface of the neutral microdroplet, are responsible for the unusual chemical transformations.25
This paper reports the oxidative modification of peptides, proteins, and lipids with unsaturated hydrocarbon chains that takes place when operating an offline high-pressure nanoESI of highly conductive aqueous solutions. This method is based on the precise nanoflow rate control of nanoESI using voltage modulation.26 The nanoESI is performed using a micropipette tip with an inner diameter of 0.4 mm but the solution flow rate is sustained in the order of nL min−1 on par with those using a fine glass-pulled capillary.27 The high stability of the aqueous Taylor cone under discharge-free conditions is maintained by operating the ion source under a super-atmospheric pressure. The abundance of the oxygen-incorporated ion species can be tuned by the applied voltage. But in contrast to the case where apparent discharge is co-generated with ESI, the most prominent oxidation takes place when the applied voltage is reduced to a value near its lowest, i.e., the spray current, solution flow rate, and the size of the precursor droplet are near their lowest value. Similarly, the formed Taylor cone is at its sharpest with the highest electric field. In this paper, the description of this oxidation phenomenon is given with comparisons to the oxidation by corona discharge, dielectric barrier discharge, in-emitter electrochemical reaction, and the nanoESI in the presence of ozone.
Experimental section
Ion source and instrument
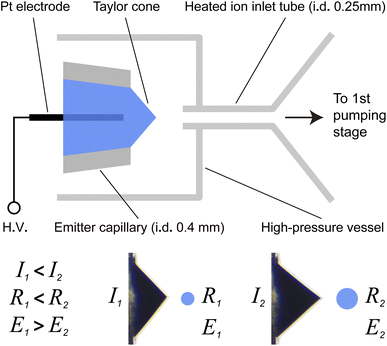
Fig. 1 shows the schematic of the high-pressure nanoESI ion source. The ion source is filled with compressed air with an operating gauge pressure of 0.5 MPa and a humidity of <10%. Polypropylene micropipette tips with a tip opening inner diameter of 0.4 mm (Eppendorf, Hamburg, Germany) were used as the ESI emitters. A platinum wire (dia: 0.2 mm) was used as the electrode to apply the high voltage (HV) to the solution. MS measurements were performed using a benchtop Orbitrap mass spectrometer (Thermo Fisher Scientific, Bremen, Germany). The ion source was coupled directly to the mass spectrometer using a custom-made ion transmission tube with 0.25 mm i. d. to match the acceptable gas throughput of the vacuum pump. The distance between the tip of the Taylor cone and the ion inlet was approximately 1 mm. When the ion source was pressurized, the pressure in the fore vacuum was ∼1 mbar, approximately the same as the original reading of the mass spectrometer under standard working conditions. The spray current flowing through a 1 MΩ sensing resistor was measured using a high-impedance OpAmp and digital multimeter.Sample preparation
Proteins, peptides, caffeine, and water-18O (97% atom) were purchased from Sigma Aldrich. Phosphatidylcholine was purchased from Fujifilm. 10-Acetyl-3,7-dihydroxyphenoxazine (ADHP) was purchased from Cayman Chemical. Hydrochloric acid, ammonium formate, ammonium acetate, and tetraethylammonium bicarbonate were from Kanto Chemical (Tokyo, Japan). All chemicals were used without further purification. The electrical conductivity of the solution was measured using a conductivity meter (Mettler Toledo). The 18O content for the isotope-labeled samples was greater than 87% atom.Results and discussion
Flow rate-dependent oxidation
To enable stable electrospray for highly conductive aqueous solutions without discharge, all measurements were performed under super-atmospheric conditions. The flow rate of the offline ESI emitter was controlled solely using the applied voltage. Under a steady cone–jet mode, the flow rate of the solution was estimated using the following equation.28 | (1) |
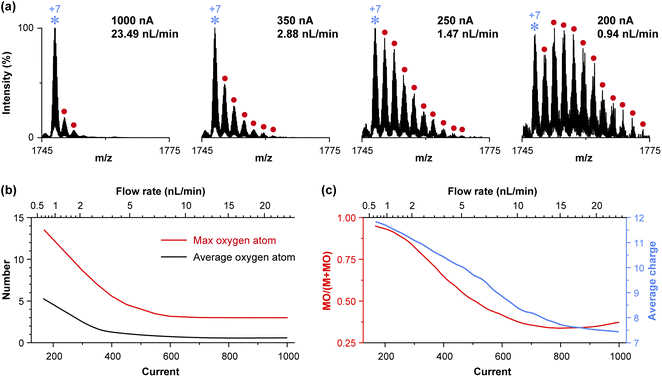
It was found that by increasing the conductivity of the solution to >3.8 S m−1 and by reducing the flow rate of the nanoESI to near its minimum value, the ion of the analyte was modified with the incorporation of oxygen atoms. The amount of incorporated oxygen, i.e., the degree of “oxidation” could be reproducibly adjusted by precision tuning of the applied voltage which in turn changes the spray current and the solution flow rate. Fig. 2a shows the magnified mass spectra for the charge state +7 of cytochrome c (cyto c) acquired from 1 M ammonium formate solution under different measured spray currents. Fig. 2b shows the variation of the average and the maximum number of oxygen atoms incorporated into cyto c for all charged states with the change of spray current. The average number of oxygen ![[m with combining macron]](https://www.rsc.org/images/entities/i_char_006d_0304.gif) is calculated using
is calculated using  , where m and n are the oxygen number and charge state, and Im,n is the corresponding peak area. The secondary x-axis shows the flow rate calculated using eqn (1). Here, the naturally present oxidized cyto c has an average of 0.6 oxygen atoms. Under the strongest oxidizing conditions at the lowest spray current, approximately 14 oxygens were found to attach to cyto c (Fig. S2†). Fig. 2c shows the ratio of total oxidized ion species to the total ion signal originating from cyto c. The percentage of the oxidized species could reach up to ∼90% of the TIC at the lowest spray current. The concentration of cyto c here was 25 μM. From the average oxygen number and the fraction, the concentration of reactive oxygen species generated should be at least ∼120 μM in terms of equivalent liquid phase concentration.
The oxidation was also accompanied by the denaturation of cyto c as indicated by the change of average charge state in Fig. 2c and the plot of the heatmap in Fig. S4a.† A higher charge state typically has a higher number of incorporated oxygens. It was reasonable as the unfolding of protein exposed more oxidizable amino acid residues to the ROS. It is worth noting that the unfolding of cyto c preceded the oxidation. The unfolding may be due to the strong electric field and/or the thermal effect caused by high spray current density at the tip of the Taylor cone. The degree of oxidation also varied with the type of proteins. Compared to cyto c, the highest degree of oxidation of ubiquitin in Fig. S3† was less pronounced. The average charge of ubiquitin also remained relatively constant at around 5.5, unaffected by the nanoflow rate (Fig. S3c†). These results suggest that the structure of ubiquitin is more rigid relative to cytochrome c. Table S1† shows the amino acid sequences of cytochrome c and ubiquitin. The amino acid residues of phenylalanine (F), tyrosine (Y), histidine (H), tryptophan (W), cysteine (C), and methionine (M) are generally considered to be susceptible to oxidation.29–33 Cytochrome c contains 16 easily oxidized amino acid residues, while ubiquitin has only 5. These numbers agreed with the maximum number of attached oxygens observed in Fig. 2 and S2.†
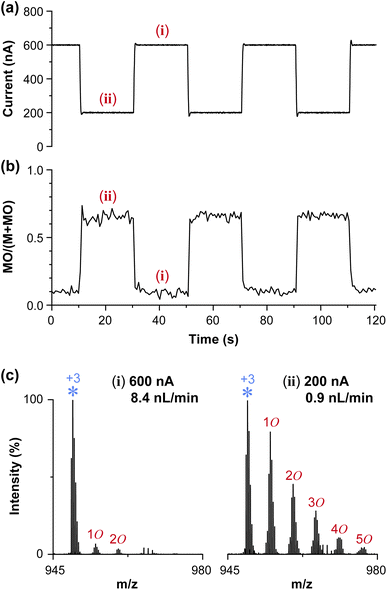
On-demand switching of oxidation
Fig. 3 shows the switching between nonoxidizing and oxidizing conditions by modulating the HV applied to the emitter. Using spray current as the feedback signal, the HV was feedback controlled with a personal computer using a custom program written in C# (source code in the ESI†). The spray current was step-modulated between 200 and 600 nA (Fig. 3a). The ratio of the EIC of the oxidized peak to the EIC of the non-oxidized peak responded near-instantly (in less than 1 s) to the spray current (Fig. 3b). This indicated that the oxidation was strongly dependent on the spray current, hence the flow rate. As the flow rate was switched to 8.4 nL min−1 from 0.9 nL min−1, the oxidized species also depleted immediately back to the mass spectrum shown in Fig. 3c(i) and (ii).It is well known that sustained electrospray is associated with the inherent electrochemical reaction (ECR), thus one may wonder if the ECR was involved in the observed oxidation. Here, an inserted platinum wire was used as the charging electrode, and the distance between the distal end of the electrode and the tip of the ESI emitter was approximately 10 mm. Under the operating flow rate of several to several tens nL min−1, it would take more than 10 minutes to transport the oxidation products generated by the ECR at the electrode to the Taylor cone. Likewise, it would take several minutes to consume the ECR product when the oxidation was turned OFF. The near instantaneous response of oxidation to the change in spray current provided clear evidence that the observed phenomenon was not relevant to ECR at the electrode. Instead, the oxidation was likely to take place at the tip of the Taylor cone, on/inside the charged droplets, or in the gas phase. It is noted that as the solutions used in this study were highly conductive, the spraying and the oxidation condition was not affected by the position of the platinum electrode.
Dependence on the electric field
The oxidation was believed to involve the reactive oxygen species (ROS). The formation of ROS here was not spontaneous, i.e., it needed external activation or energization. We hypothesize that the strong electric field on the tip of the Taylor cone or the surface of the initially charged droplet was responsible for the observed oxidation phenomenon. Under the condition near the lowest flow rate and spray current, the formed Taylor cone was the sharpest, generating the finest charged droplet. Here the correlation between the electric field and the threshold to induce oxidation was evaluated using cytochrome c in ammonium acetate and ammonium formate solutions of different electrical conductivities. The measurement began by operating the ESI under nonoxidizing conditions at a high current and high flow rate. The naturally occurring oxidized species detected at the high flow rate were defined as the baseline. The flow rate was gradually decreased by reducing the emitter voltage until the ion intensity of the total oxidized species accounted for 10% of the TIC of cytochrome c. The measured spray current at that point was assigned as the threshold current for the estimation of the electric field that triggers the oxidation. Following the scaling law,28 the radius of the initially produced charged droplet Ro can be approximated using28 | (2) |
 | (3) |
The value estimated using eqn (3) should reflect the order of magnitude of the electric field on the droplet surface as well as on the tip of the Taylor cone when the droplet was generated. In terms of spray current, Eo is
 | (4) |
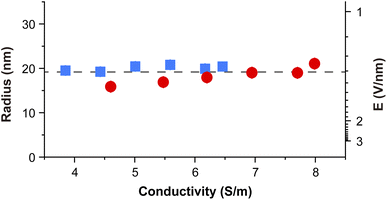
Depending on the electrical conductivity, the spray currents (or the flow rates) required to observe the oxidation were different. However, the plot of the radius Ro and electric field Eo in Fig. 4 shows an interesting result that the initialization of oxidation takes place at an average Ro of ∼19.2 nm and an Eo of 1.3 V nm−1, independent of the conductivity and the choice of the buffer solution. This suggested that the turn-on of oxidation was strongly linked to the electric field associated with the nanoESI.
One may argue that the phenomenon was identical to the commonly encountered corona discharge co-generated by the ESI at higher HV. An important discrepancy from the corona discharge-induced phenomenon was that the observed oxidation species were at their highest abundance at the lowest HV and spray current. Also, under the super-atmospheric pressure, an apparent corona discharge was absent as verified by microscopic inspection of the Taylor cone and the measurement of spray current. Still, the possibility of partial discharge could not be excluded because the current was at the same order of magnitude or lower than the electrospray current. We conjecture that despite the absence of apparent discharge, the local electric field was strong enough to accelerate electrons and ions in proximity to the liquid surface for the formation of reactive oxygen species. In the following sections, this oxidation taking place at a low flow rate is referred to as strong electric field-induced oxidation (SEFO). It is noted that the flow rate in eqn (2) or the spray current in eqn (4) cannot be reduced to an arbitrarily small value because to sustain a steady cone–jet mode, there exists a minimum flow rate Qmin which is given as28
 | (5) |
 | (6) |
Eqn (6) implies that for an aqueous solution at room temperature where γ = 0.072 N m−1, ρ = 997 kg m−3, εr = 80, it requires a minimum electrical conductivity of 2.3 S m−1 to attain the threshold electric field of 1.3 V nm−1 at the minimum flow rate. In practice, K needed to be greater than 3.8 S m−1 so that the operation above Qmin could still produce pronounced oxidation.
Oxidation of the molecular ion
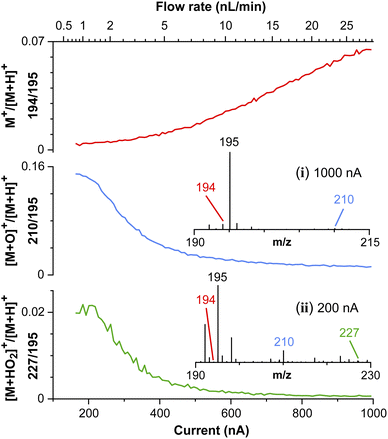
The strong electric field-induced oxidation of caffeine in Fig. 5 shows some unusual results not found in typical ESI measurements. The solvent here was 200 mM HCl aqueous solution with an electrical conductivity of ∼7 S m−1. Using a highly conductive solution, the molecular ion of caffeine (M+) was detected along with the protonated species ([M + H]+) at a relatively higher flow rate (10 nL min−1 < Q < 30 nL min−1). Although the detection of the molecular ion is common for electron ionization and field ionization, caffeine is usually detected almost solely as the protonated species using ESI or APCI. Due to the high electric field, the presence of M+ may indicate the presence of field ionization. Another possible ionization route is via charge transfer from the water radical cation which is reportedly present near/at the droplet–air interface under a strong electric field.24 The incorporation of oxygen into the molecular ion was also observed by decreasing the spray current to <10 nL min−1. The abundance of M+ was found to decrease with the rise of [M + O]+ at m/z 210, and [M + HO2]+ at m/z 227. The intensity ratios of M+/[M + H]+, [M + O]+/[M + H]+, and [M + HO2]+/[M + H]+ are shown, respectively in the subplots of Fig. 5.Comparison with other oxidation methods
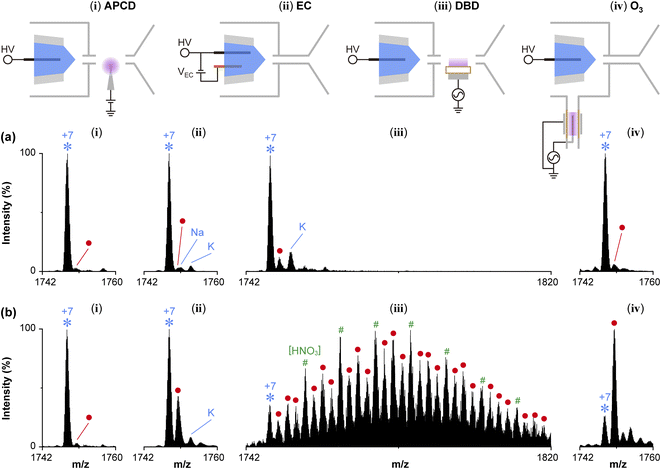
For comparison, the oxidation of cytochrome c was performed using various in situ oxidation devices operated together with the same nanoESI source. Fig. 6 shows the results of (i) atmospheric pressure corona discharge (APCD), (ii) in-emitter electrochemical (EC) reactor, (iii) dielectric barrier discharge (DBD), and (iv) ozone generated from DBD. Mass spectra in row (a) were taken when oxidation devices were in the initial OFF condition. Those in row (b) were taken after the oxidation devices were turned ON and sufficient time had passed for the ion signal to reach a steady state condition. For APCD in column (i), the result was taken by placing a corona discharge needle in between the high-pressure ion source outlet and the MS ion inlet. This arrangement which separated the ESI source from the discharge source was chosen to preserve the stability of the electrospray. The discharge current was >10 μA. Surprisingly, no obvious oxidation was observed. Possible explanations are a low concentration of ROS and poor interaction between the charged droplets/ions and the ROS. The repulsive force may prevent the charged droplet from approaching the ROS-rich high electric field region. Changing the polarity of the corona discharge shifted the charge state distribution to a low charge without any improvement in the oxidation performance. Fig. S5† shows another APCD measurement in which the corona discharge was co-generated at the stainless-steel emitter of an atmospheric pressure ESI source. The HV was increased up to the level before the fluctuation of the spray but only a weak oxidation peak was detected.Column (ii) shows the electrochemical oxidation performed inside the capillary of the emitter. In addition to the primary HV electrode for electrospray, another wire with insulator cladding was inserted into the ESI capillary as the second electrode. A ∼3 V potential difference was applied between those electrodes. The HV electrode was the cathode and the second electrode was the anode. The choice of the second electrode was important to prevent anodic oxidation and the formation of metal ions in abundance (Fig. S6†). Mass spectra in Fig. 6(ii) were taken using a platinum wire with Teflon cladding as the second electrode. After turning ON of the EC cell, the oxidation peak increased gradually and reached a steady state after 20 min. Only one oxygen attachment was observed.
Dielectric barrier discharge was used as shown in Fig. 6(iii) by placing the DBD source in between the ion source and the MS inlet. Glass was used as the barrier material. The discharge current for DBD was in the order of mA, significantly higher than the corona discharge source in (i), and the odor of ozone can be felt from 1 m away from the source. The degree of oxidation was much higher than corona discharge (i) and SEFO, well exceeding the number predicted by Table S1.† However, the tunability for the degree of oxidation using this method was not easy and the mass spectrum was complicated by the presence of adduct species such as n(HNO3). Fig. 6 column (iv) shows the oxidation by ozone generated from the DBD. A cylindrical DBD source made of a quartz tube was added in between the ion source and the gas supply line. The positive and negative ions from the DBD were annihilated by the metallic transfer tube and the inner wall of the ion source. This was verified by the observation that no background ion was detected when the DBD was turned ON, and ESI was turned OFF. By electrospraying the solution in the ozone-containing air, the oxidation peak gradually appeared and the intensity reached a plateau after ∼5 min. The most dominant oxidation peak was the one with 1 oxygen atom. Even when the DBD was turned OFF, it took approximately 30 min for the mass spectrum to return to the oxidation-free condition, greatly exceeding the time needed to flush the ozone. This indicated that ozone has dissolved into the solution phase via the Taylor cone.
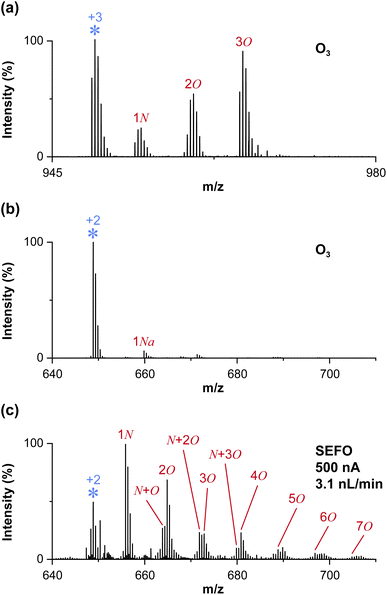
Another comparison with ozone oxidation is shown in Fig. 7 for peptides. The mass spectrum of the ozone-oxidized melittin in Fig. 7a shows a dominant peak with the incorporation of three oxygen atoms. The finding by Richards et al. also showed that the ozonated protein exhibits a predominant peak with a three-oxygen adduct.33 The result of SEFO (Fig. 3c(ii)), however, shows a different oxygen distribution. The ion with the incorporation of one nitrogen was also detected which might be due to the interaction with other neutral species from DBD. The distributions of oxygen generated from ozone and SEFO were obviously quite different. Another measurement was performed using angiotensin I which was reportedly not to be oxidized by ozone.33 The same finding was reproduced in our experiment (Fig. 7b) using ozone from DBD. Fig. 7c shows that the oxidation of angiotensin I was still possible by SEFO. In sum, the result in Fig. 7 suggests that the main ROS involved in the SEFO was not ozone.
Source of oxygen atoms
The source of oxygen atoms attached to the analytes depends on the origin of ROS, and the subsequent interaction with the water and the analytes. If the phenomenon is discharge-like, the formation of ROS should take place in the gas phase. On the other hand, the strong electric field established by the microdroplet electrical double layer (also reported to be in the order of 1 V nm−1) was recently postulated by Zare and others to generate hydroxyl radicals in the liquid phase which contributed to the observed spontaneous formation of hydrogen peroxide.25,34 Isotope labeling method was used to determine the origin of the oxygen atom. The analyte was L-phosphatidylcholine (PC 18![[thin space (1/6-em)]](https://www.rsc.org/images/entities/char_2009.gif) :
:![[thin space (1/6-em)]](https://www.rsc.org/images/entities/char_2009.gif) 1/18
1/18![[thin space (1/6-em)]](https://www.rsc.org/images/entities/char_2009.gif) :
:![[thin space (1/6-em)]](https://www.rsc.org/images/entities/char_2009.gif) 1) with two double bonds (one at each fatty acid chain). Two sets of water solutions were used. One was prepared in normal pure water and another was prepared in H218O (97% atom). The measurement was performed using air and pure nitrogen as the operating gases for the ion source.
1) with two double bonds (one at each fatty acid chain). Two sets of water solutions were used. One was prepared in normal pure water and another was prepared in H218O (97% atom). The measurement was performed using air and pure nitrogen as the operating gases for the ion source.
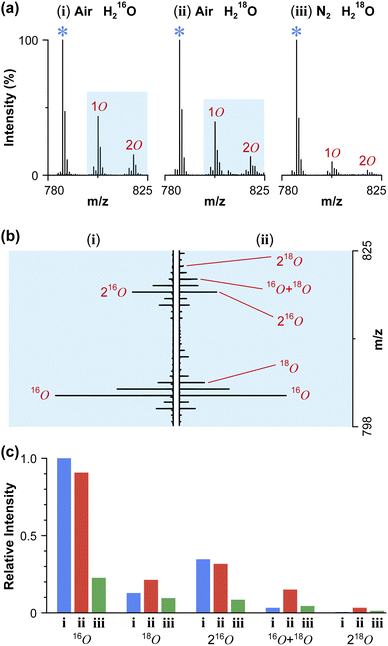
The mass spectra acquired using normal water solution and air are shown in Fig. 8a(i) and b(i). Two dominant oxidation peaks were detected owing to the preferential attack of the double bond.26 The result obtained using a water-18O solution with air as the operating gas is shown in Fig. 8a(ii) and b(ii). The magnified mass spectrum in 8b shows that even with water-18O, the dominant oxidation peaks were due to those of [M + H + 16O]+ and [M + H + 216O] +. Ion species of [M + H + 18O]+, [M + H + 16O + 18O] +, and [M + H + 218O]+ were detectable but with much weaker ion intensities (see intensity comparison in Fig. 8c). Changing the operating gas to high-purity nitrogen (99.99995%) reduced the intensity of the oxidation peak as shown in Fig. 8a(iii) and 8c. Even under that condition, the oxidation was still dominated by 16O. A similar result was also observed for the melittin sample prepared in water-18O (Fig. S7†).
With sufficient acceleration of seed electrons near the charged liquid surface, the oxygen molecules in the proximity could be split into oxygen atoms which could eventually form ozone when combined with other oxygen molecules. Although the contribution by the ozone in SEFO could not be completely ruled out, the mass spectra obtained using external ozone (Fig. 7a, b and 6(iv)) clearly showed that it was not the primary oxidation route. The ozone and/or the split oxygen atoms could react with the water to form hydroxyl radicals (˙OH). The detection of 18O-related peaks in the water-18O sample supports the formation of 18˙OH. The detection of H2O2 (which can be formed by ˙OH) in Fig. S8† also supports the formation of hydroxyl radicals. However, despite its presence, the low abundance of 18O-related ions indicated that the hydroxyl radical oxidation was unlikely the main oxidation route in SEFO because the reaction of gas phase oxygen species with water-18O should result in equal amounts of 18˙OH and 16˙OH. In sum, the primary source of oxygen in the SEFO was the gas phase 16O2, suggesting a possibility of direct oxidation of analytes by the oxygen atoms generated by the strong electric field. It is noted that oxidation by the atomic oxygen generated from the atmospheric plasma was also reported to be possible for the analyte in the solution.35
Discussion
In summary, the initial size of the droplet, hence the strength of the electric field were the key factors influencing the degree of oxidation. Following eqn (6), a solution needed to have sufficient electrical conductivity to attain a strong electric field. The three aqueous solutions (ammonium acetate, ammonium formate, and HCl) tested in this study were highly conductive but still volatile and friendly to ESI without producing salt clusters. The highest electric field was attained by the most conductive 500 mM HCl aqueous solution (K = 16.4 S m−1). The jet and initial droplets generated from those solutions were smaller than the optical wavelength, therefore invisible under an optical microscope at all tested flow rates. For example, see Movie 1† in the ESI† for the electrospray of 1 M ammonium formate solution (K = 8.67 S m−1) under different spray currents. For comparison, Movie 2† shows the electrospray of 1 mM ammonium formate solution that emits a jet with a diameter of ∼1 μm. In the latter case, no oxidation could be observed at any flow rate.Regarding the accelerated redox reactions found to take place in the sprayed aqueous microdroplets, two types of water-originated reactants have been proposed. One is hydroxyl radicals generated from the hydroxide.36 Another is the free water radical cations & radical anions generated from the dissociation of the radical cation/anion pair.23,24 Similar to the present study, the formation of the reactants was believed to require a strong electric field at the aqueous microdroplet–air interface. The oxidation by the hydroxyl radical reported by Zare et al.36 used a pneumatic sprayer with a broad distribution of droplet size in the order of micrometers. The redox by water radical ions reported by Cooks et al.23,24 was performed by spraying acetonitrile solution with a trace amount of water using a nanoESI emitter with 5 μm i. d. Owing to the low electrical conductivity (K < 1 mS m−1) of acetonitrile, the initial droplet produced by the cone–jet mode should also be in the micrometer scale but not larger than 5 μm. Both studies by Zare and Cooks showed that the oxidation response increased with the emitter–ion inlet distance (or the droplet flight time). For the oxidation observed in this study, however, the generation of initial droplets of nanometer size was crucial. Due to the short lifetime of such droplets, increasing the emitter–inlet distance from the default 1 mm to >5 mm was not found to produce any effect on the degree of oxidation and the threshold Eo, except for causing a higher voltage to form the Taylor cone and a drop in overall ion intensity. In sum, although the oxidation by the water-originated reactive species (such as hydroxyl radical and/or water radical cation) could not be excluded in our experiment, they were unlikely to be the main contributor as the majority of the incorporated oxygens originated from the gas phase. By using 99.5% oxygen as the operating gas for the ion source, the average number of oxygens attached to the protein was also found to increase (Fig. S9†), supporting the contribution from the gas phase oxygen. The gas phase ROS could react directly with the analyte at the liquid–gas interface which was partially exposed to the gas phase.
Ozone is the common ROS formed by electric discharge but the oxidation pattern and characteristics were different from those when ozone was intentionally introduced. We, therefore, propose the primary oxidant to be the oxygen atoms which are the precursor of ozone generated from the splitting of oxygen induced by the strong electric field. While the average number of oxygen atoms incorporated into the analyte could be tuned by the emitter voltage, we have not attained 100% oxidation. For example, the result of PC 18![[thin space (1/6-em)]](https://www.rsc.org/images/entities/char_2009.gif) :
:![[thin space (1/6-em)]](https://www.rsc.org/images/entities/char_2009.gif) 1/18
1/18![[thin space (1/6-em)]](https://www.rsc.org/images/entities/char_2009.gif) :
:![[thin space (1/6-em)]](https://www.rsc.org/images/entities/char_2009.gif) 1 in Fig. 8a still shows a significant abundance of unoxidized PC. Replacing the air with 99.5% oxygen, and optimizing the ion source pressure to ∼0.3 MPa shows an improvement in the percentage of oxidation from ∼40% to ∼80% (Fig. S10†). There was a drop in ion intensity due to a lower gas intake as the ion transmission tube in this work was optimized for 0.5 MPa. Nevertheless, it was an indication that further improvement in oxidation efficiency was still possible.
1 in Fig. 8a still shows a significant abundance of unoxidized PC. Replacing the air with 99.5% oxygen, and optimizing the ion source pressure to ∼0.3 MPa shows an improvement in the percentage of oxidation from ∼40% to ∼80% (Fig. S10†). There was a drop in ion intensity due to a lower gas intake as the ion transmission tube in this work was optimized for 0.5 MPa. Nevertheless, it was an indication that further improvement in oxidation efficiency was still possible.
The present method also shared a similarity with the electro-epoxidation with nanoESI (EEnanoESI) by Yan et al. in a way that the oxidation is controlled by the emitter potential.9 While their process involved electrochemical reactions (ECRs), the ECR was not relevant to our study. The oxidation effect was also observed using an ECR-free all-insulator bipolar ESI emitter.37 Regarding the spraying mode, their microscopic image indicated that the liquid meniscus was in a high-frequency oscillation and the flow rate was approximately 100 nL min−1. In our case, typical flow rates were below 5 nL min−1, and it was under the well-characterized steady cone–jet mode. Interestingly, EEnanoESI required a capillary with a large i. d. (75 μm) for the electro-epoxidation to occur. Coincidentally, this study also used an emitter with a large i. d. (0.4 mm) by default, but that was adopted for convenience and reproducibility. Measurements using smaller emitter capillaries with i. d. of 20 and 5 μm exhibited the same oxidation phenomena, and for a given solution, the thresholds of oxidation were observed at approximately the same spray current, regardless of the emitter size. The result obtained using the 5 μm capillary (purchased from Humanix, Hiroshima, Japan) is shown in the ESI (Fig. S11†). It is noted that for fine capillaries, it is necessary to avoid the high-frequency pulsation mode because eqn (1), (2) and (4)–(6) are valid only for the steady cone–jet mode.
Conclusion
We have demonstrated an efficient oxidation method that relies on the strong electric field on the surface of a charged droplet or at the tip of a Taylor cone. The degree of oxidation was highly tunable by varying the flow rate of the electrospray, hence changing the size of the initial charge droplet and the radius of curvature at the tip of the Taylor cone. On-demand oxidation was performed by precision tuning of the nano-flow rate using HV modulation with spray current as the feedback signal. The response of oxidation to the measured spray current was almost instantaneous. Using the scaling laws for electrospray, the threshold electric field to induce the oxidation was found to be in the order of 1 V nm−1. The isotope labeling showed that the oxygen atoms originated from the gas phase. Ozone is commonly produced in electrical discharge but it was found not to be the final reactive oxygen species that reacted with the analytes. We postulate that the split oxygen atoms generated by electron activation under the strong electric field reacted directly with the analytes to form the observed dominant oxidation species. The oxygen atom and the cogenerated ozone also reacted with water to form hydroxy radicals. The controlled oxidation can find application in the labeling of the analyte and the selective fragmentation that targets the oxygen-labeled location for structural analysis. As the present method only requires high electrical conductivity, the buffer solutions commonly used in the native electrospray to maintain a near physiological pH can be employed directly to perform native ESI-MS and oxidation analysis on the same sample in a single emitter. The use of electric field strength, which can be estimated from the spray current, as the universal control parameter also improves the reproducibility across different emitters and solvent systems.Data availability
The data supporting the findings of this study are available within the article and in the ESI.†Author contributions
Conceptualization & methodology: Z. H., L. C. C.; investigation & visualization: Z. H., N. O., T. M., S. H., S. T., R. K., R. S.; writing: Z. H., L. C. C.; supervision & funding: L. C. C.Conflicts of interest
There are no conflicts to declare.Acknowledgements
This work was partially supported by Grants-in-Aid for Scientific Research (KAKENHI) from the Japan Society for the Promotion of Science. Z. H. acknowledges the financial support from the China Scholarship Council (CSC).References
- K. Morand, G. Talbo and M. Mann, Rapid Commun. Mass Spectrom., 1993, 7, 738–743 CrossRef CAS PubMed.
- J. Pei, C.-C. Hsu, K. Yu, Y. Wang and G. Huang, Anal. Chim. Acta, 2018, 1011, 59–67 CrossRef CAS PubMed.
- B. L. Boys, M. C. Kuprowski, J. J. Noël and L. Konermann, Anal. Chem., 2009, 81, 4027–4034 CrossRef CAS PubMed.
- A. T. Blades, M. G. Ikonomou and P. Kebarle, Anal. Chem., 1991, 63, 2109–2114 CrossRef CAS.
- L. Konermann, E. A. Silva and O. F. Sogbein, Anal. Chem., 2001, 73, 4836–4844 CrossRef CAS PubMed.
- F. He, C. L. Hendrickson and A. G. Marshall, J. Am. Soc. Mass Spectrom., 2000, 11, 120–126 CrossRef CAS PubMed.
- M. Chen and K. D. Cook, Anal. Chem., 2007, 79, 2031–2036 CrossRef CAS PubMed.
- H. Cheng, T. Yang, M. Edwards, S. Tang, S. Xu and X. Yan, J. Am. Chem. Soc., 2022, 144, 1306–1312 CrossRef CAS PubMed.
- S. Tang, H. Cheng and X. Yan, Angew. Chem., Int. Ed., 2020, 59, 209–214 CrossRef CAS PubMed.
- M. C. Thomas, T. W. Mitchell and S. J. Blanksby, J. Am. Chem. Soc., 2006, 128, 58–59 CrossRef CAS PubMed.
- L. Wan, G. Gong, H. Liang and G. Huang, Anal. Chim. Acta, 2019, 1075, 120–127 CrossRef CAS PubMed.
- S. Tang, X. Chen, Y. Ke, F. Wang and X. Yan, Anal. Chem., 2022, 94, 12750–12756 CrossRef CAS PubMed.
- L. C. Chen, M. K. Mandal and K. Hiraoka, J. Am. Soc. Mass Spectrom., 2011, 22, 539–544 CrossRef CAS PubMed.
- S. D. Maleknia, M. R. Chance and K. M. Downard, Rapid Commun. Mass Spectrom., 1999, 13, 2352–2358 CrossRef CAS PubMed.
- X. Zhang, K. M. Barraza, K. T. Upton and J. L. Beauchamp, Chem. Phys. Lett., 2017, 683, 76–82 CrossRef CAS.
- X. Zhang, X. Ren, K. Chingin, J. Xu, X. Yan and H. Chen, Anal. Chim. Acta, 2020, 1139, 146–154 CrossRef CAS PubMed.
- W. Cao, X. Ma, Z. Li, X. Zhou and Z. Ouyang, Anal. Chem., 2018, 90, 10286–10292 CrossRef CAS PubMed.
- J. K. Lee, K. L. Walker, H. S. Han, J. Kang, F. B. Prinz, R. M. Waymouth, H. G. Nam and R. N. Zare, Proc. Natl. Acad. Sci. U. S. A., 2019, 116, 19294–19298 CrossRef CAS PubMed.
- J. K. Lee, H. S. Han, S. Chaikasetsin, D. P. Marron, R. M. Waymouth, F. B. Prinz and R. N. Zare, Proc. Natl. Acad. Sci. U.S.A., 2020, 117, 30934–30941 CrossRef CAS PubMed.
- N. H. Musskopf, A. Gallo, P. Zhang, J. Petry and H. Mishra, J. Phys. Chem. Lett., 2021, 12, 11422–11429 CrossRef CAS PubMed.
- A. G. Jr, N. H. Musskopf, X. Liu, Z. Yang, J. Petry, P. Zhang, S. Thoroddsen, H. Im and H. Mishra, Chem. Sci., 2022, 13, 2574–2583 RSC.
- M. A. Mehrgardi, M. Mofidfar and R. N. Zare, J. Am. Chem. Soc., 2022, 144, 7606–7609 CrossRef CAS PubMed.
- L. Qiu, M. D. Psimos and R. G. Cooks, J. Am. Soc. Mass Spectrom., 2022, 33, 1362–1367 CrossRef CAS PubMed.
- L. Qiu and R. G. Cooks, Angew. Chem., 2022, 134, e202210765 Search PubMed.
- H. Xiong, J. K. Lee, R. N. Zare and W. Min, J. Phys. Chem. Lett., 2020, 11, 7423–7428 CrossRef CAS PubMed.
- Z. Han and L. C. Chen, Anal. Chem., 2022, 94, 16015–16022 CrossRef CAS PubMed.
- Z. Han and L. C. Chen, J. Am. Soc. Mass Spectrom., 2022, 33, 491–498 CrossRef CAS PubMed.
- J. Fernández de la Mora and I. G. Loscertales, J. Fluid Mech., 1994, 260, 155–184 CrossRef.
- T. Kotiaho, M. N. Eberlin, P. Vainiotalo and R. Kostiainen, J. Am. Soc. Mass Spectrom., 2000, 11, 526–535 CrossRef CAS PubMed.
- G. Xu and M. R. Chance, Anal. Chem., 2005, 77, 2437–2449 CrossRef CAS PubMed.
- J. A. Lloyd, J. M. Spraggins, M. V. Johnston and J. Laskin, J. Am. Soc. Mass Spectrom., 2006, 17, 1289–1298 CrossRef CAS PubMed.
- V. K. Sharma and N. J. D. Graham, Ozone: Sci. Eng., 2010, 32, 81–90 CrossRef CAS.
- N. B. Borotto and T. K. Richards, J. Am. Soc. Mass Spectrom., 2022, 33, 2078–2086 CrossRef CAS PubMed.
- D. Xing, Y. Meng, X. Yuan, S. Jin, X. Song, R. N. Zare and X. Zhang, Angew. Chem., 2022, 134, e202207587 Search PubMed.
- J. Benedikt, M. M. Hefny, A. Shaw, B. R. Buckley, F. Iza, S. Schäkermann and J. E. Bandow, Phys. Chem. Chem. Phys., 2018, 20, 12037–12042 RSC.
- D. Gao, F. Jin, J. Kyoo Lee and R. N. Zare, Chem. Sci., 2019, 10, 10974–10978 RSC.
- Z. Han, R. Komori, R. Suzuki, N. Omata, T. Matsuda, S. Hishida, T. Shuuhei and L. C. Chen, J. Am. Soc. Mass Spectrom., 2023, 34, 728–736 CrossRef CAS PubMed.
Footnote |
| † Electronic supplementary information (ESI) available. See DOI: https://doi.org/10.1039/d2sc07113d |
| This journal is © The Royal Society of Chemistry 2023 |

