 Open Access Article
Raman spectroscopy investigation of magnesium oxide nanoparticles
Maria Dekermenjian *a,
Andreas Peter Ruedigerb and
Alexandre Merlen
 c
c
aINRS-EMT, Varennes, Canada. E-mail: maria.dekermenjian@inrs.ca
bINRS, Quebec, Canada. E-mail: andreas.ruediger@inrs.ca
cUniversité de Toulon Laboratoire MAPIEM, Toulon, France. E-mail: merlen@univ-tln.fr
First published on 6th September 2023
Abstract
We investigate Raman spectra (100 cm−1 to 3900 cm−1) of magnesium oxide nanoparticles with nominal sizes of 10 nm, 20 nm, 40 nm, 50 nm, and 300 nm. The crystal structure of MgO prohibits first-order modes and yet, there are numerous reports of relatively intense peaks throughout the literature. Raman signals at approximately 278 cm−1 and 445 cm−1 that were attributed to MgO nanoparticles by previous authors are shown to belong to layers of Mg(OH)2 formed on the surface of MgO nanoparticles. Through an annealing process at 400 °C in an O2 atmosphere, we observe that modes in the 3700 cm−1 spectral region, which are a signature of OH groups, disappear together with modes at 278 cm−1 and 445 cm−1, thus establishing a necessary criterion to associate all of these peaks to the presence of OH groups on the surface.
Introduction
Magnesium oxide forms highly stable crystals with face-centered cubic structure and space group Fm3m. In its nanoparticle form, thanks to a substantial surface-to-volume ratio, the surface adsorptive properties per weight become large leading to many applications.1 For instance, MgO nanoparticles are applied in purification of fresh water and the treatment of wastewater as they have excellent adsorptive properties with respect to e.g. Cd(II) and Pb(II).1,2 When MgO nanoparticles are poured into aqueous environments containing these metals, the concentration of unbound contaminants decreases drastically. Nano-powdered magnesium oxide also has antibacterial properties in such a way that it is employed to deactivate bacteria, i.e. Escherichia coli and Staphylococcus.1,3 The specific surface chemistry has therefore attracted attention since the earliest observations of these effects.Optical Raman properties of MgO single crystal are well-known: bulk MgO has a very large optical bandgap of approximately 7.8 eV (ref. 4) and is inactive in first-order Raman scattering because of its rocksalt structure.5 Nevertheless, many authors report Raman modes in MgO micro- and nanoparticles that they attribute to first-order scattering (one photon – one phonon).6–9 Table 1 exemplifies the contribution of authors who worked on Raman properties of MgO nanoparticles. For instance, Ishikawa et al. who investigated optical Raman properties of MgO nanoparticles report first-order Raman modes at 280 cm−1, 446 cm−1, 1088 cm−1, and 1120 cm−1 observable in MgO nanoparticles sized from 30 nm to 3000 nm.6 They suggested that the forbidden bulk Raman modes of MgO single crystal become active because the size of the nanoparticles allowed the selection rules to relax. Their consideration was based on the numerically determined phonon density of states that peaks around 280 cm−1 and 460 cm−1 (Fig. 1b) but that requires momentum to become accessible in the zone centre. So far, there is no experimental evidence for that size-dependent surface relaxation to occur in MgO.
| Author | Ishikawa et al.6 | Böckelmann et al.11 | Morozov et al.9 | Kim et al.7 | Sangster et al.10 |
| Experiment | Raman spectroscopy on MgO nanoparticles | Raman spectroscopy on MgO nanoparticles | Raman spectroscopy on MgO nanoparticles | Raman spectroscopy on MgO nanoparticles | Phonon dispersion relation measured by inelastic neutron scattering |
| TA mode at X | 280 | — | 275 | 290 | ∼300 |
| TO mode at Γ | 446 | — | 448 | 448 | ∼393 |
| LO mode at Γ | — | — | 960 | — | ∼722 |
| LA mode at X | — | — | 370 | — | ∼410 |
| Surface modes | 1080 | — | 1080, 1120 | 1080, 1121 | — |
| Other detected peaks | 1120 | 595, 719, 978, and 1096 | 560 | — | — |
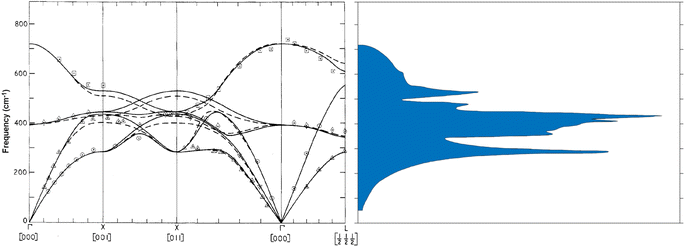 | ||
| Fig. 1 (a) Phonon dispersion diagram calculated by inelastic neutron scattering for MgO bulk. The solid and the dashed lines correspond to two different models the authors used to model the experimental data. (b) Phonon density of states associated with the dispersion diagram. (from ref. 10 DOI: 10.1088/0022-3719/3/5/017 © IOP Publishing. Reproduced with permission. All rights reserved.) | ||
Before Ishikawa, Sangster et al. had determined the phonon dispersion relation of MgO single crystal by inelastic neutron scattering measurements.10 Ishikawa et al. compared their own observed Raman modes to the phonon density of states MgO single crystal (Fig. 1) measured by Sangster et al., and they attribute the 280 cm−1 mode to TA phonon at the zone boundary X, which occurs at 301 cm−1 whereas the 446 cm−1 mode is ascribed to the TO zone center mode at 393 cm−1 in the phonon density of states (Fig. 1). Phonons other than those in the zone center do not respect momentum conservation of first order processes. Moreover, as regards the second attribution, there is a significant deviation (13.2%) between the value 446 cm−1 observed on the Raman spectrum and the 393 cm−1 mode on the dispersion relation. Not to mention that the peak at 1088 cm−1 is attributed to a surface mode since there is no trace of it in the phonon dispersion relation, even though surface modes are known to appear in the TO–LO phonon gap, which is not the case here. As for the peak at 1120 cm−1, no explanation is provided.
Morozov et al. observe even more peaks: 275 cm−1, 370 cm−1, 448 cm−1, 560 cm−1, 960 cm−1, 1080 cm−1, and 1120 cm−1 regarding experimental Raman measurements on MgO nanoparticles.9 They assign the peaks at 275 cm−1, 448 cm−1, 1080 cm−1, and 1120 cm−1 the same way as Ishikawa. Morozov et al. claim the peak at 370 cm−1 to be the LA phonon mode on the dispersion curve (Fig. 1a), but one can see that the LA mode at 370 cm−1 is rather at the zone boundary X, so that if this process would occur, momentum would again not be conserved. The authors ascribe the modes at 1080 cm−1 and 1120 cm−1 to surface modes although they are not in the TO-LO gap. As for the mode at 960 cm−1, Morozov attributes it to the LO mode (722 cm−1) on the dispersion diagram although there is a substantial deviation with that mode.
Böckelmann and his team synthesized MgO nanoparticles of two size distributions (30 nm et 60 nm) by three different methods.11 Raman spectroscopy of MgO nanoparticles that have an average size of 30 nm have shown modes at 595 cm−1, 719 cm−1 and 1096 cm−1, regardless of the synthesis method, whereas those that have an average size of 60 nm gave Raman modes at 592 cm−1 and 1088 cm−1. Until this day, none of the modes 595 cm−1 and 592 cm−1 seems to be reported by another author as far as MgO nanoparticles are concerned. The cause of Raman mode at 978 cm−1, which can be found on the spectrum of some of their microcrystals of MgO, is not clear.
Kim et al. obtained the same Raman peaks as Ishikawa for MgO nanoparticles.7 They attribute the peaks the same way as Ishikawa, except for the peak at 1121 cm−1, which they consider to be a surface phonon mode.
Apart from MgO nanoparticles, MgO in other forms and shapes (nanotubes, nanocubes of a variety of sizes) as well as thin films of MgO have other phonon modes that have been identified.12–14 Some of these modes were dependent on the size and shape12,13,15,16 while other modes were rather constant and identified as surface phonon modes.6–9 It is understandable that until this day the assignment of Raman peaks of MgO nanoparticles is still under debate. The temptation to invoke a correlation with the phonon density of states (PDOS) as illustrated in Fig. 1b is understandable as it predicts a strong probability to activate modes via the relaxation of momentum preservation. Because Raman properties of MgO nanoparticles are subject to many discussions and inconsistencies, not to mention that authors have divergent views on the matter, the scope of this work is to shed light on Raman properties of MgO nanoparticles by clarifying some of the peaks obtained, and by explaining the effects that cause them. The key will be to carefully distinguish between pure magnesium oxide and “nominally pure” magnesium oxide and to take into consideration its strong hygroscopic nature.
Experimental methods
High purity MgO nanoparticles (99+%) of different nominal sizes (10 nm, 20 nm, 40 nm, 50 nm, and 300 nm) were purchased from US Research Nanomaterials Inc. The nanoparticles have been synthesized by combustion method from magnesium metal ingot. The nanoparticles' sizes are the nominal sizes that is only a label to identify them, as a thorough analysis on their size distributions has not been made in this paper. Transmission electronic microscopy (TEM) images were acquired using a JEOL JEM-2100F transmission electron microscope with a Schottky field-emission gun operated at 200 kV. Sample preparation for TEM was made by dispersing a small amount of MgO nanoparticles in 1 mL of methanol by ultrasonication. TEM images of nominal size 50 nm are represented on Fig. 2. MgO has a face-centered cubic structure with primitive and conventional cells as depicted on Fig. 2c.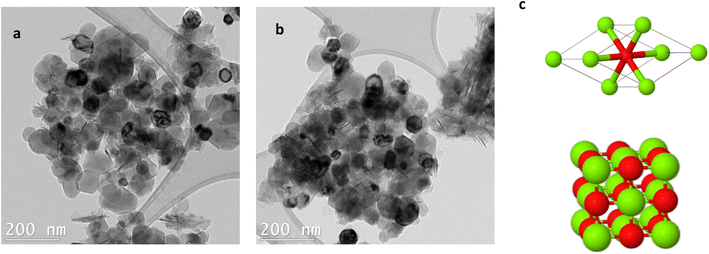 | ||
| Fig. 2 (a) and (b) are TEM images of MgO nanoparticles of nominal size 50 nm. (c) Primitive cell (top) and conventional cell (bottom) of MgO nanoparticles. Green atoms are Mg2+; red atoms are O2−. | ||
Raman spectra were obtained on a Horiba spectrometer (iHR320) system with a linearly polarized continuous wave DPSS laser (Cobolt 04-01, of wavelength 473 nm, TEM 00, 25 mW), objective of 50× (Olympus, LMPLFLN) with numerical aperture of 0,50. All spectra were acquired with a CCD detector 1024 × 256 pixel (Horiba Synapse BIDD) with 2400 l mm−1 grating for some of the spectra (approximately 1 cm−1 hardware resolution), and 1200 l mm−1 for others (approximately 2,4 cm−1 hardware resolution). The power of the laser before our sample was about 14 mW for all spectra. All spectra were acquired in backscattering geometry without analyzer. The exposition time varied from 120 to 360 seconds, and the number of spectra acquired for averaging (accumulation) varied from 3 to 5 depending on each sample in order to get the best signal-to-noise ratio. The calibration was made with a xenon lamp (Ocean Optics, XE-1 Xenon Calibration light source, 916–1984 nm) and a numerical baseline subtraction.
X-ray powder diffraction (XRD) measurements were made using a diffractometer Bruker D8 Advance (from Bruker AXS, Inc.) with an X-ray beam of 40 kV generated by a Cu Kα1 (15![[thin space (1/6-em)]](https://www.rsc.org/images/entities/char_2009.gif) 406 Å) and a Kα2 (15
406 Å) and a Kα2 (15![[thin space (1/6-em)]](https://www.rsc.org/images/entities/char_2009.gif) 444 Å) sources with a ratio 2
444 Å) sources with a ratio 2![[thin space (1/6-em)]](https://www.rsc.org/images/entities/char_2009.gif) :
:![[thin space (1/6-em)]](https://www.rsc.org/images/entities/char_2009.gif) 1. The step size of the spectra is 0.04° for all spectra.
1. The step size of the spectra is 0.04° for all spectra.
All annealing processes were conducted with a high temperature quartz tube furnace (model GSL-1000X, MTI Corporation, USA) at 400 °C during 1 hour with an oxygen flow of about 80 mL min−1. The heating rate was 20 °C min−1 during a temperature ramp of 20 minutes. The oxygen atmosphere for the annealing was chosen in order to prevent reduction of the MgO nanoparticles' surfaces by oxygen desorption. After the annealing, MgO nanoparticles were cooled down with the intrinsic time constant of the furnace, i.e. without any assisted cooling process, in the same O2 flow, reducing the contact with moisture at still elevated temperatures. The cooling time varied between 3 to 5 hours. When the nanoparticles reached a temperature around 60 °C, they were removed from the furnace tube to be characterized by Raman spectroscopy or XRD.
Results and discussion
A Raman spectroscopy characterization
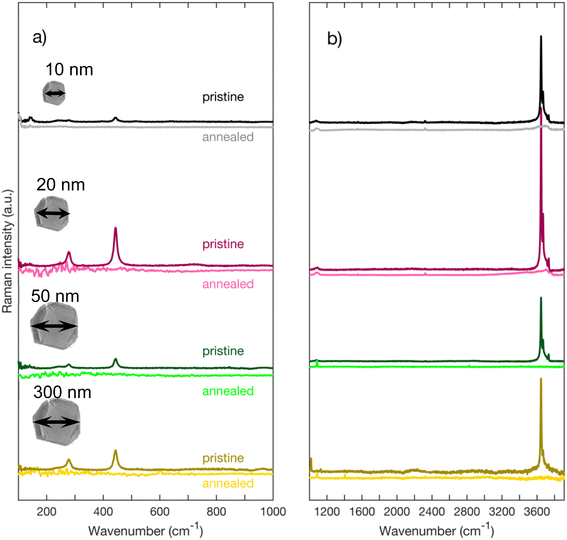
Fig. 3 depicts Raman spectra of as-received MgO nanoparticles for Raman shifts ranging from 100 cm−1 to 3900 cm−1. On Fig. 3a, we can observe that regardless of their sizes, all nanoparticles have peaks at 278 cm−1 and 445 cm−1. We also acquired high wavenumber spectra (Fig. 3b and c) where we can see Raman peaks between 3600 cm−1 and 3800 cm−1. These high frequency modes are traces of OH groups that are formed on the surface of the nanoparticles. MgO is known to be highly hygroscopic, therefore it reacts with physisorbed water forming Mg(OH)2.17,18 On Fig. 3c, we can distinguish three peaks labeled A, B, and C. The highest peak in intensity labeled A (approximately at 3646 cm−1) is close to the 3652 cm−1 OH symmetric stretching mode A1g in bulk crystalline Mg(OH)2,19–22 we therefore assign peak A to the bulk A1g mode in Mg(OH)2. Peaks B (3669 cm−1), and C (3734 cm−1), which are lower in intensity have also been observed by other authors22,23 and are equally associated with Mg(OH)2.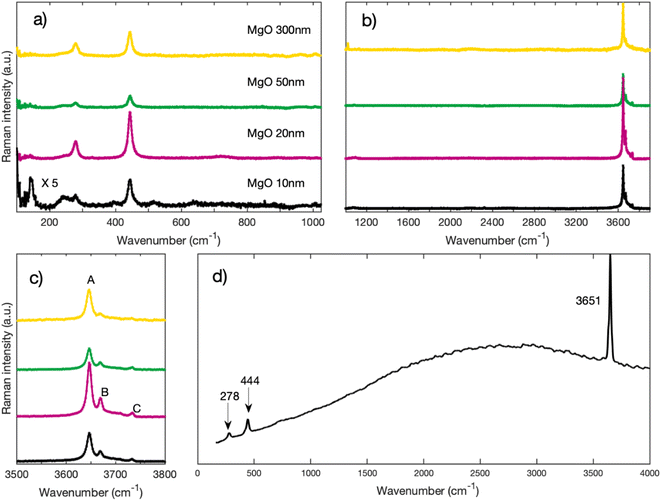 | ||
| Fig. 3 (a) Raman spectra of MgO nanoparticles for low wavenumbers acquired with a grating of 2400 l mm−1 (b) Raman spectra of MgO nanoparticles for higher wavenumbers acquired with a grating of 1200 l mm−1 (c) zoom on the region around 3700 cm−1 of spectra of Fig. 1b. (d) Raman spectrum of Mg(OH)2 from RRUFF database.31 | ||
Several theoretical and experimental investigations report that on {100} surfaces, water is only physisorbed while chemisorption occurs in the presence of defects on the surface, i.e. corners and edges.24–26 Atoms on {100} surfaces have a coordination number of five; atoms on the edge of a terrace have a coordination number of four; and atoms at the corner have coordination number of three.19,27 It has been reported by other authors that atoms in the MgO surface that have a coordination number of five - terrace atoms – may not form chemical bonds with water. Chemisorption appears to be associated to surface imperfections on {100} surfaces and therefore to ions with lower coordination.28,29 An alternative to imperfections on presumably {100} surfaces is the presence of other surfaces in the habitus of MgO nanoparticles (see TEM images from Fig. 2a and b), e.g. face {110}. Apart from {110} surfaces in octahedrally shaped nanoparticles, surfaces with higher Miller indices may also be present. We would like to remind that {111} surfaces are terminated with ionic species of a single kind (either O2− or Mg2+) and therefore unstable; they tend to recrystallize into surfaces with different Miller indices30 or to reduce their free energy through chemisorption of OH-groups forming Mg(OH)2.
In order to verify if the peaks 278 cm−1, 445 cm−1, and those in the high frequencies belong intrinsically to the MgO nanoparticles, we annealed each MgO sample during an hour in a quartz furnace under an O2 flow. Most of the cooling process was made inside the furnace under oxygen atmosphere with the intrinsic time constant (approximately 1 hour) of the thermal heat capacity of the furnace.
Fig. 4 depicts the spectra of each sample before and after annealing. One can clearly see that, for all sized nanoparticles, the peaks in the 3700 cm−1 region are no longer visible (Fig. 4b) after annealing. The annealed spectra are almost featureless in the 3700 cm−1 region for MgO nanoparticles with 300 nm and 50 nm nominal size. As for MgO nanoparticles with a nominal size of 20 nm, the annealed spectrum has a small remaining feature around 3600 cm−1, while the spectrum of MgO nanoparticles with a nominal size of 10 nm has a broad band between 3000 cm−1 and 3800 cm−1. Smaller particles have a larger surface-to-volume ratio than larger ones and therefore facilitate the detection of adsorbed species. We therefore attribute the features observed in the smallest nanoparticles of 10 and 20 nm size respectively to physisorbed molecular water.32 Even with the presence of some physisorbed water on the surface, our post-annealing spectra suggest that the OH peaks, and hence the Mg(OH)2, are no longer present on the annealed nanopowder. It has been reported by other authors that Mg(OH)2 annealed at temperatures of 400 °C and higher transforms into MgO.17,33 A small peak at 1088 cm−1 that is found on the annealed spectra of each nanoparticle appears after the annealing (Fig. 4b). It has been reported by many authors that MgO reacts with CO2 to form MgCO3.34–36 We assign that peak at 1088 cm−1 to the carbonate group CO32− based on the Raman spectrum of MgCO3 (see Fig. 5), the lower frequency peaks that appear on the MgCO3 spectrum (about 210 cm−1 and 330 cm−1) being too weak to appear on our spectra. According to literature, an annealing of 700 °C is required to desorb these ions from the surface of MgO34–36
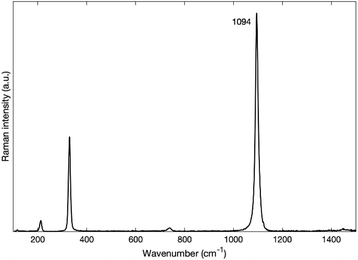 | ||
| Fig. 5 Raman spectrum of MgCO3 from RRUFF database.31 | ||
Most importantly, both peaks at 278 cm−1 and 445 cm−1 also disappear and do not spontaneously form again upon cooling when physisorption of water occurs again. This is a necessary requirement to assign these peaks to the presence of Mg(OH)2. For comparison purposes, the spectrum of Mg(OH)2 is plotted on Fig. 3d from RRUFF database31 with a clear presence of peaks at 278 cm−1, 444 cm−1 and 3651 cm−1.
So far, for MgO nanoparticles, and as expected for the bulk structure, there seem to be no peaks that belong intrinsically to MgO nanoparticles or peaks that have appeared because of the reduction of symmetry due to the nanoscale size of the nanoparticles. The peaks at 278 cm−1 and 445 cm−1 are present in the bulk phase of Mg(OH)2 and therefore are a signature of a surface contamination on nanoscale MgO, just as the disappearing peaks around 3700 cm−1.
XRD characterization
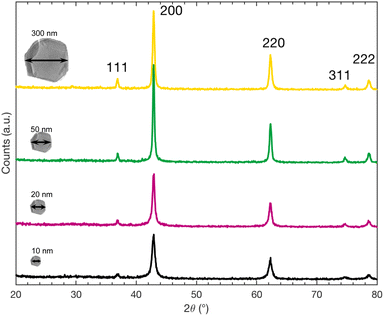
We carried out XRD measurements of powder diffraction to verify the nature and the crystal structure of the nanoparticles after the annealing to acknowledge that they still consist of MgO. In Fig. 6, the XRD spectra of all four nanopowders are depicted. Comparison of these peaks with those from the reported values of MgO (JCPDS number 00-045-0946) clearly confirms that for all sizes our nanopowders are MgO. Furthermore, no phase transition of MgO, that could possibly interfere with the interpretation of XRD data, is reported in the respective temperature range. XRD, even on nanopowders is however not sufficiently sensitive to confirm the presence of MgCO3Conclusions
In this work, we have revisited the origin of several peaks obtained in Raman spectra of nominally pure MgO nanoparticles that have preoccupied researchers as their observation collides with the symmetry requirement of bulk MgO being Raman silent. All observations throughout recent literature may be conclusively explained through almost inevitable surface contaminations when MgO is handled under ambient conditions. Particularly, we have shown that the Raman peaks at 278 cm−1 and 445 cm−1 that were occasionally assigned to MgO do not actually belong to pure MgO nanoparticles. As a matter of fact, after an annealing process of 400 °C under O2 atmosphere during an hour, MgO nanoparticles do not exhibit these Raman peaks at 278 cm−1 and 445 cm−1 anymore. These peaks are rather assigned to Mg(OH)2 that forms on the MgO nanoparticles due to a chemical reaction with humidity contained in ambient air.Conflicts of interest
There are no conflicts to declare.Acknowledgements
MD, APR, and AM appreciate the help of Ms Katharina Kohlmann for the XRD measurements. A. Ruediger gratefully acknowledges financial support through an NSERC discovery grant.References
- A. A. Pilarska, Ł. Klapiszewski and T. Jesionowski, Recent development in the synthesis, modification and application of Mg(OH)2 and MgO: a review, Powder Technol., 2017, 319, 373–407 CrossRef CAS
.
- M. Hua, S. Zhang, B. Pan, W. Zhang, L. Lv and Q. Zhang, Heavy metal removal from water/wastewater by nanosized metal oxides: a review, J. Hazard. Mater., 2012, 211–212, 317–331 CrossRef CAS PubMed
.
- S. Makhluf, R. Dror, Y. Nitzan, Y. Abramovich, R. Jelinek and A. Gedanken, Microwave-Assisted Synthesis of Nanocrystalline MgO and Its Use as a Bacteriocide, Adv. Funct. Mater., 2005, 15, 1708–1715 CrossRef CAS
.
- D. M. Roessler and W. C. Walker, Electronic Spectrum and Ultraviolet Optical Properties of Crystalline MgO, Phys. Rev., 1967, 159, 733–738 CrossRef CAS
.
- N. B. Manson, W. von der Ohe and S. L. Chodos, Second-Order Raman Spectrum of MgO, Phys. Rev. B: Solid State, 1971, 3, 1968–1972 CrossRef
.
- K. Ishikawa, N. Fujima and H. Komura, First-order Raman scattering in MgO microcrystals, J. Appl. Phys., 1985, 57, 973–975 CrossRef CAS
.
- H. Kim and H. Kim, Fabrication and Raman Studies of MgO/SnO_2 Core-Shell Heteronanowires, Acta Phys. Pol., A, 2009, 116, 58–61 CrossRef CAS
.
- K. Krishnamoorthy, J. Y. Moon, H. B. Hyun, S. K. Cho and S.-J. Kim, Mechanistic investigation on the toxicity of MgO nanoparticles toward cancer cells, J. Mater. Chem., 2012, 22, 24610 RSC
.
- Iu. G. Morozov, S. Sathasivam, O. V. Belousova, I. P. Parkin and M. V. Kuznetcov, Effect of synthesis conditions on room-temperature ferromagnetic properties of Mg-O nanoparticles, J. Alloys Compd., 2018, 765, 343–354 CrossRef CAS
.
- M. J. L. Sangster, G. Peckham and D. H. Saunderson, Lattice dynamics of magnesium oxide, J. Phys. C: Solid State Phys., 1970, 3, 1026–1036 CrossRef CAS
.
- H. K. Böckelmann and R. G. Schlecht, Raman scattering from microcrystals of MgO, Phys. Rev. B: Condens. Matter Mater. Phys., 1974, 10, 5225–5231 CrossRef
.
- M. J. Lagos, A. Trügler, U. Hohenester and P. E. Batson, Mapping vibrational surface and bulk modes in a single nanocube, Nature, 2017, 543, 529–532 CrossRef CAS PubMed
.
- L. Savio, E. Celasco, L. Vattuone, M. Rocca and P. Senet, MgO/Ag(100): confined vibrational modes in the limit of ultrathin films, Phys. Rev. B: Condens. Matter Mater. Phys., 2003, 67, 075420 CrossRef
.
- L. Chen, C. Xu, X.-F. Zhang and T. Zhou, Raman and infrared-active modes in MgO nanotubes, Phys. E, 2009, 41, 852–855 CrossRef CAS
.
- Y. Hwang, R. Souda, T. Aizawa, W. Hayami, S. Otani and Y. Ishizawa, Jpn. J. Appl. Phys., 1997, 36, 5707 CrossRef CAS
.
- V. Shpakov, A. Gotte, M. Baudin, T. Woo and K. Hermansson, MgO(001) surface phonons from ab initio calculations, Phys. Rev. B: Condens. Matter Mater. Phys., 2005, 72, 195427 CrossRef
.
- L. Kumari, W. Z. Li, C. H. Vannoy, R. M. Leblanc and D. Z. Wang, Synthesis, characterization and optical properties of Mg(OH)2 micro-/nanostructure and its conversion to MgO, Ceram. Int., 2009, 35, 3355–3364 CrossRef CAS
.
- M. A. Alavi and A. Morsali, Syntheses and characterization of Mg(OH)2 and MgO nanostructures by ultrasonic method, Ultrason. Sonochem., 2010, 17, 441–446 CrossRef CAS PubMed
.
- A. Kondo, R. Kurosawa, J. Ryu, M. Matsuoka and M. Takeuchi, Investigation on the Mechanisms of Mg(OH) 2 Dehydration and MgO Hydration by Near-Infrared Spectroscopy, J. Phys. Chem. C, 2021, 125, 10937–10947 CrossRef CAS
.
- A. Suslu, K. Wu, H. Sahin, B. Chen, S. Yang, H. Cai, T. Aoki, S. Horzum, J. Kang, F. M. Peeters and S. Tongay, Unusual dimensionality effects and surface charge density in 2D Mg(OH)2, Sci. Rep., 2016, 6, 20525 CrossRef CAS PubMed
.
- P. Dawson, C. D. Hadfield and G. R. Wilkinson, The polarized infra-red and Raman spectra OF Mg(OH)2 and Ca(OH)2, Pergamon Press, 1973, vol. 34 Search PubMed
.
- A. Maltseva, V. Shkirskiy, G. Lefèvre and P. Volovitch, Effect of pH on Mg(OH) 2 film evolution on corroding Mg by in situ kinetic Raman mapping (KRM), Corros. Sci., 2019, 153, 272–282 CrossRef CAS
.
- F. Khairallah and A. Glisenti, Synthesis, characterization and reactivity study of nanoscale magnesium oxide, J. Mol. Catal. A: Chem., 2007, 274, 137–147 CrossRef CAS
.
- N. H. de Leeuw, G. W. Watson and S. C. Parker, Atomistic Simulation of the Effect of Dissociative Adsorption of Water on the Surface Structure and Stability of Calcium and Magnesium Oxide, J. Phys. Chem., 1995, 99, 17219–17225 CrossRef CAS
.
- H. Onishi, C. Egawa, T. Aruga and Y. Iwasawa, Adsorption of Na atoms and oxygen-containing molecules on MgO(100) and (111) surfaces, Surf. Sci., 1987, 191, 479–491 CrossRef CAS
.
- H. DUNSKI, W. JOWIAK and H. SUGIER, Dehydroxylation of the surface of magnesium oxide by temperature programmed desorption, J. Catal., 1994, 146, 166–172 CrossRef CAS
.
- C. Chizallet, G. Costentin, M. Che, F. Delbecq and P. Sautet, Revisiting Acido-basicity of the MgO Surface by Periodic Density Functional Theory Calculations: Role of Surface Topology and Ion Coordination on Water Dissociation, J. Phys. Chem. B, 2006, 110, 15878–15886 CrossRef CAS PubMed
.
- S. Knop, T. L. C. Jansen, J. Lindner and P. Vöhringer, On the nature of OH-stretching vibrations in hydrogen-bonded chains: Pump frequency dependent vibrational lifetime, Phys. Chem. Chem. Phys., 2011, 13, 4641 RSC
.
- G. Lipinski, K. Jeong, K. Moritz, M. Petermann, E. F. May, P. L. Stanwix and M. Richter, Application of Raman Spectroscopy for Sorption Analysis of Functionalized Porous Materials, Adv. Sci., 2022, 9, 2105477 CrossRef PubMed
.
- R. Plass, J. Feller and M. Gajdardziska-Josifovska, Morphology of MgO(111) surfaces: artifacts associated with the faceting of polar oxide surfaces into neutral surfaces, 1998, vol. 414 Search PubMed
.
- B. Lafuente, R. T. Downs, H. Yang and N. Stone, in Highlights in Mineralogical Crystallography, De Gruyter, 2015, pp. 1–30 Search PubMed
.
- A. de Lima Ribeiro, C. Artlett and H. Pask, A LIDAR-Compatible, Multichannel Raman Spectrometer for Remote Sensing of Water Temperature, Sensors, 2019, 19, 2933 CrossRef CAS PubMed
.
- M. A. Alavi and A. Morsali, Syntheses and characterization of Mg(OH)2 and MgO nanostructures by ultrasonic methods, Ultrason. Sonochem., 2010, 17, 441–446 CrossRef CAS PubMed
.
- D. K. Aswal, K. P. Muthe, S. Tawde, S. Chodhury, N. Bagkar, A. Singh, S. K. Gupta and J. V. Yakhmi, XPS and AFM investigations of annealing induced surface modifications of MgO single crystals, J. Cryst. Growth, 2002, 236, 661–666 CrossRef CAS
.
- J. Geler-Kremer, A. B. Posadas and A. A. Demkov, Preparation of clean MgO surface by oxygen plasma: Comparison with standard substrate cleaning procedures, J. Vac. Sci. Technol., B: Nanotechnol. Microelectron.: Mater., Process., Meas., Phenom., 2020, 38, 062201 CAS
.
- T. Awaji, K. Sakuta, Y. S. Yoshiyuki Sakaguchi and T. K. Takeshi Kobayashi, Improved Surface Crystallinity of MgO Crystal Substrate through Annealing in Oxygen Atmosphere, Jpn. J. Appl. Phys., 1992, 31, L642 CrossRef CAS
.
| This journal is © The Royal Society of Chemistry 2023 |

