DOI:
10.1039/D3RA02078A
(Paper)
RSC Adv., 2023,
13, 15366-15378
Green emission from trivalent cerium doped LaAlO3/MgO nano-composite for photonic and latent finger printing applications
Received
30th March 2023
, Accepted 15th May 2023
First published on 22nd May 2023
Abstract
A series of Ce3+ doped La1−xCexAlO3/MgO (x = 0, 0.7, 0.9, 1.0 and 2.0 mol%) nano-composites have successfully been synthesized employing the Pechini sol–gel method. XRD profiles assisted with Rietveld refinement results manifested the rhombohedral/face-centered structures of the two phases of the generated composite. Thermogravimetric results corroborate the crystallization temperature of the compound to be 900 °C, that further remains stable up to 1200 °C. Materials have been found to be wide band gap semi-conductors having Eg in the range of 5.5–5.8 eV. Photoluminescence studies reveal their green emission under UV excitation of 272 nm. Application of Dexter's theory and Burshtein model to PL and TRPL profiles, respectively reveals the q–q multipole interlinkages to be the viable cause of concentration quenching beyond optimum concentration of 0.9 mol%. Shifting of the energy transfer route from cross-relaxation to migration assisted mechanism with Ce3+ concentration has also been investigated. Other luminescence based parameters such as energy transfer probabilities, efficiencies, CIE and CCT have also been found to be in an admirable range. From the aforesaid results, it was observed that the optimized nano-composite (i.e. La1−xCexAlO3/MgO (x = 0.9 mol%)) can also be utilized for latent finger-printing (LFP) application that evinces its versatility for photonic as well as imaging applications.
1. Introduction
Solid state lighting technology has advocated a great revolution due to the development of pc-w-LEDs for their ubiquitous applications and their proficient features including low-power usage, robustness, high luminosity, good fidelity, long life-span (>100![[thin space (1/6-em)]](https://www.rsc.org/images/entities/char_2009.gif) 000 h), fast switching, etc.1,2 Current mainstream patterns of developing w-LEDs involve either the encapsulation of blue LEDs with yellow emitting phosphor YAG:Ce3+ or pumping trichromatic blue, green, red (BRG) phosphors with UV light.3,4 However, the first strategy suffers due to high CCT, low color rendering index (Ra < 80), halo-effect, thermal quenching, etc. In the later category, the commercially used tri-color phosphor materials are BaMgAl10O17:Eu2+ for blue, ZnS:(Cu+, Al+) for green and Y2O2S:Eu3+ for red emission. But the thermal and chemical stability of sulphide phosphors is very low. Moreover, they are also prone to emit sulphur gas into the atmosphere, thus are toxic.5 Resultantly, myriad research is being done in search of a novel phosphor matrix possessing efficient characteristics. Recent years have witnessed the trend of developing and exploring nano-composite materials to solve innumerous inexorable problems including nano-phosphor composite materials.6,7 However, the rate of research on composite phosphors is much less than the research being done on crystalline and glassy materials.
000 h), fast switching, etc.1,2 Current mainstream patterns of developing w-LEDs involve either the encapsulation of blue LEDs with yellow emitting phosphor YAG:Ce3+ or pumping trichromatic blue, green, red (BRG) phosphors with UV light.3,4 However, the first strategy suffers due to high CCT, low color rendering index (Ra < 80), halo-effect, thermal quenching, etc. In the later category, the commercially used tri-color phosphor materials are BaMgAl10O17:Eu2+ for blue, ZnS:(Cu+, Al+) for green and Y2O2S:Eu3+ for red emission. But the thermal and chemical stability of sulphide phosphors is very low. Moreover, they are also prone to emit sulphur gas into the atmosphere, thus are toxic.5 Resultantly, myriad research is being done in search of a novel phosphor matrix possessing efficient characteristics. Recent years have witnessed the trend of developing and exploring nano-composite materials to solve innumerous inexorable problems including nano-phosphor composite materials.6,7 However, the rate of research on composite phosphors is much less than the research being done on crystalline and glassy materials.
This urged the authors to generate a fresh and noble nano-composite material that is stable, viable and environment friendly; which has high band gap, low phonon frequency as required for acting as an efficient host matrix when doped with a suitable activator. In this regard, a nano-composite of LaAlO3 (LAO) and MgO (MO) has been synthesized since both have high band-gaps in the range of 5.3–5.8 eV and 5.8–6.3 eV respectively.8–10 Additionally, oxides are highly stable and thus are devoid of afore-mentioned snags.11 Concerning activator, rare-earth elements are mostly preferred for their sharp spectra. Amongst several rare-earths, Ce3+ is a well-known paradigm of it for its abundance in nature and promising spectral emissions in green and blue region of visible spectrum due to its allowed f–d transitions. Therefore, has been vastly explored in several host matrices such as, Y3Al5O12, CaY2HfGa(AlO4), CaSc2O4, etc., for green color luminescence and Sr2Al2SiO7, Ba3La2(BO3)4, SrZrSi2O7, CaZrO3 etc., for blue colour emission for its innumerable applications in display devices, wLEDs, scintillators, laser amplifiers in fibre-optics communications, solar cells, etc.12–18 Individually Ce3+ doped LAO have been studied earlier and have shown excellent luminescence.19–21 This motivated the authors to synthesize and investigate luminescence in novel Ce3+ doped nano-composite LaAlO3/MgO material.
Besides aforementioned photonic applications, phosphors are widely being explored for Latent Finger Printing (LFP) applications. It an effective anti-counterfeiting technique for prevention of circulation and detection of forged banknotes, currency, certificates, etc. along with investigations of crime scene.22,23 In this, luminescent material is deposited on latent fingerprints and then visualized under suitable UV lamp. Each fingerprint pattern features can be classified into 3 levels based on the minuteness of it. Level 1 being the coarse details and level 3 showing the finest details of the pattern that help identify the criminal. Efforts have been made to prepare effective phosphor powder that can help identify fingerprints from each kind of surface and up to core level 3 of pattern.24,25
The prime aim of this article is to study the luminescence of Ce3+ doped nano-composites La1−xCexAlO3/MgO and its advantage over individually Ce3+ doped LAO has also been discussed.
2. Experimental
2.1 Materials and synthesis of nanocomposite
All the precursor salts, namely, La(NO3)3·6H2O (purity 99%), Al(NO3)3·9H2O (purity 98.5%), Mg(NO3)2·6H2O (purity 99.5%), Ce(NO3)3·6H2O (purity 99%) (all procured from Hi-media, AR grade) and citric acid (purity 98%) (Merk, AR grade) were used as obtained without any further purification.
Pristine as well as Ce doped nanocomposites La1−xCexAlO3/MgO (x = 0, 0.3, 0.5, 0.7, 0.9, 1.0 and 2.0 mol%) were prepared using citrate assisted Pechini sol–gel method in single step (Fig. 1). For this, initially stoichiometric ratios of all the metal salts were dissolved in minimum amount of distilled water at room temperature. Subsequently, citric acid with respect to metal ion in the ratio 2![[thin space (1/6-em)]](https://www.rsc.org/images/entities/char_2009.gif) :
:![[thin space (1/6-em)]](https://www.rsc.org/images/entities/char_2009.gif) 1 (CA
1 (CA![[thin space (1/6-em)]](https://www.rsc.org/images/entities/char_2009.gif) :
:![[thin space (1/6-em)]](https://www.rsc.org/images/entities/char_2009.gif) M) was added and stirred vigorously at 80 °C until gelation occurs. Thereafter, temperature was raised to 120 °C that lead to auto-combustion followed by frothing and fuming resulting in white coloured wet-sponges that turn into dry brown sponges (as-prepared dried xerogel) within a few minutes. The resultant is subsequently powdered using mortar pestle and then sintered at different calcination temperatures for 3 h over the range of 650 °C–1200 °C for further characterizations. Out of these dopant concentrations, it was observed that x = 0.3 and 0.5 mol% shows negligible luminescence. Observable luminescence began with x = 0.7 mol% that reached its maxima for x = 0.9 mol% and decreased thereafter for increasing Ce3+ concentrations. Therefore, x = 0.7, 0.9, 1.0 and 2.0 mol% were studied in detail.
M) was added and stirred vigorously at 80 °C until gelation occurs. Thereafter, temperature was raised to 120 °C that lead to auto-combustion followed by frothing and fuming resulting in white coloured wet-sponges that turn into dry brown sponges (as-prepared dried xerogel) within a few minutes. The resultant is subsequently powdered using mortar pestle and then sintered at different calcination temperatures for 3 h over the range of 650 °C–1200 °C for further characterizations. Out of these dopant concentrations, it was observed that x = 0.3 and 0.5 mol% shows negligible luminescence. Observable luminescence began with x = 0.7 mol% that reached its maxima for x = 0.9 mol% and decreased thereafter for increasing Ce3+ concentrations. Therefore, x = 0.7, 0.9, 1.0 and 2.0 mol% were studied in detail.
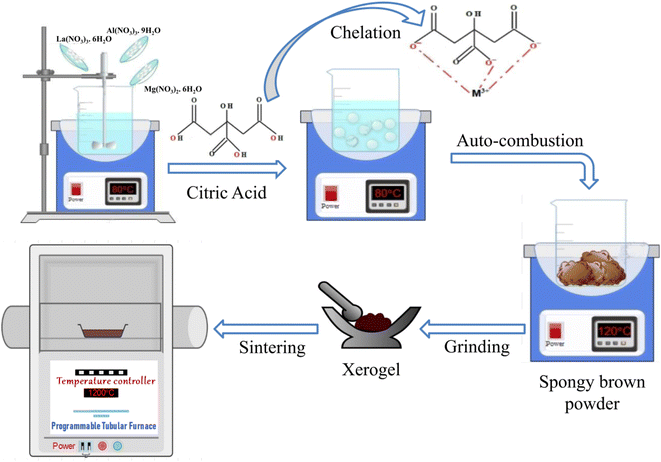 |
| | Fig. 1 Schematics of composite synthesis using Pechini sol–gel method. | |
Pellet of undoped nanocomposite for P–E curve tracing was prepared by adding 5 drops of hot water soluble PVA@3 wt% to the sintered powder and mixed thoroughly. The prepared sticky powder was then moulded into pellet using 7 mm dye. Prepared pellet was again sintered at 1200 °C for 3 h in tubular furnace to remove the traces of added PVP.
2.2 Methodology
The thermal analysis were performed using DSC-TG analyzer (TA instruments/Q600-SDT) from room temperature to 1200 °C at the ramp rate of 5 °C min−1 in the presence of oxygen gas and the diffraction patterns were recorded by Rigaku/miniflex-600 table top X-ray Diffractometer employing Cu-Kα (1.5406 Å) X-ray radiation source over the 2θ range of (10°–80°) with the scan rate of 1° min−1. XRD profile were Rietveld refined using FullProf program and crystal structures were visualized utilizing Vesta software program.26–28 P–E hysteresis curves were traced using Marine India's Highend PE ferroelectric test system for electric fields in the range of 25–100 kV cm−1. UV-DRS spectroscopy was done using Shimadzu-3600 plus UV-spectrophotometer in the wavelength range 200–800 nm in reflectance mode. Steady state PL spectroscopy was performed using Horiba instruments Fluorescence spectrophotometer (FL3C-21) assisted with double grating monochromator and Xe-lamp in the range 380–750 nm for emission spectra and 250–420 nm for excitation spectra where as time resolved PL spectroscopy (TRPL) was carried out using FL-spectrophotometer by HITACHI F-7000 using Xe lamp operated at 400 V. Imaging of fingerprints and samples were done using UV Fluorescence analysis cabinet equipped with short range UV source of wavelength 254 nm operated at 60 Hz, 220 V.
2.3 Latent fingerprint visualisation
To collect finger-prints of donor, his hands were thoroughly washed with soap and water followed by drying in normal air. Then his thumb was gently pressed on donor's forehead and fingerprint was collected on a glass-slide. This latent fingerprint was then produced using optimized phosphor, via powder dusting method. Extra powder was removed carefully by using soft brush. Then, the pattern was visualized under short range UV lamp (254 nm) cabinet and photographed.
3. Results and discussion
3.1 Thermal analysis
Fig. 2 depicts the TGA and DSC thermograms of unsintered pristine powdered xerogel. The TGA shows a total weight loss of 88.41% at 900 °C and remains constant thereafter upto 1200 °C. The initial weightloss of 8.7% around 200 °C may be attributed to desorption of adsorbed water vapours which is confirmed by the presence of an endothermic peak. Then the subsequent weightloss of approximately 85.34% between 200–550 °C may be due to decomposition of citric acid complexes, crystallization of MO phase and release of nitrous and carbonaceous gases, affirmed by the presence of two exothermic peaks at 426 °C and 507 °C in this region. Final weightloss between 730–900 °C may be attributed to the burning of residual organic complexes and crystallization of LAO. The corresponding DSC curve shows an endothermic dip accompanied with an exothermic process at around 850 °C helps identify the calcination temperature to be 900 °C.29–31 Above this a stable phase is obtained. Involved chemical reaction for the whole process follows the given reaction (1) for which total weightloss is calculated to be 87.84% that matches well with the experimental observations (i.e. 88.41%).| | |
Mg(NO3)3·6H2O + Al(NO3)3·6H2O + La(NO3)3·9H2O + 4C6H8O7 + 8O2 → LaAlO3 + MgO + 24CO2 + 4N2 + 37H2O
| (1) |
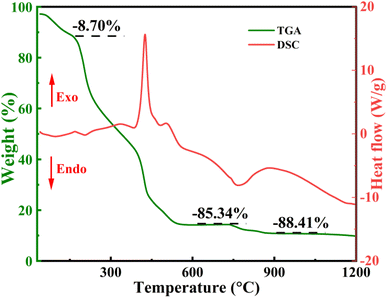 |
| | Fig. 2 Differential Scanning Calorimetry (DSC) and Thermo-Gravimetric Analysis (TGA) curves of pristine powder LaAlO3/MgO. | |
3.2 Structural analysis
For scrutinizing the calcination temperature, sintering temperature and the crystal phase of the composite so formed, the room temperature X-ray Diffraction (XRD) patterns of un-sintered xerogel and calcined powders sintered at different temperatures were recorded and are indicated in Fig. 3(a). For xerogel, pattern is amorphous with 2 humps indicating the presence of 2 phases that have not yet crystallized. For calcined powder sintered at 650 °C, peaks for both the phases start to appear whose sharpness as well as intensities increases with the rise in temperature indicating the improvement in crystallinity.29 The presence of an amorphous hump around 28°–30° is because of organic residues which reduce with the elevating temperature. Apparently, this hump is convoluted with lanthanum oxide peak at 28.936° at 800 °C.32 At 900 °C, all these supplementary peaks vanish stipulating the calcination completion and pure crystalline phase is obtained, correlating with the DSC-TGA data. At 1200 °C, peaks become narrower and sharper as a result of larger crystallite size and better crystallinity of the composite so formed.
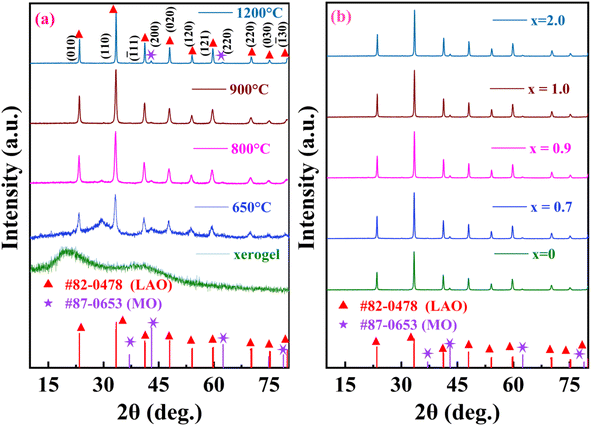 |
| | Fig. 3 X-ray Diffraction (XRD) pattern of La1−xCexAlO3/MgO (a) for x = 0 unsintered xerogel powder, powder sintered at 650 °C, 800 °C, 900 °C and 1200 °C along with reference JCPDS and (b) x = 0, 0.7, 0.9, 1.0 and 2.0 mol%. | |
The diffraction profile of the nano-composite so formed can be ascribed to the reference JCPDS card #87-0653 for MO (space group: Fm![[3 with combining macron]](https://www.rsc.org/images/entities/char_0033_0304.gif) m (225)) and for LAO it matches well with card #82-0478 (space group: R
m (225)) and for LAO it matches well with card #82-0478 (space group: R![[3 with combining macron]](https://www.rsc.org/images/entities/char_0033_0304.gif) c (167)) as well as with card #31-0022 (space group: Pm3m (221)) since both the cards possess peaks at same positions with different miller indices. S. Kozuka et al., I. S. Silveira et al., D. Singh et al., M. Beheshti et al. have reported it to be rhombohedral whereas authors such as P. Kumar et al., E. B. Shaik et al. and P. Ankoji et al. have reported it to be belonging to later space group having primitive cubic structure.32–38 LAO is known to transit from rhombohedral to primitive structure around 800 K.39 So, at room temperature its XRD should be ascribed to rhombohedral space group. To ascertain the same, Rietveld refinement of diffractograms using both the space groups have been performed and displayed in Fig. 4(a) and (b). Chi-square and R-factors for both the models were found to be in acceptable range, with chi-square value being lower for the rhombohedral model. To support this experimentally, polarization vs. electric field (P–E) hysteresis curve tracing experiment at room temperature had been conducted using pallet of the nano-composite so formed. In this, an oscillating electric field at a constant potential difference is applied across the crystal that induces spontaneous polarization within it thus, material exhibits hysteresis loop. As a matter of fact, cubically symmetric crystals can never be polarized because centre of charges for both the anion and cation coincides under given symmetric conditions and will never be separated for dipole formation whereas for non-cubic crystals such segregation of centre of charges may take place leading to dipole formation and hence resultant polarization.40 Presence of hysteresis curve in Fig. 4(c) corroborates the fact that the material is non-cubic at room temperature. So the nano-composite so formed has crystallized into rhombohedral space group.
c (167)) as well as with card #31-0022 (space group: Pm3m (221)) since both the cards possess peaks at same positions with different miller indices. S. Kozuka et al., I. S. Silveira et al., D. Singh et al., M. Beheshti et al. have reported it to be rhombohedral whereas authors such as P. Kumar et al., E. B. Shaik et al. and P. Ankoji et al. have reported it to be belonging to later space group having primitive cubic structure.32–38 LAO is known to transit from rhombohedral to primitive structure around 800 K.39 So, at room temperature its XRD should be ascribed to rhombohedral space group. To ascertain the same, Rietveld refinement of diffractograms using both the space groups have been performed and displayed in Fig. 4(a) and (b). Chi-square and R-factors for both the models were found to be in acceptable range, with chi-square value being lower for the rhombohedral model. To support this experimentally, polarization vs. electric field (P–E) hysteresis curve tracing experiment at room temperature had been conducted using pallet of the nano-composite so formed. In this, an oscillating electric field at a constant potential difference is applied across the crystal that induces spontaneous polarization within it thus, material exhibits hysteresis loop. As a matter of fact, cubically symmetric crystals can never be polarized because centre of charges for both the anion and cation coincides under given symmetric conditions and will never be separated for dipole formation whereas for non-cubic crystals such segregation of centre of charges may take place leading to dipole formation and hence resultant polarization.40 Presence of hysteresis curve in Fig. 4(c) corroborates the fact that the material is non-cubic at room temperature. So the nano-composite so formed has crystallized into rhombohedral space group.
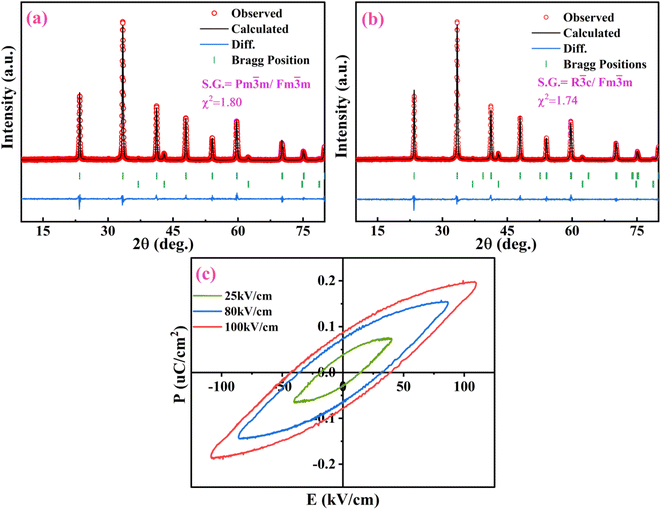 |
| | Fig. 4 Rietveld-refinement plot of LaAlO3/MgO corresponding to space group (a) Pm![[3 with combining macron]](https://www.rsc.org/images/entities/char_0033_0304.gif) m/Fm m/Fm![[3 with combining macron]](https://www.rsc.org/images/entities/char_0033_0304.gif) m, (b) R m, (b) R![[3 with combining macron]](https://www.rsc.org/images/entities/char_0033_0304.gif) c/Fm c/Fm![[3 with combining macron]](https://www.rsc.org/images/entities/char_0033_0304.gif) m and (c) polarization vs. electric field (P–E) hysteresis curve. m and (c) polarization vs. electric field (P–E) hysteresis curve. | |
Fig. 3(b) also shows the diffraction patterns of Ce3+ doped nano-composites La1−xCexAlO3/MgO (x = 0, 0.7, 0.9, 1.0, 2.0 mol%) sintered at 1200 °C which is analogous to the one observed for host matrix. The absence of any conspicuous peak indicates that Ce3+ ion has successfully been incorporated into the host matrix and has efficiently substituted the host cation. According to Hume–Rothery rules for substitutional solid solutions, maximum solubility occurs when host and dopant ions have similar ionic radii, valencies and electro-negativities.41 Here, firstly replacement of Mg2+ by Ce3+ is ruled out based on the dissimilarities in all the aspects. For LAO, although both the host cations La3+ & Al3+ have analogous valencies to that of dopant Ce3+ but ionic radii and electronegativity of Al3+ is considerably different. Quantitatively, if the differential radii percentage (Δr) is less than 30% only then the substitution is feasible, that is calculated by (2)
| |
 | (2) |
where,
Rh and
Rd are ionic radii of host and dopant ions respectively for their corresponding coordination numbers (CN)
3. In the present study, calculated values of Δ
r for substitution of Al
3+ (
r = 0.5375 Å, CN = 6) and La
3+ (
r = 1.36 Å, CN = 12) by Ce
3+ (
r = 1.01 Å, CN = 6;
r = 1.34 Å, CN = 12) are 87.90% and 1.47% respectively. So, the substitution of former is ruled out and later is validated.
The nano-composite samples La1−xCexAlO3/MgO (x = 0 and 0.9 mol%) were sintered in the range of 900 °C–1200 °C and its effect on crystallite size was investigated. By employing Debye–Scherrer given by (3) as well as by Williamsons–Hall (W–H) method given as (4),
| |
 | (3) |
| |
 | (4) |
where,
D = crystallite size,
β = full width half maxima of peaks,
θ = Bragg's angle in deg.,
λ = 1.54 Å,
k = 0.91 (Schherer's constant) and
ε = strain produced.
42,43 From
(4), plot of
β![[thin space (1/6-em)]](https://www.rsc.org/images/entities/char_2009.gif)
cos
![[thin space (1/6-em)]](https://www.rsc.org/images/entities/char_2009.gif) θ vs.
θ vs. 4
![[thin space (1/6-em)]](https://www.rsc.org/images/entities/char_2009.gif)
sin
![[thin space (1/6-em)]](https://www.rsc.org/images/entities/char_2009.gif) θ
θ gives straight line with slope of line equating to strain and reciprocal of intercept being propotional to
D.
Table 1 summarizes the calculated crystallite sizes and strains employing both the methods for all the samples.
Fig. 5 depicts such W–H plot for La
1−xCe
xAlO
3/MgO (
x = 0.7 mol%). Here, it is worth noting that W–H method gives larger ‘
D’ because it helps eliminate strain-induced broadening, thus giving accurate ‘
D’. From the perusal of data, it is observed that as sintering temperature rises, ‘
D’ increases and ‘
ε’ reduces for the both doped and undoped sample corroborating grain growth and better structure formation.
44 For doped samples all sintered at 1200 °C, as the dopant concentration increases, ‘
ε’ reduces because the dopant Ce
3+ radii is smaller than the substituted La
3+ radii causing lesser tensile stress.
45
Table 1 Debye Scherrer and Williamson–Hall (W–H) results of La1−xCexAlO3/MgO (x = 0, 0.7, 0.9, 1.0, 2.0 mol%) along with their sintering temperatures; D = crystallite size, ε = strain, χ2, R2 = fitness parameters
| x (mol%) |
Sintering temp. (°C) |
Debye Scherrer D (nm) |
Williamson–Hall |
| χ2 |
R2 |
D (nm) |
ε |
| 0 |
900 |
19.25189 |
1.521 × 10⁻⁶ |
0.95206 |
43.53870 |
0.00372 |
| 1000 |
23.76002 |
3.089 × 10⁻⁷ |
0.97003 |
39.16050 |
0.00214 |
| 1100 |
32.18536 |
7.902 × 10⁻⁹ |
0.99795 |
59.65728 |
0.00172 |
| 1200 |
33.07412 |
1.663 × 10⁻⁷ |
0.96578 |
63.15072 |
0.00166 |
| 0.7 |
1200 |
33.01666 |
1.663 × 10⁻⁷ |
0.96578 |
56.53008 |
0.00147 |
| 0.9 |
900 |
19.60934 |
5.195 × 10⁻⁷ |
0.95706 |
30.27961 |
0.00231 |
| 1000 |
22.68407 |
4.164 × 10⁻⁷ |
0.94327 |
32.00790 |
0.00178 |
| 1100 |
28.84360 |
1.598 × 10⁻⁷ |
0.96945 |
44.22543 |
0.00153 |
| 1200 |
33.16457 |
2.519 × 10⁻⁷ |
0.93728 |
51.73232 |
0.00141 |
| 1.0 |
1200 |
33.97841 |
9.473 × 10⁻⁸ |
0.94654 |
52.50734 |
0.00133 |
| 2.0 |
1200 |
34.79318 |
1.125 × 10⁻⁷ |
0.93516 |
53.92100 |
0.00130 |
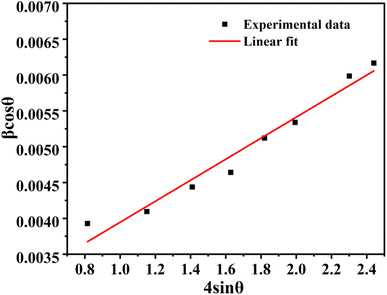 |
| | Fig. 5 Williamson–Hall (W–H) plot of La1−xCexAlO3/MgO (x = 0.7 mol%). | |
Rietveld refinement of the samples were performed and comparative results such as reliability factors χ2, Rp, Rwp, Rexp, goodness of fit (GOF); and refined parameters such as phase percentages, lattice parameters (a), densities (δ), atomic fractional co-ordinates and occupancies of all the doped/undoped nano-composites have been tabularized in Table 2 which confirms all the samples crystallize into afore-mentioned space groups. All the reliability factors are in acceptable range signifying excellent fitting. Noteworthy is, the lattice parameters and volume of the unit cell goes on decreasing when dopant concentration increases from 0.7 to 2 mol% which is in accord with the fact that dopant ion has lesser radii than the substituted ion. Fig. 6 shows the crystal structure of both the phases using Vesta software. In this surrounding co-ordination spheres of all the cations have been shown.
Table 2 Detailed data of Rietveld refinement profiles of La1−xCexAlO3/MgO (x = 0, 0.7, 0.9, 1.0, 2.0 mol%); χ2 = reduced chi-square value; Rp, Rwp, Rexp, Rf = Bragg-R factors; GOF = goodness of fit; a, b, c = lattice parameters; V = volume; δ = density; E= element name; x, y, z = atomic fractional co-ordinates; occ. = occupancy
| x (mol%) |
|
0 |
0 |
0.7 |
0.9 |
1.0 |
2.0 |
| χ2 |
|
1.80 |
1.74 |
2.38 |
3.66 |
3.87 |
3.61 |
| Rp |
|
7.26 |
7.09 |
7.75 |
10.1 |
10.1 |
10.4 |
| Rwp |
|
9.49 |
9.29 |
10.6 |
13.0 |
11.1 |
13.7 |
| Rexp |
|
7.06 |
7.06 |
6.90 |
6.82 |
6.06 |
6.89 |
| GOF |
|
1.34 |
1.32 |
1.53 |
1.90 |
1.83 |
1.98 |
| Phases |
LAO |
Pm![[3 with combining macron]](https://www.rsc.org/images/entities/char_0033_0304.gif) m m |
R![[3 with combining macron]](https://www.rsc.org/images/entities/char_0033_0304.gif) c c |
R![[3 with combining macron]](https://www.rsc.org/images/entities/char_0033_0304.gif) c c |
R![[3 with combining macron]](https://www.rsc.org/images/entities/char_0033_0304.gif) c c |
R![[3 with combining macron]](https://www.rsc.org/images/entities/char_0033_0304.gif) c c |
R![[3 with combining macron]](https://www.rsc.org/images/entities/char_0033_0304.gif) c c |
| MO |
Fm![[3 with combining macron]](https://www.rsc.org/images/entities/char_0033_0304.gif) m m |
Fm![[3 with combining macron]](https://www.rsc.org/images/entities/char_0033_0304.gif) m m |
Fm![[3 with combining macron]](https://www.rsc.org/images/entities/char_0033_0304.gif) m m |
Fm![[3 with combining macron]](https://www.rsc.org/images/entities/char_0033_0304.gif) m m |
Fm![[3 with combining macron]](https://www.rsc.org/images/entities/char_0033_0304.gif) m m |
Fm![[3 with combining macron]](https://www.rsc.org/images/entities/char_0033_0304.gif) m m |
| Phase (%) |
LAO |
85.45 |
85.95 |
85.87 |
85.80 |
85.76 |
85.96 |
| MO |
14.55 |
14.05 |
14.13 |
15.20 |
14.24 |
14.04 |
| Bragg-R |
LAO |
4.21 |
2.62 |
3.88 |
5.00 |
9.92 |
9.00 |
| MO |
1.99 |
1.75 |
2.63 |
3.25 |
5.78 |
5.18 |
| Rf |
LAO |
9.21 |
8.85 |
4.69 |
5.00 |
9.92 |
9.00 |
| MO |
5.75 |
5.48 |
3.55 |
2.49 |
8.74 |
2.74 |
| a (Å), b (Å), c (Å) |
LAO |
3.792299 |
5.36633 |
5.36033 |
5.35692 |
5.35547 |
5.35333 |
| — |
— |
— |
— |
— |
— |
| — |
13.12054 |
13.10622 |
13.09854 |
13.09406 |
13.05155 |
| MO |
4.210361 |
4.21004 |
4.20612 |
4.20494 |
4.20257 |
4.20154 |
| — |
— |
— |
— |
— |
— |
| — |
— |
— |
— |
— |
— |
| V (Å3) |
LAO |
54.539 |
327.218 |
326.131 |
325.225 |
324.831 |
323.922 |
| MO |
74.638 |
74.620 |
74.412 |
74.321 |
74.268 |
74.170 |
| δ (gm cc−1) |
LAO |
6.511 |
6.513 |
6.535 |
6.553 |
6.553 |
6.580 |
| MO |
3.587 |
3.587 |
3.598 |
3.602 |
3.607 |
3.609 |
| E; x, y, z; occ. |
LAO |
La3+ |
La3+ |
La3+/Ce3+ |
La3+/Ce3+ |
La3+/Ce3+ |
La3+/Ce3+ |
| 0.5, 0.5, 0.5 |
0, 0, 0.25 |
0, 0, 0.25 |
0, 0, 0.25 |
0, 0, 0.25 |
0, 0, 0.25 |
| 0.02083 |
0.16667 |
0.16550/0.00117 |
0.16517/0.00150 |
0.16500/0.00167 |
0.16334/0.00333 |
| Al3+ |
Al3+ |
Al3+ |
Al3+ |
Al3+ |
Al3+ |
| 0, 0, 0 |
0, 0, 0 |
0, 0, 0 |
0, 0, 0 |
0, 0, 0 |
0, 0, 0 |
| 0.02083 |
0.16667 |
0.16667 |
0.16667 |
0.16667 |
0.16667 |
| O2− |
O2− |
O2− |
O2− |
O2− |
O2− |
| 0.5, 0, 0 |
0.51976, 0, 0.25 |
0.51953, 0, 0.25 |
0.51059, 0, 0.25 |
0.50092, 0, 0.25 |
0.50301, 0, 0.25 |
| 0.06250 |
0.5 |
0.5 |
0.5 |
0.5 |
0.5 |
| MO |
Mg2+ |
Mg2+ |
Mg2+ |
Mg2+ |
Mg2+ |
Mg2+ |
| 0, 0, 0 |
0, 0, 0 |
0, 0, 0 |
0, 0, 0 |
0, 0, 0 |
0, 0, 0 |
| 0.02083 |
0.02083 |
0.02083 |
0.02083 |
0.02083 |
0.02083 |
| O2− |
O2− |
O2− |
O2− |
O2− |
O2− |
| 0.5, 0.5, 0.5 |
0.5, 0.5, 0.5 |
0.5, 0.5, 0.5 |
0.5, 0.5, 0.5 |
0.5, 0.5, 0.5 |
0.5, 0.5, 0.5 |
| 0.02083 |
0.02083 |
0.02083 |
0.02083 |
0.02083 |
0.02083 |
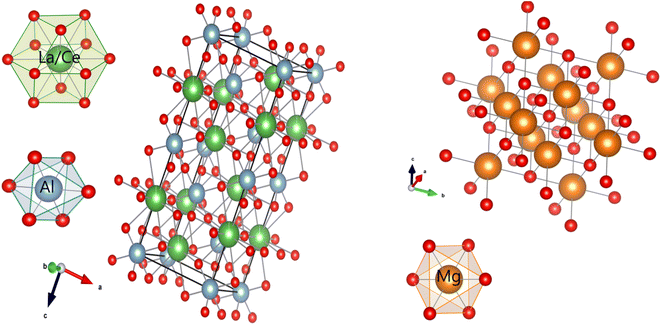 |
| | Fig. 6 Crystal structure of LAO and MO and cation co-ordinating spheres of Al3+, La3+/Ce3+ and Mg2+. | |
3.3 Photoluminescence (PL) spectroscopy
3.3.1 PLE spectra of doped/undoped nano-composite and its components. To investigate the luminescence characteristics of the doped/un-doped nano-composite so formed and its various individual components, PL spectroscopy was performed. Fig. 7(a) shows the PLE curves for various samples at the emission wavelength of 529 nm. It can be manifested from the figure that MO strongly absorbs before 290 nm, attributed to excitation of 3- and 4-fold co-ordinated O2− anions at edges (F+ center) and in corners (F center); and weak absorption band between 320–420 nm is due to charge transfer on surface states of MO.46 LAO shows feeble absorption in the entire region, which may be due to surface defects formed during synthesis whereas La1−yCeyAlO3 (y = 0.9 mol%) shows characteristic cerium 2 band absorption around 298 nm and 367 nm.21,47 Synthesized pristine nano-composite LaAlO3/MgO shows little absorption around 268 nm, whereas Ce3+ doped nano-composite La1−xCexAlO3/MgO (x = 0.9 mol%) absorbs strongly featuring two broad humps centered about 272 nm and 367 nm with former being the most intense. Significant difference in absorption of undoped and doped composite can also be inferred from the sharp decrement in reflectance of x = 0.9 mol% doped sample in the range 250–450 nm as indicated in inset of the Fig. 7(a). Bands for both the cerium doped samples can unambiguously be assigned to Ce3+ 4f → 5d transitions. Shift in absorption wavelength of doped composite as compared to doped LAO is may be due to variation in band gap of the synthesized nano-composite.
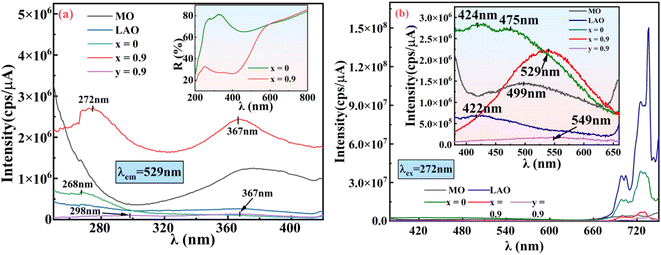 |
| | Fig. 7 (a) PLE spectra, (b) PL spectra of MO, LAO, La1−xCexAlO3/MgO (x = 0, 0.9 mol%), La1−yCeyAlO3 (y = 0.9 mol%) while the insets of (a) is reflectance vs. wavelength (λ) curve for La1−xCexAlO3/MgO (x = 0, 0.9 mol%) and that of (b) is zoomed-in PL spectra of given samples. | |
3.3.2 PL emission spectra of doped/undoped nano-composite and its components. The Fig. 7(b) depicts the PL emission spectra of doped/undoped nano-composite and its individual components in the range 380–750 nm at the excitation wavelength of 272 nm whereas its inset reflects the zoomed-in image of the same in the range 380–660 nm. Peaks after 675 nm are mainly due to defects formed, which are maximized for LAO.47,48 These defects reduce after composite formation and further diminish for the doped nano-composites. In the inset, MO emits strongly before wavelength of 400 nm and then at 499 nm. These can be attributed to various F-centers, oxygen vacancies and surface charge transfers for initial rise and to transition 3B1u → 1Ag for later increment whereas LAO shows almost no luminescence in the visible region, but a little in UV region at 422 nm.48,49 However, the pristine composite formed out of these two i.e. LaAlO3/MgO shows strong emission about 424 and 475 nm but this also lies considerably in the UV region. For Ce3+ doped La1−yCeyAlO3 (y = 0.9 mol%) and La1−xCexAlO3/MgO (x = 0.9 mol%), luminescence for both lies in green region with the later being highly intense.21 This justifies the efficient behavior of composite than its individual components.
3.3.3 Effect of sintering temperature on PL emission at fixed doping concentration. Effect of sintering temperature (900–1200 °C) on La1−xCexAlO3/MgO (x = 0.9 mol%) has been represented in Fig. 8(a) in which there is a subsequent red shift as temperature rises because ‘D’ increases with sintering temperature which decreases quantum confinement and hence reduces band gap.44 Also, PL intensity initially decreases when temperature rises to 1000 °C, thereafter gradually intensifies with rise in temperature upto 1200 °C. This trend is due to change in crystallite size with temperature. As ‘D’ increases with temperature, surface area decreases. Since PL is a surface phenomenon, therefore, its intensity reduces. Whereas, with increasing temperature, its crystallinity improves, dopant ion substitutes better into the host matrix and grain boundary effect reduces which leads to increment in PL.50 Hence, former factor dominates initially and later dominates thereafter. Therefore, all the samples have been sintered at 1200 °C.
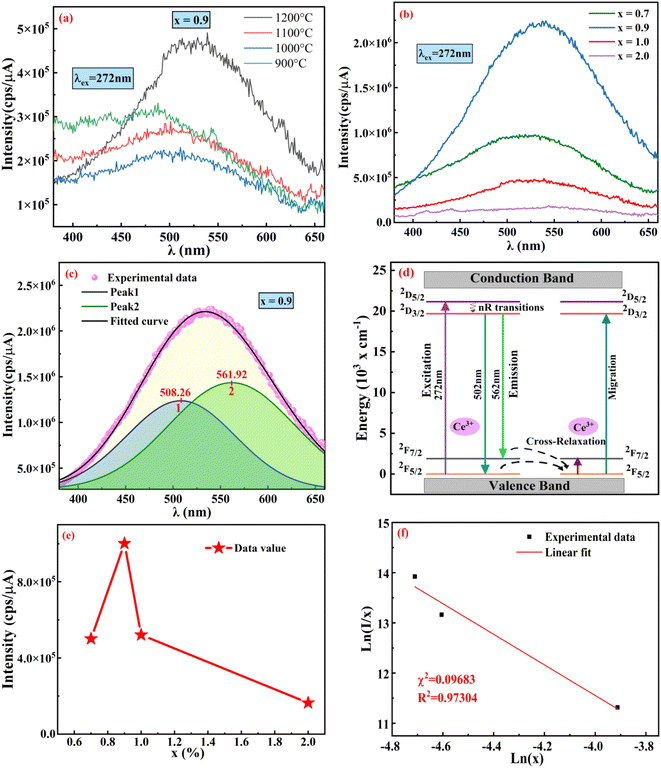 |
| | Fig. 8 (a) PL spectra of La1−xCexAlO3/MgO (x = 0.9 mol%) sintered at various temperatures, (b) relative PL spectra vs. wavelength (λ) for La1−xCexAlO3/MgO (x = 0, 0.7, 0.9, 1.0, 2.0 mol%), (c) deconvoluted PL spectra of La1−xCexAlO3/MgO (x = 0.9 mol%), (d) schematic energy diagram, (e) relative PL intensities vs. dopant concentration (x mol%) and (f) plot of ln(I/x) vs. ln(x). | |
3.3.4 Effect of doping concentration on PL emission at fixed sintering temperature. Pl emission spectra for Ce3+ doped phosphors La1−xCexAlO3/MgO (x = 0.7, 0.9, 1.0, 2.0 mol%) by monitoring excitation wavelength at 272 nm was recorded. As shown in Fig. 8(b) the emission spectra of all the phosphor samples are absolutely alike i.e. a broad band centered about 529 nm. These can be de-convoluted into 2 broad peaks situated at 508.26 nm and 561.92 nm with the energy difference of 1892 cm−1, which is close to theoretical value of 2000 cm−1, as depicted in Fig. 8(c).51 These peaks arise due to 5d → 2F5/2 and 5d → 2F7/2 transitions as indicated in schematic energy diagram (Fig. 8(d)). Fig. 8(e) shows the relative PL intensities of all the doped phosphors for peak at 508.26 nm in which x = 0.9 mol% proves to be the optimum concentration to fabricate green emissive phosphor. Decrement of emission intensity beyond optimum concentration is ascribed to the phenomenon of concentration quenching (CQ) occurring due to non-radiative (nR) energy relocations amongst activator ions. To investigate the valid reason behind CQ, Blasse's (5) has been resolved to calculate the critical distance, Rc (Å) as| |
 | (5) |
where V is the volume of unit cell, X is the optimum activator concentration and N is the number of cations to be substituted per unit cell and RC is the separation between contiguous activator.52 For RC < 5 Å, nR energy migration takes place via exchange interaction and if it is >5 Å multipolar interactions come into play. For x = 0.9 mol% system, V = 325.225 Å3, X = 0.007 and N = 1, using these RC has been reckoned to be 44.602 Å which is far larger than 5 Å that indicates nR energy transfer takes place via multi-polar interactions. Further, Dexter's theory and Reisfeld's approximation is employed, given by the following relation,| |
 | (6) |
where, I is the emission intensity and x is the dopant concentration, K and β are constants for given host lattice and Q helps to identify the kind of interaction.53 Q may take the values 6, 8 and 10 for dipole–dipole (d–d), dipole–quadrupole (d–q) and quadrupole–quadrupole (q–q) multi-photon interaction respectively. Eqn (6) can be simplified as,| |
 | (7) |
where A is some constant. Plot of (7) in Fig. 8(f) gives slope −Q/3 which in present study yields Q to be 9.142 that is approximately equal to 10, predicting q–q multi-polar interaction to be the underlying plausible mechanism for CQ in Ce3+ doped La1−xCexAlO3/MgO phosphors.
4. Time-resolved PL spectroscopy
The PL decay profiles of all the La1−xCexAlO3/MgO (x = 0, 0.7, 0.9, 1.0 and 2.0 mol%) phosphors were recorded for the peak at 562 nm under 272 nm excitation wavelength for 15 ms, which aptly fits bi-exponential function (8) (typical graph for x = 0.9 mol% has been shown in Fig. 9(a)). Estimated lifetimes (τ) using appropriate (9) have been indicated in Table 3.| |
 | (8) |
| |
 | (9) |
where, I is the emission intensity at time t, τ1 and τ2 are two exponential components of τ and I′, A1 and A2 are fitting parameter constants.4 With the perusal of calculated data, it is noteworthy that with the rise in rare earth content, measured lifetimes significantly decrease implying energy transfer amongst activator ions. The energy transfer efficiencies (ηT) and probabilities (P) expressed by the (10) and (11) below| |
 | (10) |
| |
 | (11) |
where, τs and τs0 are the estimated lifetimes of phosphor with and without Ce3+ ions.3,54 The estimated values as mentioned in Table 3 show the rise in both the parameters as the activator concentration goes on increasing. Such trend of decreasing τ and increasing ηT, P with increasing activator content can be attributed to energy transfer between Ce3+–Ce3+ ions. This energy transfer may be due to cross-relaxation processes amongst activator ions that may be enhanced with energy migration of excitation energy that can accelerate the decay process. Here, Ce3+ ion plays the dual role i.e. as donor as well as acceptor ion. The cross-relaxation process involves the exodus of emitting 2D3/2 level via the transitions 2D3/2: 2F5/2 → 2F7/2: 2F7/2 and 2D3/2: 2F5/2 → 2F5/2: 2F7/2 while energy migration involves the de-population via the transitions between neighbouring excited and ground state Ce3+ ions through 2D3/2: 2F5/2 → 2F7/2: 2D3/2 transition (Fig. 8(d)).
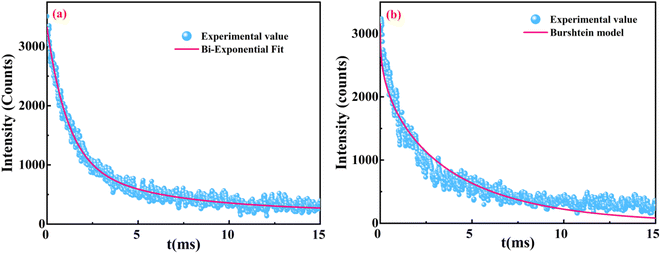 |
| | Fig. 9 (a) Bi-exponential fit for La1−xCexAlO3/MgO (x = 0.9 mol%) and (b) Burshtein model fit for La1−xCexAlO3/MgO (x = 1.0 mol%). | |
Table 3 Detailed TRPL data profiles of La1−xCexAlO3/MgO (x = 0, 0.7, 0.9, 1.0 and 2.0 mol%); τ = life-time, ηT = energy transfer efficiency, PnR = energy transfer probability, S = fitting index, R0 = critical distance, CDA = donor to acceptor energy transfer rate, Wm = energy migration rate
| x (mol%) |
τ (ms) |
ηT (%) |
PnR |
S |
R0 (Å) |
CDA (×10−83 m10 s−1) |
Wm (×10−19 s−1) |
| 0 |
5.763 |
|
|
|
|
|
|
| 0.7 |
4.676 |
18.853 |
0.040 |
10.86 |
57.98 |
745 |
2.06 |
| 0.9 |
4.084 |
29.138 |
0.071 |
9.40 |
54.61 |
409 |
2.29 |
| 1.0 |
3.852 |
33.166 |
0.086 |
9.45 |
51.49 |
227 |
12.1 |
| 2.0 |
3.776 |
34.480 |
0.091 |
11.67 |
37.10 |
8.57 |
417 |
Standard energy transfer model ‘Burshtein model’ has been employed to investigate the energy transfer mechanism behind CQ which can be expressed as
| |
 | (12) |
| |
 | (13) |
where,
I(
t) and
I0 are the emission intensities at time
t and initial intensity,
τ0 is the intrinsic decay time of donor ion and
Q,
S and
Wm are the fitting parameters.
55 Respective fitting curve for La
1−xCe
xAlO
3/MgO (
x = 1.0 mol%) phosphor has been depicted in
Fig. 9(b) and calculated fitting parameters have been tabularized in
Table 3 for all the doped phosphors.
Q is the energy transfer parameter given by
(13), where
N0 is the acceptor ion concentration and
R0 is the critical distance between dopant ions at which energy transfer rate to acceptor is equal to the rate of intrinsic decay of donor ion.
R0 is given by
(14) in which
CDA is the rate of direct energy transfer from donor to acceptor.
Wm in
(12) is the rate of energy migration among donor ions.
S is the index of mechanism involved that can take the values 6, 8 and 10 for d–d, d–q and q–q multi-pole interaction respectively. It is note-worthy from
Table 3 that the value of
S revolve around 10 implying energy transfer mechanism to be q–q multi-pole interactions supporting the results from PL emission spectra. Also the value of
R0 decreases with increase in dopant concentration which results in better energy transfer efficiencies. For lower concentration of Ce
3+, C
DA value is much higher and
Wm is pretty low while for
x = 2.0 mol%,
CDA reduces significantly whereas
Wm increases by the order of 10
2. This signifies the shift in energy tranfer process from cross-relaxation for lower concentration to energy migration process at higher concentration. Such shifts in mechanism with doping have also been reported earlier in other materials.
56
5. Band gap determination and chromaticity diagram
Energy band gaps of prepared pristine nano composite, its components, optimized doped nano-composite and its competent i.e. La1−yCeyAlO3 (y = 0.9 mol%) were calculated via Kubelka–Munk equation relating scattering (S), absorption (K) and reflection (R) coefficients as| |
 | (15) |
where h, ν and Eg are Planck's constant, frequency and band gap of the material.57 Here exponent ‘n’ can take values 1/2, 3/2, 2, 3 for direct allowed, forbidden, indirect allowed, forbidden transitions respectively. Taking, n = 1/2 for direct allowed transition and calculating band gap by extrapolating tangent drawn to curve in Tauc plot ((αhν)1/n vs. hν) (depicted in Fig. 10(a)) and tabulating the results in Table 4.58 It can be manifested from the tabularized values that both MO and LAO are high band gap semiconductors having Eg 6.10 and 5.81 eV respectively that resemble the earlier reported values.8,10 Because of large band gap values both are appropriate for host material. Composite of these two, LaAlO3/MgO also show high optical band gap of 5.74, but slightly less than the individual components which may be due to inter-mixing of electronic states of two phases resulting in shifting of valence band and conduction band leading to decreased energy gap.59 Upon Ce3+ doping, Eg of optimized nanophosphor (La1−xCexAlO3/MgO (x = 0.9 mol%)) and La1−yCeyAlO3 (y = 0.9 mol%) reduces to 5.53 and 5.66 eV because of extra electronic state occurrence within the host bandgap.51 But reduction in prepared doped nano-composite is considerably large which results in PL emission wavelength shift relative to individually doped LAO. This justifies the advantage of prepared nano-phosphor composite over individually Ce3+ doped LAO.
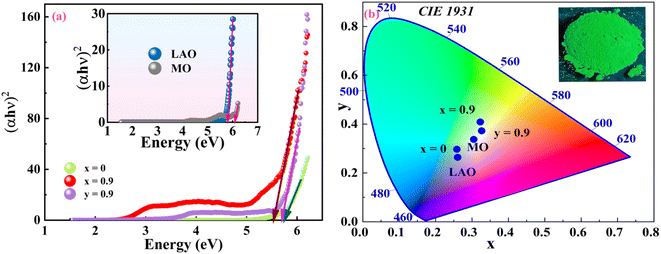 |
| | Fig. 10 (a) Tauc plot and (b) CIE-1931 chromaticity diagram for MO, LAO, La1−xCexAlO3/MgO (x = 0 and 0.9 mol%) and La1−yCeyAlO3 (y = 0.9 mol%). | |
Table 4 Optical band gap (Eg), CIE (x, y) coordinates, CCT of MO, LAO, La1−xCexAlO3/MgO (x = 0 and 0.9 mol%) and La1−yCeyAlO3 (y = 0.9 mol%)
| Sample/x (mol%)/y (mol%) |
Eg (eV) |
CIE (x, y) |
CCT (K) |
| MO |
6.10 |
(0.30474, 0.33730) |
4392 |
| LAO |
5.81 |
(0.26061, 0.26381) |
1913 |
| x = 0 |
5.74 |
(0.25837, 0.29706) |
2421 |
| x = 0.9 |
5.53 |
(0.32270, 0.40902) |
5234 |
| y = 0.9 |
5.66 |
(0.32653, 0.37266) |
5316 |
To identify the color rendering features of generated nano-phosphor powders, color coordinates have been evaluated (tabularized in Table 4) using International Commission of Illumination (CIE) – 1931 color triangle shown in Fig. 10(b). The inset shows the green color luminescence of optimized phosphor under short range UV radiation exposure and similar color is shown in color triangle. Calculated CIE coordinates have been utilized to reckon the coordinated color temperature (CCT) given by the expression given by Mc-Camy as
| | |
CCT = 437n3 + 3601n2 + 6861n + 5514.31
| (17) |
where
n = (
x −
xc)/(
y −
yc), (
xc,
yc) are chromaticity epicentres having values (0.332, 0.186).
60 CCT values for the samples lie in the range of 1900–5400 K. For CCT < 4000 K, rendered light is said to be warm light and for >5000 K it is called cooled light. This unveils that optimised nanophosphor La
1−xCe
xAlO
3/MgO (
x = 0.9 mol%) renders cool light which justifies the candidature of prepared nanophosphor for potential applications in w-LEDs, LFP, display devices, scintillation devices, solar cells,
etc.
6. Application for latent finger printing
Optimized nano-phosphor was utilized for LFP application. Upon visualization of glass slide under 272 nm UV lamp dusted with La1−xCexAlO3/MgO (x = 0.9 mol%) shows several appreciable features of finger pattern. Fig. 11(a) and (b) shows the fingerprint pattern in day light and under UV light respectively. Level 1 coarse feature such as ridge flow pattern, loops and archs are visible in Fig. 11(b). More detailed features like ridge bifurcation, bridge, island and short ridge can be seen in Fig. 11(c)–(f) respectively. Minutest features belonging to level 3, which are hardest to unveil, can also be visualized using this phosphor as sweat pores and dots can be seen in Fig. 11(g) and (h) respectively. This indicates the utility of synthesized phosphor for LFP applications as well as photonic applications.
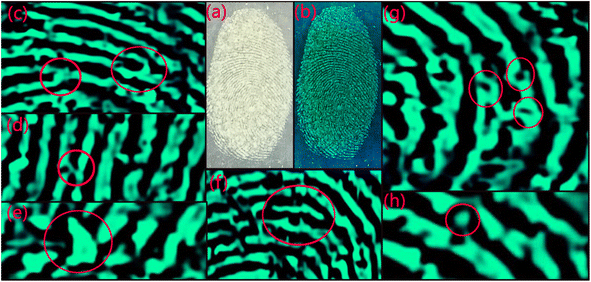 |
| | Fig. 11 Fingerprint pattern under (a) day light, (b) 254 nm UV light, zoomed-in images of (b) indicating level 2 and 3 are shown in (c) ridge-bifurcation, (d) bridge, (e) island, (f) short ridge, (g) sweat-pores and (h) dots. | |
7. Conclusions
A series of novel cerium doped La1−xCexAlO3/MgO (x = 0, 0.7, 0.9, 1.0 and 2.0 mol%) have successfully been synthesized via a robust, low temperature and cost effective synthesis method, i.e. Pechini sol–gel method. The composite so formed have been found to possess rhombohedral/face-centered structure and emits green color luminescence under UV excitation. The effect of dopant ion concentration on luminescence has been studied which reveals x = 0.9 mol% to be the optimum concentration. q–q multipole interaction has been found to be the plausible reason behind CQ. Successful application of optimized phosphors for LFP application suggests it to be the suitable candidate phosphors for photonic as well as imaging applications.
Author contributions
Ashima Makhija: conceptualization, methodology, writing – original draft, Anjli Sharma: methodology, writing – original draft. Sajjan Dahiya: data curation, formal analysis, review. Nisha Deopa: formal analysis, editing. Rajesh Malik: resources, formal analysis. R. Punia: supervision, software. A. S. Maan: resources, validation.
Conflicts of interest
There are no conflicts to declare.
Acknowledgements
Authors would like to convey their heartfelt thanks to UGC, New Delhi, and DST for granting funds under UGC-SAP (F530/5/DRS/2012(SAP-I)) and DST-FIST (SR/FST/PSI-162/2011) to Department of Physics, MDU Rohtak. One of the authors, Ashima Makhija acknowledges Maharshi Dayanand University, Rohtak for the financial aid by the award of URS (No. R&S/R-12/22/URS/5023).
References
- J. Dwivedi, P. Kumar, A. Kumar, Sudama, V. N. Singh, B. P. Singh, S. K. Dhawan, V. Shanker and B. K. Gupta, RSC Adv., 2014, 4, 54936–54947 RSC.
- M. K. Sahu, M. Jayasimhadri, K. Jha, B. Sivaiah, A. S. Rao and D. Haranath, J. Lumin., 2018, 202, 475–483 CrossRef CAS.
- P. Sehrawat, R. K. Malik, P. Boora, M. Punia, M. Sheoran, P. Chhillar, S. P. Khatkar and V. B. Taxak, Chem. Phys. Lett., 2021, 763, 138243 CrossRef CAS.
- R. Lohan, A. Kumar, M. K. Sahu, A. Mor, V. Kumar, N. Deopa and A. S. Rao, J. Mater. Sci.: Mater. Electron., 2023, 34(8) DOI:10.1007/s10854-023-10055-z.
- S. Kaur, A. S. Rao, M. Jayasimhadri, B. Sivaiah and D. Haranath, J. Alloys Compd., 2019, 802, 129–138 CrossRef CAS.
- M. A. Farrukh, K. M. Butt, K. K. Chong and W. S. Chang, J. Saudi Chem. Soc., 2019, 23, 561–575 CrossRef CAS.
- Z. Liu, L. Sinatra, M. Lutfullin, Y. P. Ivanov, G. Divitini, L. De Trizio and L. Manna, Adv. Energy Mater., 2022, 12(38), 2201948 CrossRef CAS.
- T. Manohar, S. C. Prashantha, R. Naik, H. Nagabhushana, H. P. Nagaswarupa, K. S. Anantharaju, K. M. Girish and H. B. Premkumar, Sens. Actuators, B, 2017, 243, 1057–1066 CrossRef CAS.
- N. Badar, N. F. Chayed, R. Rusdi, N. Kamarudin and N. Kamarulzaman, Adv. Mater. Res., 2012, 545, 157–160 CAS.
- C. Nor Fadilah, K. Norlida, B. Nurhanna and E. Kelimah, Solid State Phenom., 2019, 290, 323–328 Search PubMed.
- M. Sheoran, P. Sehrawat, N. Kumari, M. Kumar and R. K. Malik, Chem. Phys. Impact, 2022, 4, 100063 CrossRef.
- S. K. Baghel, N. Brahme, D. P. Bisen, Y. Patle, T. Richhariya, E. Chandrawanshi and C. Belodhiya, Opt. Mater., 2022, 126, 112141 CrossRef CAS.
- G. J. Jeong, T. W. Kang, Y. J. Park, Y. J. Park, Y. Lee, B. Bae and S. W. Kim, RSC Adv., 2021, 11, 24949–24957 RSC.
- T. Richhariya, N. Brahme, D. P. Bisen, T. Badapanda, K. Tiwari and A. Jain, Mater. Sci. Semicond. Process., 2023, 159, 107396 CrossRef CAS.
- G. Dantelle, D. Testemale, E. Homeyer, A. Cantarano, S. Kodjikian, C. Dujardin, J.-L. Hazemann and A. Ibanez, RSC Adv., 2018, 8, 26857–26870 RSC.
- T. Kang, S. Lim, S. Lee, H. Kang, Y. Yu and J. Kim, Opt. Mater., 2019, 98, 109501 CrossRef CAS.
- J. Chan, L. Cao, W. Li, N. Ma, Z. Xu and X. Huang, Inorg. Chem., 2022, 61, 6953–6963 CrossRef CAS PubMed.
- B. Evangeline, P. A. Azeem, R. Prasada Rao, G. Swati and D. Haranath, J. Alloys Compd., 2017, 705, 618–623 CrossRef CAS.
- X. D. Wang, T. Pan, T. C. Zang, J. K. Li, Z. W. Zhao, L. H. Zhang and J. Xu, Sci. China, Ser. E: Technol. Sci., 2009, 52, 3678–3682 CrossRef CAS.
- T. Manohar, S. C. Prashantha, H. Nagabhushana, K. Channakeshavalu and H. P. Nagaswarupa, Mater. Today: Proc., 2017, 4, 11848–11856 Search PubMed.
- Yashaswini, S. Pratibha, R. Lokesh, N. Dhananjaya and C. Pandurangappa, Inorg. Chem. Commun., 2023, 34(8), 108342 Search PubMed.
- R. Shi, L. Yu, Y. Tian, X. Wang, Z. Sun, B. Qi and F. Luo, Mater. Chem. Phys., 2022, 280, 1–10 CrossRef.
- K. Si-ahmed and Y. Bessekhouad, Mater. Today Commun., 2022, 31, 103450 CrossRef.
- D. Navami, G. P. Darshan, D. R. Lavanya, H. B. Premkumar, S. C. Sharma, H. Adarsha, H. C. Prameela and H. Nagabhushana, Opt. Mater., 2021, 122, 111474 CrossRef CAS.
- C. R. Garcia, J. Oliva and L. A. Diaz-torres, Ceram. Int., 2021, 47, 10–41 CrossRef.
- J. Carvajal, Acta Crystallogr., 1967, 22, 151 CrossRef.
- H. M. Rietveld, J. Appl. Crystallogr., 1969, 2, 65–71 CrossRef CAS.
- K. Momma and F. Izumi, J. Appl. Crystallogr., 2011, 44, 1272–1276 CrossRef CAS.
- X. Dong, X. Cui, Z. Fu, S. Zhou, S. Zhang and Z. Dai, Mater. Res. Bull., 2012, 47, 212–216 CrossRef CAS.
- A. B. S. Garcia, A. G. Bispo Jr, S. A. M. Lima and A. M. Pires, Mater. Res. Bull., 2021, 143, 111462 CrossRef CAS.
- S. Ghorbani, R. S. Razavi, M. R. Loghman-Estarki and A. Alhaji, J. Cluster Sci., 2017, 28, 1523–1539 CrossRef CAS.
- I. S. Silveira, N. S. Ferreira and D. N. Souza, Ceram. Int., 2021, 47, 27748–27758 CrossRef CAS.
- P. Kumar, S. Singh, I. Gupta, V. Kumar and D. Singh, Inorg. Chem. Commun., 2022, 141, 109578 CrossRef CAS.
- D. Singh, J. Kaur, N. S. Suryanarayana, R. Shrivastava and V. Dubey, J. Mater. Sci.: Mater. Electron., 2017, 28, 2462–2470 CrossRef CAS.
- M. Beheshti and R. Malekfar, Mater. Chem. Phys., 2021, 270, 124848 CrossRef CAS.
- S. Kozuka, J. Ueda and S. Tanabe, Phys. B, 2022, 633, 413492 CrossRef CAS.
- P. Ankoji and B. Hemalatha Rudramadevi, Opt. Mater., 2019, 95, 109249 CrossRef CAS.
- E. B. Shaik, B. V. N. Kumar, S. K. Chirauri and K. R. Rao, J. Mater. Sci.: Mater. Electron., 2022, 33, 105–114 CrossRef CAS.
- M. Rizwan, S. Gul, T. Iqbal, U. Mushtaq, M. H. Farooq, M. Farman, R. Bibi and M. Ijaz, Mater. Res. Express, 2019, 6(11), 112001 CrossRef CAS.
- P. Sharma, N. Berwal, N. Ahlawat, A. S. Maan and R. Punia, Ceram. Int., 2019, 45, 20368–20378 CrossRef CAS.
- W. Hume-Rothery, J. Inst. Met., 1926, 35, 295–361 Search PubMed.
- P. Debye and P. Scherrer, Phys. Z., 1916, 17, 277–283 CAS.
- W. Hall and G. K. Williamson, Acta Metall., 1953, 1, 22–31 CrossRef.
- R. H. Krishna, B. M. Nagabhushana, H. Nagabhushana, N. S. Murthy, S. C. Sharma, C. Shivakumara and R. P. S. Chakradhar, J. Phys. Chem. C, 2013, 117, 1915–1924 CrossRef CAS.
- B. D. Cullity, Elements of X-ray Diffraction, Addison-Wesley Publishing, 1956 Search PubMed.
- N. Siedl, D. Koller, A. K. Sternig, D. Thomele and O. Diwald, Phys. Chem. Chem. Phys., 2014, 16, 8339–8345 RSC.
- N. I. Mukhurov, S. P. Zhvavyi, I. V. Gasenkova, S. N. Terekhov, P. P. Pershukevich and V. A. Orlovich, J. Appl. Spectrosc., 2010, 77, 591–597 CrossRef.
- J. Q. Chen, X. Wang, Y. H. Lu, A. Roy Barman, G. J. You, G. C. Xing, T. C. Sum, S. Dhar, Y. P. Feng, Ariando, Q. H. Xu and T. Venkatesan, Appl. Phys. Lett., 2011, 98, 1–4 Search PubMed.
- P. B. Devaraja, D. N. Avadhani, S. C. Prashantha, H. Nagabhushana, S. C. Sharma, B. M. Nagabhushana and H. P. Nagaswarupa, Spectrochim. Acta, Part A, 2014, 118, 847–851 CrossRef CAS PubMed.
- S. Agarwal, M. S. Haseman, A. Khamehchi, P. Saadatkia, D. J. Winarski and F. A. Selim, Opt. Mater. Express, 2017, 7, 1055 CrossRef CAS.
- H. Dalal, M. Kumar, P. Sehrawat, M. Sheoran, N. Sehrawat, S. Kumar and R. K. Malik, J. Mater. Sci.: Mater. Electron., 2022, 33, 13743–13756 CrossRef CAS.
- G. Blasse, Philips Res. Rep., 1969, 24, 131 CAS.
- D. L. Dexter, J. Chem. Phys., 1953, 21, 836–850 CrossRef CAS.
- S. Kaur, A. S. Rao and M. Jayasimhadri, Mater. Res. Bull., 2019, 116, 79–88 CrossRef CAS.
- A. D. Sontakke, K. Biswas, A. K. Mandal and K. Annapurna, Appl. Phys. B: Lasers Opt., 2010, 101, 235–244 CrossRef CAS.
- G. Gupta, S. Balaji, K. Biswas and K. Annapurna, AIP Adv., 2019, 9(4), 045201 CrossRef.
- R. Punia, R. S. Kundu, J. Hooda, S. Dhankhar, S. Dahiya and N. Kishore, J. Appl. Phys., 2011, 110(3), 033527 CrossRef.
- J. Tauc, Mater. Res. Bull., 1970, 5, 721–729 CrossRef CAS.
- H. M. Shanshool, M. Yahaya, W. M. M. Yunus and I. Y. Abdullah, J. Mater. Sci.: Mater. Electron., 2016, 27, 9804–9811 CrossRef CAS.
- C. S. McCamy, Color Res. Appl., 1992, 17, 142–144 CrossRef.
|
| This journal is © The Royal Society of Chemistry 2023 |
Click here to see how this site uses Cookies. View our privacy policy here.  Open Access Article
 b,
Rajesh Malik
 c,
R. Punia
 *a and
A. S. Maana
![[thin space (1/6-em)]](https://www.rsc.org/images/entities/char_2009.gif) 000 h), fast switching, etc.1,2 Current mainstream patterns of developing w-LEDs involve either the encapsulation of blue LEDs with yellow emitting phosphor YAG:Ce3+ or pumping trichromatic blue, green, red (BRG) phosphors with UV light.3,4 However, the first strategy suffers due to high CCT, low color rendering index (Ra < 80), halo-effect, thermal quenching, etc. In the later category, the commercially used tri-color phosphor materials are BaMgAl10O17:Eu2+ for blue, ZnS:(Cu+, Al+) for green and Y2O2S:Eu3+ for red emission. But the thermal and chemical stability of sulphide phosphors is very low. Moreover, they are also prone to emit sulphur gas into the atmosphere, thus are toxic.5 Resultantly, myriad research is being done in search of a novel phosphor matrix possessing efficient characteristics. Recent years have witnessed the trend of developing and exploring nano-composite materials to solve innumerous inexorable problems including nano-phosphor composite materials.6,7 However, the rate of research on composite phosphors is much less than the research being done on crystalline and glassy materials.
000 h), fast switching, etc.1,2 Current mainstream patterns of developing w-LEDs involve either the encapsulation of blue LEDs with yellow emitting phosphor YAG:Ce3+ or pumping trichromatic blue, green, red (BRG) phosphors with UV light.3,4 However, the first strategy suffers due to high CCT, low color rendering index (Ra < 80), halo-effect, thermal quenching, etc. In the later category, the commercially used tri-color phosphor materials are BaMgAl10O17:Eu2+ for blue, ZnS:(Cu+, Al+) for green and Y2O2S:Eu3+ for red emission. But the thermal and chemical stability of sulphide phosphors is very low. Moreover, they are also prone to emit sulphur gas into the atmosphere, thus are toxic.5 Resultantly, myriad research is being done in search of a novel phosphor matrix possessing efficient characteristics. Recent years have witnessed the trend of developing and exploring nano-composite materials to solve innumerous inexorable problems including nano-phosphor composite materials.6,7 However, the rate of research on composite phosphors is much less than the research being done on crystalline and glassy materials.
![[thin space (1/6-em)]](https://www.rsc.org/images/entities/char_2009.gif) :
:![[thin space (1/6-em)]](https://www.rsc.org/images/entities/char_2009.gif) 1 (CA
1 (CA![[thin space (1/6-em)]](https://www.rsc.org/images/entities/char_2009.gif) :
:![[thin space (1/6-em)]](https://www.rsc.org/images/entities/char_2009.gif) M) was added and stirred vigorously at 80 °C until gelation occurs. Thereafter, temperature was raised to 120 °C that lead to auto-combustion followed by frothing and fuming resulting in white coloured wet-sponges that turn into dry brown sponges (as-prepared dried xerogel) within a few minutes. The resultant is subsequently powdered using mortar pestle and then sintered at different calcination temperatures for 3 h over the range of 650 °C–1200 °C for further characterizations. Out of these dopant concentrations, it was observed that x = 0.3 and 0.5 mol% shows negligible luminescence. Observable luminescence began with x = 0.7 mol% that reached its maxima for x = 0.9 mol% and decreased thereafter for increasing Ce3+ concentrations. Therefore, x = 0.7, 0.9, 1.0 and 2.0 mol% were studied in detail.
M) was added and stirred vigorously at 80 °C until gelation occurs. Thereafter, temperature was raised to 120 °C that lead to auto-combustion followed by frothing and fuming resulting in white coloured wet-sponges that turn into dry brown sponges (as-prepared dried xerogel) within a few minutes. The resultant is subsequently powdered using mortar pestle and then sintered at different calcination temperatures for 3 h over the range of 650 °C–1200 °C for further characterizations. Out of these dopant concentrations, it was observed that x = 0.3 and 0.5 mol% shows negligible luminescence. Observable luminescence began with x = 0.7 mol% that reached its maxima for x = 0.9 mol% and decreased thereafter for increasing Ce3+ concentrations. Therefore, x = 0.7, 0.9, 1.0 and 2.0 mol% were studied in detail.
![[3 with combining macron]](https://www.rsc.org/images/entities/char_0033_0304.gif) m (225)) and for LAO it matches well with card #82-0478 (space group: R
m (225)) and for LAO it matches well with card #82-0478 (space group: R![[3 with combining macron]](https://www.rsc.org/images/entities/char_0033_0304.gif) c (167)) as well as with card #31-0022 (space group: Pm3m (221)) since both the cards possess peaks at same positions with different miller indices. S. Kozuka et al., I. S. Silveira et al., D. Singh et al., M. Beheshti et al. have reported it to be rhombohedral whereas authors such as P. Kumar et al., E. B. Shaik et al. and P. Ankoji et al. have reported it to be belonging to later space group having primitive cubic structure.32–38 LAO is known to transit from rhombohedral to primitive structure around 800 K.39 So, at room temperature its XRD should be ascribed to rhombohedral space group. To ascertain the same, Rietveld refinement of diffractograms using both the space groups have been performed and displayed in Fig. 4(a) and (b). Chi-square and R-factors for both the models were found to be in acceptable range, with chi-square value being lower for the rhombohedral model. To support this experimentally, polarization vs. electric field (P–E) hysteresis curve tracing experiment at room temperature had been conducted using pallet of the nano-composite so formed. In this, an oscillating electric field at a constant potential difference is applied across the crystal that induces spontaneous polarization within it thus, material exhibits hysteresis loop. As a matter of fact, cubically symmetric crystals can never be polarized because centre of charges for both the anion and cation coincides under given symmetric conditions and will never be separated for dipole formation whereas for non-cubic crystals such segregation of centre of charges may take place leading to dipole formation and hence resultant polarization.40 Presence of hysteresis curve in Fig. 4(c) corroborates the fact that the material is non-cubic at room temperature. So the nano-composite so formed has crystallized into rhombohedral space group.
c (167)) as well as with card #31-0022 (space group: Pm3m (221)) since both the cards possess peaks at same positions with different miller indices. S. Kozuka et al., I. S. Silveira et al., D. Singh et al., M. Beheshti et al. have reported it to be rhombohedral whereas authors such as P. Kumar et al., E. B. Shaik et al. and P. Ankoji et al. have reported it to be belonging to later space group having primitive cubic structure.32–38 LAO is known to transit from rhombohedral to primitive structure around 800 K.39 So, at room temperature its XRD should be ascribed to rhombohedral space group. To ascertain the same, Rietveld refinement of diffractograms using both the space groups have been performed and displayed in Fig. 4(a) and (b). Chi-square and R-factors for both the models were found to be in acceptable range, with chi-square value being lower for the rhombohedral model. To support this experimentally, polarization vs. electric field (P–E) hysteresis curve tracing experiment at room temperature had been conducted using pallet of the nano-composite so formed. In this, an oscillating electric field at a constant potential difference is applied across the crystal that induces spontaneous polarization within it thus, material exhibits hysteresis loop. As a matter of fact, cubically symmetric crystals can never be polarized because centre of charges for both the anion and cation coincides under given symmetric conditions and will never be separated for dipole formation whereas for non-cubic crystals such segregation of centre of charges may take place leading to dipole formation and hence resultant polarization.40 Presence of hysteresis curve in Fig. 4(c) corroborates the fact that the material is non-cubic at room temperature. So the nano-composite so formed has crystallized into rhombohedral space group.
![[3 with combining macron]](https://www.rsc.org/images/entities/char_0033_0304.gif) m/Fm
m/Fm![[3 with combining macron]](https://www.rsc.org/images/entities/char_0033_0304.gif) m, (b) R
m, (b) R![[3 with combining macron]](https://www.rsc.org/images/entities/char_0033_0304.gif) c/Fm
c/Fm![[3 with combining macron]](https://www.rsc.org/images/entities/char_0033_0304.gif) m and (c) polarization vs. electric field (P–E) hysteresis curve.
m and (c) polarization vs. electric field (P–E) hysteresis curve.


![[thin space (1/6-em)]](https://www.rsc.org/images/entities/char_2009.gif) cos
cos![[thin space (1/6-em)]](https://www.rsc.org/images/entities/char_2009.gif) θ vs. 4
θ vs. 4![[thin space (1/6-em)]](https://www.rsc.org/images/entities/char_2009.gif) sin
sin![[thin space (1/6-em)]](https://www.rsc.org/images/entities/char_2009.gif) θ gives straight line with slope of line equating to strain and reciprocal of intercept being propotional to D. Table 1 summarizes the calculated crystallite sizes and strains employing both the methods for all the samples. Fig. 5 depicts such W–H plot for La1−xCexAlO3/MgO (x = 0.7 mol%). Here, it is worth noting that W–H method gives larger ‘D’ because it helps eliminate strain-induced broadening, thus giving accurate ‘D’. From the perusal of data, it is observed that as sintering temperature rises, ‘D’ increases and ‘ε’ reduces for the both doped and undoped sample corroborating grain growth and better structure formation.44 For doped samples all sintered at 1200 °C, as the dopant concentration increases, ‘ε’ reduces because the dopant Ce3+ radii is smaller than the substituted La3+ radii causing lesser tensile stress.45
θ gives straight line with slope of line equating to strain and reciprocal of intercept being propotional to D. Table 1 summarizes the calculated crystallite sizes and strains employing both the methods for all the samples. Fig. 5 depicts such W–H plot for La1−xCexAlO3/MgO (x = 0.7 mol%). Here, it is worth noting that W–H method gives larger ‘D’ because it helps eliminate strain-induced broadening, thus giving accurate ‘D’. From the perusal of data, it is observed that as sintering temperature rises, ‘D’ increases and ‘ε’ reduces for the both doped and undoped sample corroborating grain growth and better structure formation.44 For doped samples all sintered at 1200 °C, as the dopant concentration increases, ‘ε’ reduces because the dopant Ce3+ radii is smaller than the substituted La3+ radii causing lesser tensile stress.45
![[3 with combining macron]](https://www.rsc.org/images/entities/char_0033_0304.gif) m
m![[3 with combining macron]](https://www.rsc.org/images/entities/char_0033_0304.gif) c
c![[3 with combining macron]](https://www.rsc.org/images/entities/char_0033_0304.gif) c
c![[3 with combining macron]](https://www.rsc.org/images/entities/char_0033_0304.gif) c
c![[3 with combining macron]](https://www.rsc.org/images/entities/char_0033_0304.gif) c
c![[3 with combining macron]](https://www.rsc.org/images/entities/char_0033_0304.gif) c
c![[3 with combining macron]](https://www.rsc.org/images/entities/char_0033_0304.gif) m
m![[3 with combining macron]](https://www.rsc.org/images/entities/char_0033_0304.gif) m
m![[3 with combining macron]](https://www.rsc.org/images/entities/char_0033_0304.gif) m
m![[3 with combining macron]](https://www.rsc.org/images/entities/char_0033_0304.gif) m
m![[3 with combining macron]](https://www.rsc.org/images/entities/char_0033_0304.gif) m
m![[3 with combining macron]](https://www.rsc.org/images/entities/char_0033_0304.gif) m
m


