 Open Access Article
Creative Commons Attribution 3.0 Unported Licence
Microsphere-supported gold nanoparticles for SERS detection of malachite green†
David T.
Hinds
a,
Samir A.
Belhout
 a,
Paula E.
Colavita
 b,
Andrew D.
Ward
 c and
Susan J.
Quinn
 *a
*a
aSchool of Chemistry, University College Dublin, Belfield, Dublin 4, Ireland. E-mail: susan.quinn@ucd.ie
bSchool of Chemistry and CRANN, Trinity College Dublin, College Green, Dublin 2, Ireland
cCentral Laser Facility, Research Complex at Harwell, STFC Rutherford Appleton Laboratory, Harwell Oxford, Didcot, Oxfordshire OX11 0FA, UK
First published on 14th January 2023
Abstract
Supported metal nanoparticles are attractive for wide ranging applications including catalysis and imaging. In this work we prepare surface-enhanced Raman scattering (SERS) active materials by exploiting the high surface area of porous carbon microspheres (CμP) to assemble high loadings of gold nanoparticles (AuNPs). The specific surface functionalization of CμPs is exploited to prepare composites by two approaches, (1) carboxylic acid surface groups are used to attract positively charged AuNPs and (2) a thiol functionalized surface is used to immobilize AuNPs. Ripening of the surface immobilized gold nanoparticles through hydroquinone treatment results in the preparation of a roughened gold surface with a 22-fold increase in the Au loading from 0.3 to 7.0 (mass Au/mass C). The materials were thoroughly characterized by UV-vis, Infrared and Raman spectroscopy, DLS, zeta potential, TEM and SEM. The SERS capacity of individual particles to detect malachite green, a mutagenic fungicide used in fish farming, was investigated using Raman optical tweezers. The challenges to trapping these materials due to the significant reflection, refraction and scattering properties of the Au-coated surfaces was overcome using a pinning approach. The measurements revealed the detection of malachite green at nM concentration and showed the potential of the porous carbon particles to act as versatile scaffolds for SERS applications.
Introduction
Gold nanoparticles (AuNP) are the subject of intensive research due to their size related properties and wide-ranging potential application in the areas of sensing,1 plasmon enhanced catalysis,2 drug delivery3 and radiosensitisation.4 Supported AuNP composite materials provide a localized high concentration of AuNPs, allow greater ease of manipulation and recovery, and improved resistance to aggregation, which can extend the application to more harsh environments, including biological media.5,6 Furthermore, the arrangement and organization of AuNPs at the support surface can allow the NP optical properties to be tuned through surface plasmon coupling phenomena.7 Composite AuNP materials have been routinely prepared by direct attachment of AuNPs, at the surface of a larger supporting particle, such as polymer beads,8 silica particles,9,10 nanotubes and graphene oxide,11,12 through electrostatic interactions or ligand binding. In addition, composites have been prepared by in situ growth of nanoparticles by reduction of the gold metal ions at the particle surface13 and within a polymer composite.14 We previously demonstrated the use of 100 nm to 200 nm polystyrene supports to prepare composite AuNP materials with enhanced stability to solutions of high ionic strength and to cell media.5 These polymer supported AuNPs have also been demonstrated to enhance the transport of AuNPs to cells for improved radiosensitization.6In contrast to polystyrene particles, porous carbon microparticles (CμP) have a high specific surface area and small pore sizes, which makes them attractive materials for the capture and delivery of small molecules for a variety of applications ranging from gas storage, to therapeutics to imaging agents.15–17 We recently demonstrated their efficient uptake by normal human embryonic Kidney (HEK 293) and ability to release non-covalently adsorbed fluorescent molecules, which were delivered throughout the cell.18 These particles can be routinely synthesized using an ultrasonic spray pyrolysis (USP) technique developed by Suslick and co-workers who have developed methods for the USP.19 In addition, porous carbon microspheres are readily functionalized and tolerate a range of surface chemistry procedures.16 The robust CμP substrate has been successfully used to prepare palladium NP composite materials with demonstrated surface-enhanced Raman scattering (SERS) activity20 or catalytic activity.21
Since the first observation of the SERS of pyridine molecules adsorbed at a roughened silver electrode by Fleischmann22 the sensitivity has been extensively exploited for molecule detection.23–27 Based on current understanding, the origin of the SERS enhancement is primarily attributed to either a chemical28 or an electromagnetic phenomenon.29–31 The chemical effect posits SERS to arise from charge transfer between a chemisorbed species and the metallic surface, which is highly dependent on the molecule. The electromagnetic effect results in the greatest enhancement and is the dominant source of SERS enhancement. This is related to the dielectric properties of the metal colloids and their plasmon frequency, with the SERS enhancement expected to be greater when the plasmon frequency of the nanoparticles is in resonance with the laser wavelength.
Noble metal composite particles are attractive SERS materials, whose activity is related to the nature of plasmonic ‘hot spots’ (areas of large electromagnetic enhancement between NPs) that arise due to the strength of coupling of adjacent AuNPs.32 SERS activity has also been shown to be dependent on the roughness of the metal surface.33 We have previously exploited controlled surface functionalization of polystyrene (PS) nanoparticles with lipoic acid groups to prepare plasmonic superstructures with tunable loading of spherical AuNPs at a PS particle surface and reported the AuNP size related SERS.7 PS microspheres have also been used as templates for the formation of SERS active giant vesicles decorated with gold nanowires34 while PS supported Ag nanostar particles combined with fluorescent labelling have also been developed for multimodal biological imaging.35 However, the application of polystyrene is limited by its non-biodegradable nature. Alternative support platforms for plasmonic assemblies include the use of larger metal nanoparticles, such as bimetallic Au/Ag core–shell superstructures prepared by selective growth of a discontinuous Ag shell at the Au nanorod core to prepare a SERS active surface.36
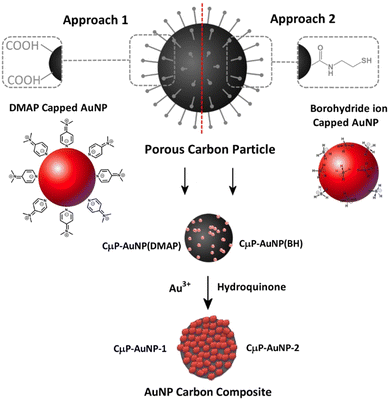
Following on from the developments of previous plasmonic superstructures we are interested to exploit the attractive properties of porous carbon particles, which are a low cost, widely available material that has been shown to be readily degraded in vivo37 to prepare SERS active materials. In this study we report the preparation of SERS substrate comprising a roughened AuNP surface formed at the surface of functionalized CμP prepared by USP of size 0.69 ± 0.24 μm. This is achieved using a two-step process that involves (1) the immobilization of small AuNPs (<5 nm) at the CμP surface and (2) the subsequent growth of the particles. Two approaches were investigated for the assembly of AuNPs. Approach 1 exploits electrostatic attraction of positively charged AuNPs to the negatively charged surface carboxylate groups while approach 2 exploits the affinity of amine and thiol containing cystamine groups at the carbon surface for the AuNP capping ligands.38 Access to roughened AuNPs were achieved by hydroquinone reduction of gold salt at the surface of the composite particles, see Scheme 1. The tolerance of the composite particles to repeated centrifugal washing allowed the isolation of pure composite materials.
Optical trapping and manipulation of these materials is a valuable characterization method that allows the discrete properties of individual composite particles to be studied.39 Furthermore, when optical trapping is combined with Raman microscopy it provides a powerful tool for the study of systems whose Raman spectra are otherwise difficult to obtain.40,41 It has previously been used to probe the SERS activity of metal activated particles42 and we recently demonstrated its use to enhance SERS activity as the AuNP size in the composite material increased.7 Metal composites that can be optically trapped have also been prepared as potential SERS probes of cellular membranes.43 In the final part of this study we demonstrate the SERS activity of individual composite particles to detect malachite green (MG). MG is a carcinogenic, teratogenic and mutagenic fungicide used in fish farming that has been restricted or banned in many countries and is not approved by the US Food and Drug Administration.44,45 However, a combination of the effectiveness and low cost of MG has led to illegal use and the necessity to develop techniques capable of detecting MG in commercial fish stocks.46 The results of the SERS activity studies demonstrate how the use of carbon particles may offer an intrinsically sustainable and versatile platform material for developing robust SERS probes that have the potential to be used to detect MG in solution. Importantly, the use of the optical tweezers allows the performance of individual composite particles to be characterized towards the development of discrete particle sensors.
Results and discussion
Preparation and characterization of AuNP carbon composite microspheres
This study describes the ability to use a porous carbon microsphere support to efficiently assemble gold nanoparticles from solution with high coverage. The CμPs were prepared by USP following the procedure of Skrabalak et al.19,47 The UV-Vis absorption spectrum in aqueous solution showed a broad featureless extinction between 200 and 800 nm (Fig. S1, ESI†). The extinction for the particles in this range window was found to be linearly proportional to concentration up to ∼0.25 absorption units. A plot of the absorption (at wavelengths in the visible) against particle concentration yields a standard curve, from which the concentration of the particle solution was determined. Oxidized particles (o-CμP) with surface carboxylic acid groups were generated by refluxing in 5 M nitric acid for 2 h according to previously reported methods.16 SEM images of the o-CμP revealed the presence of spherical particles 0.69 ± 0.24 μm in size (Fig. 1a and Fig. S2, ESI†) with good agreement observed for the size determined by DLS (0.69 ± 0.20 μm). A negative zeta potential in aqueous solution of −29.1 ± 3.5 mV is attributed to the presence of surface carboxylate groups at pH 7.An active surface area of 814 m2 g−1 was determined, with an average pore size of 9 nm. The o-CμP surface was further functionalized by bioconjugate carbodiimide coupling to form amide bonds to cystamine molecules, CA-CμP (Scheme S1, ESI†).48 As expected, the mild surface functionalization conditions and centrifugal washings were not found to influence the particle morphology, see Fig. S2 (ESI†). The reaction of the surface carboxylic acid groups was monitored by zeta potential determinations:49 the change in zeta potential from −29.1 ± 3.5 mV to −5.5 ± 2.0 mV was taken as an indication of the successful reaction (Fig. S3, ESI†). The modified CμPs were repeatedly washed and dialyzed to remove any unreacted reagents, to prevent flocculation of colloidal gold, and the washed particles were stored at pH 7. Positively charged, 4-dimethylaminopyridine (DMAP) stabilized AuNPs, AuNP(DMAP) with a zeta potential of +28.3 ± 1.2 mV were prepared using the Gittins method.50 The AuNP surface plasmon resonance (SPR) band was observed at 512 nm and the particle size was determined by TEM to be 5.2 ± 1.7 nm (Fig. S4, ESI†). Borohydride anion stabilized NPs, AuNP(BH) were prepared with minor modification to the synthesis outlined by Martin et al.51 to yield negatively charged AuNPs with zeta potential in the range of −20 ± 2 mV, a SPR band at 508 nm and a slightly smaller size of 4.6 ± 1.3 nm by TEM, (Fig. S5, ESI†). The AuNP(BH) were stored in glass in the dark and remained stable over several days.
Electrostatic interactions are extremely effective for the assembly of nanostructured composite materials,52,53 and have previously been used to assemble positively charged AuNP(DMAP) to the surface of negatively charged TiO2 nanotubes.54 The electrostatic-driven assembly of CμP-AuNP(DMAP) composite particles was achieved by incubating negatively charged o-CμP in the presence of an excess of AuNP(DMAP) under agitation at RT for 2 h. The addition of o-CμP to the AuNP(DMAP) resulted in an immediate loss of color in the colloid solution. The excess AuNPs were removed by centrifugation conditions (1400 rpm for 10 min) that cause preferential sedimentation of the CμP AuNPs in the presence of the AuNPs. Successive redispersion cycles were performed until the SPR absorption was no longer detected in the supernatant, see Scheme S2 (ESI†). SEM images showed the presence of composite particles with high levels of AuNP coverage evenly distributed on the surface and extremely low levels of free gold nanoparticles, Fig. 1b and Fig. S6 (ESI†). The UV-Vis difference spectrum obtained following subtraction of o-CμP from the CμP-AuNP(DMAP) composite spectrum showed broad plasmon absorption which was red shifted from the AuNP(DMAP) absorption at 512 nm to ca 570 nm, Fig. S7 (ESI†). The shifted spectrum is indicative of SPR coupling due to close lying interacting AuNPs.55,56 The gold loading was determined by aqua regia digestion of the AuNPs at the carbon particle surface (Fig. S8, ESI†) followed by solution analysis using atomic absorption spectroscopy, which yielded a value of 0.32 (mass Au/mass C), see ESI.†
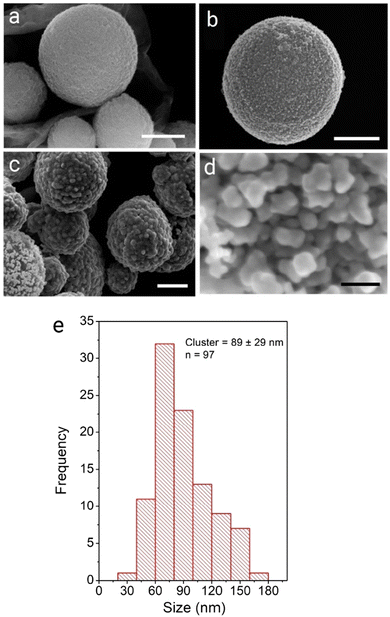
SERS activity is enhanced at roughened Au surfaces57 and in the presence of anisotropic nanoparticles.58 Therefore to increase the loading of Au at the surface and gain access to improved SERS activity, the further deposition of Au at the surface of the AuNPs was performed using hydroquinone as a weak reducing agent to selectively reduce aqueous Au(III) onto AuNP(DMAP) seeded CμPs. Treatment of CμP-AuNP(DMAP) with a 1% HAuCl4 and 0.03 M to 0.3 M hydroquinone for 1 h in aqueous solution in Au loading. SEM showed the presence of a disordered surface followed by repeated centrifugation and washing, resulted the formation of CμP-AuNP-1 composites with a significant increase topography comprising of irregularly shaped AuNPs at the CμP-AuNP-1 surface. The sample was found to have a good degree of coverage obtained which can be seen in Fig. 1c and d and Fig. S9c, d (ESI†). Analysis of the images provided a Feret diameter of 89 ± 29 nm, see Fig. 1e.59 Importantly, the SEM also revealed the absence of large free gold material in the sample, see Fig. S9 (ESI†).
Acid digestion conditions were optimized to ensure complete dissolution of the ripened gold surface, which was achieved by sonicating the samples for 1 h in a 25% aqua regia solution, see Fig. 2. Atomic absorption analysis of the digested particles revealed a 22-fold increase in the Au loading from 0.32 to 7.02 (mass Au/mass C). The high coverage achieved using this method is significantly greater than that reported for previous SERS probes.42,60 This high coverage is approaching the density obtained for close packed monolayers of gold nanoparticles, which have been shown to have high SERS activity.61
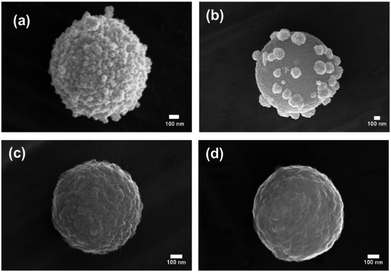 | ||
| Fig. 2 SEM micrographs of (a) CμP-AuNP-1 and following 1 h sonication in (b) 5%; (c) 12.5%; and (d) 25%; aqua regia. Scale bars show 100 nm. | ||
We next aimed to exploit the high affinity of the gold nanoparticle surface for NH2 and SH groups, which we have previously exploited to prepare polystyrene supported AuNP composite materials.5–7 To this end we examined the ability of the CA-CμP particles to mediate assembly of AuNP(BH) stabilized by a weakly bound surface borohydride anion.51 Using the method described above resulted in the successful formation of AuNPs composites (Fig. 3b and Fig. S10 (ESI†), which were found to have a lower loading of 0.17 (mass Au/mass C) compared to the DMAP system. This lower loading is attributed to (i) the different extent of surface functionalization achieved for the bioconjugate coupling compared to direct oxidation, (ii) the smaller size of the AuNP(BH) and (iii) the presence of residual surface –COO− groups which are expected to result in electrostatic repulsion.
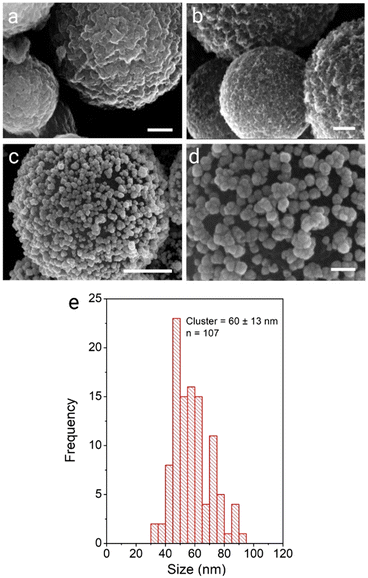
Applying the seed growth method resulted in the preparation of CμP-AuNP-2 particles. Interestingly, the reduced loading of the seed AuNPs resulted in the growth of discrete clusters of AuNP at the surface upon hydroquinone treatment, see Fig. 3c, d and Fig. S11 (ESI†). The CμP-AuNP-2 particles appeared more homogeneous than the CμP-AuNP-1 produced from the AuNP(DMAP) seeds, which was reflected in the Feret diameter of 60 ± 13 nm, see Fig. 3e. Analysis of the Au composition revealed a lower (9-fold) enhancement of gold loading from 0.17 to 1.58 (mass Au/mass C).
Single particle measurements of SERS activity
Optical trapping Raman microscopy allows the measurement of Raman spectra of individual composite particles in dilute particle solutions that would be challenging to obtain from bulk measurement.7,41 The use of optical tweezers also allows background signals to be reduced due to trapping of individual SERS active probes.43 Malachite green was chosen as a model probe due to its well characterized Raman activity and prevalence as a contaminant in fish stocks.46,62 Malachite green isothiocyanate has a strong visible absorption at 619 nm, which is far removed from the laser excitation and is therefore not expected to result in significant background fluorescence in the Raman spectrum (Fig. S12a, ESI†). The properties of the carbon composite materials in aqueous solution were previously investigated using a non-resonant 785 nm trapping and excitation laser.63 The Raman spectrum obtained for optically trapped o-CμP (B2) revealed two peaks at 1327 cm−1 and 1582 cm−1, corresponding to the D and G bands of carbon, see Fig. S13a (ESI†).64 Even though the high surface area of porous CμPs allow them to act as very effective sorbent materials, the Raman spectra recorded for an optically trapped o-CμP after incubation in a 10 μM MG was dominated by the carbon bands, while bands characteristic of MG were found to be absent from the spectrum (Fig. S13b, ESI†). Furthermore, the Raman spectra of individually trapped 5 nm DMAP-AuNP decorated carbon particles, CμP-AuNP(DMAP) were dominated by the D and G Raman bands of the o-CμP carbon support and showed little variability across different particles (Fig. S14a, ESI†). A similar spectrum was obtained for CμP-AuNP(DMAP) particles incubated with MG with no detectable MG signal observed (Fig. S14b and S15, ESI†). This absence of the SERS signal for the supported individual AuNPs is attributed to the expected weak activity of small (<10 nm) AuNPs.7,65Next the Raman spectra of optically trapped CμP-AuNP-1 particles prepared by HQN/HAuCl4 treatment of CμP-AuNP(DMAP) particles was examined. The high loading of gold at the surface (Au![[thin space (1/6-em)]](https://www.rsc.org/images/entities/char_2009.gif) :
:![[thin space (1/6-em)]](https://www.rsc.org/images/entities/char_2009.gif) C, 7
C, 7![[thin space (1/6-em)]](https://www.rsc.org/images/entities/char_2009.gif) :
:![[thin space (1/6-em)]](https://www.rsc.org/images/entities/char_2009.gif) 1), which is advantageous for SERS, results in a significant amount of reflection, refraction and scattering, which makes trapping of individual composites very difficult. To overcome this challenge the Raman of the individual composite was recorded by manipulating the particle so that it was pinned close to the cover slide, see Fig. 4. Once the laser was turned off the particle was observed to diffuse into bulk solution, which indicates that no physical attachment is made with the coverslip.
1), which is advantageous for SERS, results in a significant amount of reflection, refraction and scattering, which makes trapping of individual composites very difficult. To overcome this challenge the Raman of the individual composite was recorded by manipulating the particle so that it was pinned close to the cover slide, see Fig. 4. Once the laser was turned off the particle was observed to diffuse into bulk solution, which indicates that no physical attachment is made with the coverslip.
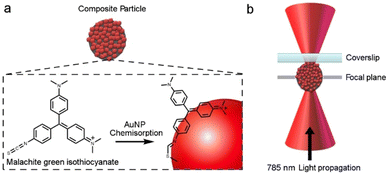 | ||
| Fig. 4 (a) Representation of MG adsorption at the AuNP surface. (b) Schematic of metal coated dielectric particle pinned close to a surface by a tightly focused laser beam. | ||
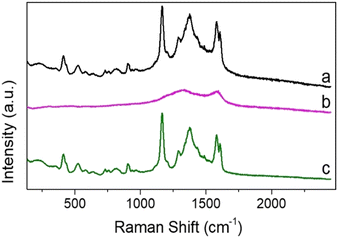
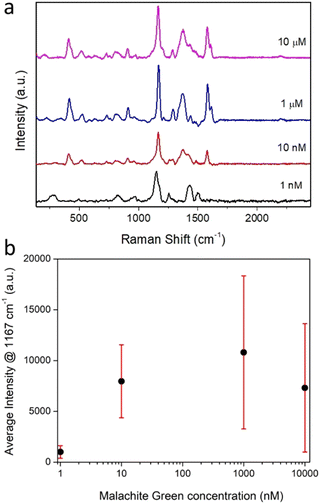
The Raman spectra recorded for individually trapped CμP-AuNP-1 particles again showed the characteristic Raman spectrum of the carbon support particle dominated by the D and G bands (Fig. S16b, ESI†). The Raman spectrum recorded for CμP-AuNP-1 incubated in MG were strikingly different with a highly structured spectra showing bands characteristic of MG (Fig. 5). The isolated MG spectrum was obtained by subtracting a reference spectrum compiled from the average of different CμP-AuNP-1 spectra. The bands at 1167 cm−1 and 1578 cm−1 corresponds to the in-plane C-H stretching and in plane ring stretching of MG, respectively. The intense band at 1167 cm−1 could be successfully corrected by the background subtraction procedure and was therefore well resolved from the contributions of the supporting carbon particle. This band was therefore used as the key marker for the presence of MG.
The Raman measurements obtained for nine different composites are shown in Fig. S17a and b (ESI†). Importantly, every particle measured displayed a SERS enhancement. Furthermore, SERS signals were detectable for composites incubated with MG solutions ranging from 10 μM down to 1 nM, (Fig. 6a and b). In solution, no Raman signal could be resolved for malachite green at concentrations used for SERS experiments (1 nM to 10 μM) and only a very weak Raman signal was observed for a solid film of MG, drop cast from ethanol onto a quartz coverslip (Fig. S12b, ESI†). Characteristic SERS spectra of MG was also detected for a solid sample of the CμP-AuNP-1 prepared by drop casting the incubated composite and recording a Raman spectrum with 514 nm laser excitation (Fig. S18, ESI†, note the relative peak intensities were different in bulk samples owing to the different laser excitation wavelength).
Finally, the SERS activity of the CμP-AuNP-2 particles was investigated. Firstly, the activity of the precursor CμP-AuNP(BH) was examined. Though the CμP-AuNP(BH) composite particles prior to HQN treatment showed a high density of gold nanoparticle coverage again no SERS was observed for individual optically trapped precursor particles. The Raman spectra recorded for the CμP-AuNP-2 particles obtained after HQN treated sample showed a uniform intensity of the D/G bands across trapped particles (Fig. S19a and b, ESI†), which is taken to reflect the improved homogeneity of the gold surface obtained for the composites prepared using Approach 2.
The Raman spectrum recorded for a trapped CμP-AuNP-2 after incubation with MG shows the MG bands to be clearly visible above the Raman contribution of the composite particle (Fig. S19c, ESI†). Subtraction of the composite contribution revealed a characteristic MG signal for all trapped particles. While some difference in the intensity of the SERS signal was observed for different particles, this is not unexpected and may reflect difference in the surface roughness or MG loading between particles (Fig. S19d, ESI†). The enhancement observed in these experiments is large, with the composite particles displaying greater intensity that of a solid film of MG. Though interestingly, despite the large difference in gold loadings (Au![[thin space (1/6-em)]](https://www.rsc.org/images/entities/char_2009.gif) :
:![[thin space (1/6-em)]](https://www.rsc.org/images/entities/char_2009.gif) C = 7.0 for CμP-AuNP-1 and 1.6 for CμP-AuNP-2) both sets of particles produced comparable average SERS intensity values; spectral resolution; and peak positions (Fig. S20, ESI†). The comparable activity observed for the CμP-AuNP-2 particles, which have a lower Au loading suggests a greater access to the discrete clusters present at the surface, see Fig. 2d. To obtain an estimate of the SERS enhancement factor we compare enhanced to unenhanced spectral signals. There was an absence of Raman signal for 785 nm excitation in water when either o-CμP, CμP-AuNP(DAMP) or CμP-AuNP(BH) were incubated with 10 mM MG whilst an average signal of ca. 10
C = 7.0 for CμP-AuNP-1 and 1.6 for CμP-AuNP-2) both sets of particles produced comparable average SERS intensity values; spectral resolution; and peak positions (Fig. S20, ESI†). The comparable activity observed for the CμP-AuNP-2 particles, which have a lower Au loading suggests a greater access to the discrete clusters present at the surface, see Fig. 2d. To obtain an estimate of the SERS enhancement factor we compare enhanced to unenhanced spectral signals. There was an absence of Raman signal for 785 nm excitation in water when either o-CμP, CμP-AuNP(DAMP) or CμP-AuNP(BH) were incubated with 10 mM MG whilst an average signal of ca. 10![[thin space (1/6-em)]](https://www.rsc.org/images/entities/char_2009.gif) 000 and 8000 counts was detected for CμP-AuNP-1 and CμP-AuNP-2 composite particles incubated with 10 μM MG (Fig. S20, ESI†). This comparison suggests an enhancement of the order of 107 albeit with a caveat that is does not account for possible slight differences in the quantity of MG adsorbed on the bare porous particles, AuNP decorated surfaces and the HQN treated surface.
000 and 8000 counts was detected for CμP-AuNP-1 and CμP-AuNP-2 composite particles incubated with 10 μM MG (Fig. S20, ESI†). This comparison suggests an enhancement of the order of 107 albeit with a caveat that is does not account for possible slight differences in the quantity of MG adsorbed on the bare porous particles, AuNP decorated surfaces and the HQN treated surface.
Conclusion
Composite particles prepared by the seeded growth methodology, using hydroquinone as the reducing agent resulted in significantly greater coverage of Au at the carbon particle surface than reported for previous SERS probes.42 The hydroquinone treatment was found to be essential to achieve SERS activity with no Raman signal detected for the carbon particles decorated with the individual AuNPs. A large SERS enhancement was observed for both CμP-AuNP-1 (Au![[thin space (1/6-em)]](https://www.rsc.org/images/entities/char_2009.gif) :
:![[thin space (1/6-em)]](https://www.rsc.org/images/entities/char_2009.gif) C = 7.0) and CμP-AuNP-2 (Au
C = 7.0) and CμP-AuNP-2 (Au![[thin space (1/6-em)]](https://www.rsc.org/images/entities/char_2009.gif) :
:![[thin space (1/6-em)]](https://www.rsc.org/images/entities/char_2009.gif) C = 1.6). The SERS intensity and spectral resolution was found to be comparable between both families of particles. The SERS intensity was found to vary from particle to particle, which may arise from the inhomogeneity of gold surface area between particles and future work will consider how this may be addressed. The comparable SERS activity observed for the CμP-AuNP-2, which had a lower loading of Au is notable and is attributed to the morphology of the surface decoration. Here the discrete clusters of a mean size (∼60 nm), which known to give rise to SERS activity,65 are expected to provide a greater surface area to the analyte than the more continuous coverage observed for the CμP-AuNP-2 system.
C = 1.6). The SERS intensity and spectral resolution was found to be comparable between both families of particles. The SERS intensity was found to vary from particle to particle, which may arise from the inhomogeneity of gold surface area between particles and future work will consider how this may be addressed. The comparable SERS activity observed for the CμP-AuNP-2, which had a lower loading of Au is notable and is attributed to the morphology of the surface decoration. Here the discrete clusters of a mean size (∼60 nm), which known to give rise to SERS activity,65 are expected to provide a greater surface area to the analyte than the more continuous coverage observed for the CμP-AuNP-2 system.
While this study has focused on the detection of MG the SERS particles are expected to be suitable for detection of other analytes that can be either chemisorbed or physisorbed at the gold surface. We are interested in the development of AuNP composites for biomedical applications in the area of radiosensitization and have demonstrated the internalization of such systems by cells using dark field microscopy.5,6 The versatility and robustness of the chemistry is expected to allow the preparation of these probe materials on a range of sizes. It will also be possible to explore the SERS activity of porous carbon particles that support nanoparticles of different shapes and sizes. This combined with the tolerance of AuNP to biological medium and their demonstrated SERS activity is intended to allow the development of SERS probes to report on biological environments66 with potential use for a number of applications such as radiosensitization, payload delivery and cellular imaging. The development of cellular SERS probes and plasmonics, including point of care applications, is of significant interest25,67–69 and further work will consider the SERS activity of individual composite particles as potential cellular probes.
Experimental
Materials
All chemicals and reagents were, unless otherwise specified purchased from Sigma-Aldrich and used without any further purification. SnakeSkin® Pleated Dialysis Tubing with a molecular weight cut off was of 3500 supplied by Thermo Scientific. Water was obtained from an ultra-pure Millipore 0.22 μm filtration system (18.2 mΩ cm resistivity).Synthesis of carbon and composite microspheres
![[thin space (1/6-em)]](https://www.rsc.org/images/entities/char_2009.gif) 000 × g for 2 h. 30 μL of gold nanoparticle decorated CμP particle solution (1 mg mL−1 by carbon) was added to 1 mL ddiH2O with. 30 μL 1% HAuCl4 solution followed by 30 μL of 0.03 M or 0.3 M hydroquinone (HQN). This was incubated for 1 h and modified AuNP decorated CμPs were isolated by repeated centrifugal washes (×5) at 1400 rpm for 10 min.
000 × g for 2 h. 30 μL of gold nanoparticle decorated CμP particle solution (1 mg mL−1 by carbon) was added to 1 mL ddiH2O with. 30 μL 1% HAuCl4 solution followed by 30 μL of 0.03 M or 0.3 M hydroquinone (HQN). This was incubated for 1 h and modified AuNP decorated CμPs were isolated by repeated centrifugal washes (×5) at 1400 rpm for 10 min.
Author contributions
Conceptualization, SJQ; methodology, PEC, ADW, SJQ; formal analysis, DTH, SAB; writing – original draft preparation, SJQ; writing – review & editing, PEC, ADW, SJQ; supervision, SJQ; funding acquisition, SJQ.Conflicts of interest
There are no conflicts to declare.Acknowledgements
This work was supported by the Irish Research Council (GOIP/2013/1110, SAB) and UCD (DTH). Access to the Central Laser Facility, STFC (CLF001926) was supported by funding from European Union's Seventh Framework Programme under grant agreement no. 284464 Laserlab-Europe. We are grateful to Prof. Kenneth Dawson and CBNI in UCD for access to DLS instrumentation. SEM and TEM imaging were carried out at the Advanced Microscopy Laboratory (AML) at the AMBER centre, CRANN institute (https://www.crann.tcd.ie/Facilities/Advanced-Microscopy-Laboratory.aspx), Trinity College Dublin, Ireland.Notes and references
- K. S. Lee and M. A. El-Sayed, J. Phys. Chem. B, 2006, 110, 19220–19225 CrossRef CAS PubMed.
- W. Hou and S. B. Cronin, Adv. Funct. Mater., 2013, 23, 1612–1619 CrossRef CAS.
- A. Cifuentes-Rius, H. de Puig, J. C. Kah, S. Borros and K. Hamad-Schifferli, ACS Nano, 2013, 7, 10066–10074 CrossRef CAS PubMed.
- K. T. Butterworth, S. J. McMahon, F. J. Currell and K. M. Prise, Nanoscale, 2012, 4, 4830–4838 RSC.
- S. A. Belhout, J. Y. Kim, D. T. Hinds, N. J. Owen, J. A. Coulter and S. J. Quinn, Chem. Commun., 2016, 52, 14388–14391 RSC.
- L. Bennie, S. A. Belhout, S. J. Quinn and J. A. Coulter, ACS Appl. Nano Mater., 2020, 3, 3157–3162 CrossRef CAS.
- S. A. Belhout, F. R. Baptista, S. J. Devereux, A. W. Parker, A. D. Ward and S. J. Quinn, Nanoscale, 2019, 11, 19884–19894 RSC.
- Y. Li, Y. Hu, S. Ye, Y. Wu, C. Yang and L. Wang, New J. Chem., 2016, 40, 10398–10405 RSC.
- Z. Lu, J. Goebl, J. Ge and Y. Yin, J. Mater. Chem., 2009, 19, 4597–4602 RSC.
- S. L. Westcott, S. J. Oldenburg, T. R. Lee and N. J. Halas, Chem. Phys. Lett., 1999, 300, 651–655 CrossRef CAS.
- R. Kumar, E. Gravel, A. Hagege, H. Li, D. V. Jawale, D. Verma, I. N. Namboothiri and E. Doris, Nanoscale, 2013, 5, 6491–6497 RSC.
- Y. Shi, H. Dai, Y. Sun, J. Hu, P. Ni and Z. Li, Analyst, 2013, 138, 7152–7156 RSC.
- G. Agrawal, M. P. Schürings, P. van Rijn and A. Pich, J. Mater. Chem. A, 2013, 1, 13244–13251 RSC.
- W. Jang, R. t Taylor, P. N. Eyimegwu, H. Byun and J. H. Kim, Chem. Phys. Chem., 2019, 20, 70–77 CrossRef CAS PubMed.
- J. Gu, S. Su, Y. Li, Q. He and J. Shi, Chem. Commun., 2011, 47, 2101–2103 RSC.
- P. Duffy, L. M. Magno, R. B. Yadav, S. K. Roberts, A. D. Ward, S. W. Botchway, P. E. Colavita and S. J. Quinn, J. Mater. Chem., 2012, 22, 432–439 RSC.
- H. S. Zhou, S. M. Zhu, I. Honma and K. Seki, Chem. Phys. Lett., 2004, 396, 252–255 CrossRef CAS.
- L. M. Magno, D. T. Hinds, P. Duffy, R. B. Yadav, A. D. Ward, S. W. Botchway, P. E. Colavita and S. J. Quinn, Front. Chem., 2020, 8, 576175 CrossRef CAS PubMed.
- S. E. Skrabalak and K. S. Suslick, J. Am. Chem. Soc., 2006, 128, 12642–12643 CrossRef CAS PubMed.
- K. M. Metz, S. E. Sanders, J. P. Pender, M. R. Dix, D. T. Hinds, S. J. Quinn, A. D. Ward, P. Duffy, R. J. Cullen and P. E. Colavita, ACS Sustainable Chem. Eng., 2015, 3, 1610–1617 CrossRef CAS.
- C. Dominguez, K. M. Metz, M. K. Hoque, M. P. Browne, L. Esteban-Tejeda, C. K. Livingston, S. Y. Lian, T. S. Perova and P. E. Colavita, ChemElectroChem, 2018, 5, 62–70 CrossRef CAS.
- M. Fleischmann, P. J. Hendra and A. J. McQuillan, Chem. Phys. Lett., 1974, 26, 163–166 CrossRef CAS.
- G. Kumari, J. Kandula and C. Narayana, J. Phys. Chem. C, 2015, 119, 20057–20064 CrossRef CAS.
- D. Radziuk and H. Moehwald, Phys. Chem. Chem. Phys., 2015, 17, 21072–21093 RSC.
- S. Laing, L. E. Jamieson, K. Faulds and D. Graham, Nat. Rev. Chem., 2017, 1, 0060 CrossRef CAS.
- R. Panneerselvam, G. K. Liu, Y. H. Wang, J. Y. Liu, S. Y. Ding, J. F. Li, D. Y. Wu and Z. Q. Tian, Chem. Commun., 2017, 54, 10–25 RSC.
- J. Langer, et al. , ACS Nano, 2020, 14, 28–117 CrossRef CAS PubMed.
- A. Campion, J. E. Ivanecky, III, C. M. Child and M. Foster, J. Am. Chem. Soc., 1995, 117, 11807–11808 CrossRef CAS.
- K. Kneipp, H. Kneipp and J. Kneipp, Acc. Chem. Res., 2006, 39, 443–450 CrossRef CAS PubMed.
- S.-Y. Ding, E.-M. You, Z.-Q. Tian and M. Moskovits, Chem. Soc. Rev., 2017, 46, 4042–4076 RSC.
- Y. S. Yamamoto and T. Itoh, J. Raman Spectrosc., 2016, 47, 78–88 CrossRef CAS.
- L. Guerrini, N. Pazos-Perez, E. Garcia-Rico and R. Alvarez-Puebla, Cancer Nanotechnol., 2017, 8, 5 CrossRef.
- H. K. Lee, Y. H. Lee, C. S. L. Koh, G. C. Phan-Quang, X. Han, C. L. Lay, H. Y. F. Sim, Y.-C. Kao, Q. An and X. Y. Ling, Chem. Soc. Rev., 2019, 48, 731–756 RSC.
- Y. Jia, L. Zhang, L. Song, L. Dai, X. Lu, Y. Huang, J. Zhang, Z. Guo and T. Chen, Langmuir, 2017, 33, 13376–13383 CrossRef CAS PubMed.
- A. B. Serrano-Montes, J. Langer, M. Henriksen-Lacey, D. Jimenez de Aberasturi, D. M. Solís, J. M. Taboada, F. Obelleiro, K. Sentosun, S. Bals, A. Bekdemir, F. Stellacci and L. M. Liz-Marzán, J. Phys. Chem. C, 2016, 120, 20860–20868 CrossRef CAS.
- L. Dai, L. Song, Y. Huang, L. Zhang, X. Lu, J. Zhang and T. Chen, Langmuir, 2017, 33, 5378–5384 CrossRef CAS PubMed.
- M. Zhang, M. Yang, C. Bussy, S. Iijima, K. Kostarelos and M. Yudasaka, Nanoscale, 2015, 7, 2834–2840 RSC.
- T. Sainsbury, T. Ikuno, D. Okawa, D. Pacilé, J. M. J. Fréchet and A. Zettl, J. Phys. Chem. C, 2007, 111, 12992–12999 CrossRef CAS.
- O. M. Marago, P. H. Jones, P. G. Gucciardi, G. Volpe and A. C. Ferrari, Nat. Nanotechnol., 2013, 8, 807–819 CrossRef CAS PubMed.
- D. V. Petrov, J. Opt. A: Pure Appl. Opt., 2007, 9, S139–S156 CrossRef CAS.
- D. P. Cherney and J. M. Harris, Annu. Rev. Anal. Chem., 2010, 3, 277–297 CrossRef CAS PubMed.
- Š. Bálint, M. P. Kreuzer, S. Rao, G. Badenes, P. Miškovský and D. Petrov, J. Phys. Chem. C, 2009, 113, 17724–17729 CrossRef.
- P. Strobbia, A. Mayer and B. M. Cullum, Appl. Spectrosc., 2017, 71, 279–287 CrossRef CAS PubMed.
- H. Tian, H. Li and Y. Fang, ACS Appl. Mater. Interfaces, 2019, 11, 16207–16213 CrossRef CAS PubMed.
- S. Lee, J. Choi, L. Chen, B. Park, J. B. Kyong, G. H. Seong, J. Choo, Y. Lee, K. H. Shin, E. K. Lee, S. W. Joo and K. H. Lee, Anal. Chim. Acta, 2007, 590, 139–144 CrossRef CAS PubMed.
- B. Hu, D.-W. Sun, H. Pu and Q. Wei, Talanta, 2020, 218, 121188 CrossRef CAS PubMed.
- S. E. Skrabalak and K. S. Suslick, J. Phys. Chem. C, 2007, 111, 17807–17811 CrossRef CAS.
- G. T. Hermanson, Bioconjug. Tech., Elsevier, 2008 Search PubMed.
- F. Thielbeer, K. Donaldson and M. Bradley, Bioconjugate Chem., 2011, 22, 144–150 CrossRef CAS PubMed.
- D. I. Gittins and F. Caruso, Angew. Chem., Int. Ed., 2001, 40, 3001–3004 CrossRef CAS PubMed.
- M. N. Martin, J. I. Basham, P. Chando and S. K. Eah, Langmuir, 2010, 26, 7410–7417 CrossRef CAS PubMed.
- J. P. Chapel and J. F. Berret, Curr. Opin. Colloid Interface Sci., 2012, 17, 97–105 CrossRef CAS.
- M. A. Kostiainen, P. Hiekkataipale, A. Laiho, V. Lemieux, J. Seitsonen, J. Ruokolainen and P. Ceci, Nat. Nanotechnol., 2013, 8, 52–56 CrossRef CAS PubMed.
- J. Yu, G. A. Rance and A. N. Khlobystov, J. Mater. Chem., 2009, 19, 8928–8935 RSC.
- E. Prodan, C. Radloff, N. J. Halas and P. Nordlander, Science, 2003, 302, 419–422 CrossRef CAS PubMed.
- P. K. Jain and M. A. El-Sayed, Chem. Phys. Lett., 2010, 487, 153–164 CrossRef CAS.
- J. Reguera, J. Langer, D. Jimenez de Aberasturi and L. M. Liz-Marzan, Chem. Soc. Rev., 2017, 46, 3866–3885 RSC.
- Z. Zhu, H. Meng, W. Liu, X. Liu, J. Gong, X. Qiu, L. Jiang, D. Wang and Z. Tang, Angew. Chem., Int. Ed., 2011, 50, 1593–1596 CrossRef CAS PubMed.
- E. Verleysen, T. Wagner, H. G. Lipinski, R. Kagi, R. Koeber, A. Boix-Sanfeliu, P. J. De Temmerman and J. Mast, Materials, 2019, 12, 2274 CrossRef PubMed.
- B. Mir-Simon, J. Morla-Folch, P. Gisbert-Quilis, N. Pazos-Perez, H.-N. Xie, N. G. Bastús, V. Puntes, R. A. Alvarez-Puebla and L. Guerrini, J. Optics., 2015, 17, 114012 CrossRef.
- A. B. Serrano-Montes, D. Jimenez de Aberasturi, J. Langer, J. J. Giner-Casares, L. Scarabelli, A. Herrero and L. M. Liz-Marzan, Langmuir, 2015, 31, 9205–9213 CrossRef CAS PubMed.
- X. Qian, S. R. Emory and S. Nie, J. Am. Chem. Soc., 2012, 134, 2000–2003 CrossRef CAS PubMed.
- S. J. Devereux, M. Massaro, A. Barker, D. T. Hinds, B. Hifni, J. C. Simpson and S. J. Quinn, J. Mater. Chem. B, 2019, 7, 3670–3678 RSC.
- A. C. Ferrari and J. Robertson, Phys. Rev. B: Condens. Matter Mater. Phys., 2000, 61, 14095–14107 CrossRef CAS.
- S. Hong and X. Li, J. Nanomater., 2013, 2013, 1–9 Search PubMed.
- L. Rodriguez-Lorenzo, Z. Krpetic, S. Barbosa, R. A. Alvarez-Puebla, L. M. Liz-Marzan, I. A. Prior and M. Brust, Integr. Biol., 2011, 3, 922–926 CrossRef CAS PubMed.
- M. Navas-Moreno, M. Mehrpouyan, T. Chernenko, D. Candas, M. Fan, J. J. Li, M. Yan and J. W. Chan, Sci. Rep., 2017, 7, 4471 CrossRef PubMed.
- F. Lussier, T. Brule, M. Vishwakarma, T. Das, J. P. Spatz and J. F. Masson, Nano Lett., 2016, 16, 3866–3871 CrossRef CAS PubMed.
- O. Tokel, F. Inci and U. Demirci, Chem. Rev., 2014, 114, 5728–5752 CrossRef CAS PubMed.
- S. D. Perrault and W. C. Chan, J. Am. Chem. Soc., 2009, 131, 17042–17043 CrossRef CAS PubMed.
Footnote |
| † Electronic supplementary information (ESI) available: The supporting information describes additional characterization including SEM and spectroscopic data. See DOI: https://doi.org/10.1039/d2ma00997h |
| This journal is © The Royal Society of Chemistry 2023 |

