 Open Access Article
Upgrading the reflux method as novel route for competitive catalysts in alkane selective oxidation†
Amada
Massó Ramírez
a,
Agustín
de Arriba
a,
Francisco
Ivars-Barceló
 b,
Adel
Ykrelef
cd,
Benjamín
Solsona
 *c and
José M.
López Nieto
 *a
*a
aInstituto de Tecnología Química, Universitat Politècnica de València-Consejo Superior de Investigaciones Científicas, Avenida de los Naranjos s/n, 46022 Valencia, Spain. E-mail: jmlopez@itq.upv.es
bDepartamento Química Inorgánica y Química Técnica, Facultad de Ciencias de la UNED, Paseo Senda del Rey no 9, 28040 Madrid, Spain
cDepartament d'Enginyeria Química, Universitat de València, Av. Universitat s/n, 46100 Burjassot, Valencia, Spain. E-mail: benjamin.solsona@uv.es
dHydrogen Energy Applications Laboratory, GP Department, University of Blida 1, Algeria
First published on 10th July 2023
Abstract
In the present article we show that, although the reflux method is not common for the synthesis of multicomponent MoVTeNbO catalysts, an optimized reflux synthesis of metallic precursors leads to efficient materials for the oxidative dehydrogenation of ethane and the selective oxidation of propane into acrylic acid, with the results at the same level as those of the best catalysts reported in the literature to date. It has been demonstrated that the reflux temperature is of paramount importance to achieve active and selective catalysts. Thus, the incorporation of vanadium and niobium to a polyoxometalate in the catalyst precursors is favored by refluxing at 110 °C, promoting the formation of the desired orthorhombic M1 phase. Additionally, the incorporation in the synthesis gel of cations such as ammonium or methylammonium provokes a further improvement of the catalytic performance whenever the activation procedure is carefully controlled.
1. Introduction
MoVTe(Sb)NbO mixed metal oxides, presenting the so-called M1 phase, are an interesting catalytic system in partial oxidation reactions since they can selectively transform propane into acrylonitrile1–4 (ammoxidation) or acrylic acid4,5 and n-butane to maleic anhydride6 and also facilitate the oxidative dehydrogenation (ODH) of ethane to ethylene.7,8 The different catalytic behavior depending on the alkane feed has been explained by both the different reactivity of C2–C4 olefins and the different stability of partial oxidation products.9–11The catalysts with the highest performance are characterized by the presence of a single phase, the distorted orthorhombic (Te2O)M20O56 (M = Mo, V, Nb) phase named as M1, although in many cases other crystalline phases, especially the pseudo orthorhombic (TeO)M3O9 (M = Mo, V, Nb), isomorphous with a hexagonal tungsten bronze (named as M2), and also Mo5O14 and TeMo5O14 phases can be present.
These types of catalysts have been extensively studied to evaluate the influence of synthesis conditions on their catalytic performance. To date, three different preparation procedures have been mainly proposed: i) co-precipitation, also called the “slurry” or “dry-up” method;1,3,4,12,13 ii) hydrothermal synthesis;14–17 and, iii) spray drying.2,18
In general, a wide range of parameters such as the presence of reductants,4,19 oxoacids,19 or polyoxometalates,20,21 pH of the synthesis gel,22 or the starting reactants,23,24 in addition to the catalyst activation method or post-synthesis treatment,25–27 show a strong influence on both the nature of the crystalline phases and their catalytic performance. However, in the last few years other catalyst preparation procedures have also been proposed. This is the case for instance of the use of a superheated water vapor treatment,28 an acrylamide-gelation approach,29 or even the use of organic additives in order to control the concentration of metals in aqueous suspension (favoring the formation of polyoxometalate clusters such as {Mo72V30} in solution, an intermediate in the formation of the M1-phase),30 in addition to a different hydrothermal method by using alkylammonium isopolymolybdates as precursors.31
The synthesis by reflux of an aqueous solution of starting precursors has also been reported as an alternative method for the preparation of multicomponent Mo–V–Te–Nb mixed metal oxides presenting an M1 phase structure.32,33 However, under the conditions proposed so far (especially the use of a V5+-starting compound such as ammonium metavanadate), a long synthesis time is required, and the catalysts show relatively low catalytic activity.
The reflux method could be an alternative to the classic changes in the catalyst preparation procedure. In this way, a modified method has been addressed in this work by understanding the influence of the reflux temperature, the starting precursor of the vanadium source (i.e., vanadyl sulphate) and the presence of additional ammonium cations in the synthesis gel on the physico-chemical properties of the precipitate Mo–V–Te–Nb mixed oxides obtained (catalyst precursors) in order to optimize the catalytic performance of the final activated catalysts for partial oxidation of propane and ethane.
2. Experimental
2.1. Catalyst preparation
The catalyst precursors were obtained by reflux, in a nitrogen atmosphere, from a mixture of aqueous solutions containing ammonium heptamolybdate (NH4)6Mo7O24·4H2O (Merck), vanadyl sulphate, VOSO4 (Aldrich), telluric acid, Te(OH)6 (Aldrich), and ammonium niobium oxalate, (NH4)2Nb2(C2O4)5 (CBMM), following a procedure described in detail in our previous work.33 In this case, different reflux temperatures (80, 100 and 110 °C) were used for the corresponding synthesis in order to study their effect on the final materials. The catalyst precursors will be named as P8-as, P10-as and P11-as, respectively. The Mo/V/Te/Nb molar ratio employed was 1.00/0.30/0.16/0.16 in all the synthesis (characteristics shown in Table 1). The respective solids obtained were filtered, washed with distilled water and dried in air for 12 hours at 100 °C. Finally, the dried solid precursors were heat-treated at 600 °C in a N2 stream, 15 mL min−1 (P8-N, P10-N and P11-N catalysts).| Catalyst | Synthesis temperature (°C) | EDX Mo/V/Te/Nb | XPS Mo/V/Te/Nb | V4+/V5+ ratioe (%) | S BET (m2 g−1) | H2-uptake (TPR) (mmolH2 m−2) |
|---|---|---|---|---|---|---|
| a All catalysts were heat-treated at 600 °C in N2, except sample P11C-aN, which was initially calcined at. 250 °C in air and then heat-treated at 600 °C in N2. b Prepared with ammonium hydroxide in the synthesis gel; NH4+/Mo molar ratio of 0.33. c Prepared with ammonium hydroxide in the synthesis gel; NH4+/Mo molar ratio of 0.66. d Prepared with methylammonium chloride in the synthesis gel; CH3NH4+/Mo molar ratio of 0.33. e Determined by XPS. | ||||||
| P8-N | 80 | 1/0.14/0.15/0.08 | 1/0.09/0.21/0.19 | 33.4/66.6 | 4.2 | 2.79 |
| P10-N | 100 | 1/0.14/0.15/0.08 | 1/0.11/0.20/0.22 | 50.5/49.5 | 5.5 | 2.23 |
| P11-N | 110 | 1/0.17/0.18/0.08 | 1/0.10/0.27/0.16 | 54.8/45.2 | 2.7 | 2.63 |
| P11A-N | 110b | 1/0.20/0.17/0.16 | 1/0.10/0.27/0.23 | 78.6/21.4 | 6.2 | 1.29 |
| P11B-N | 110c | 1/0.20/0.19/0.15 | n.d. | n.d. | 6.2 | 1.08 |
| P11C-N | 110d | 1/0.22/0.12/0.20 | 1/0.09/0.00/0.21 | 80.0/20.0 | n.d. | n.d. |
| P11C-aN | 110d | 1/0.22/0.13/0.20 | 1/0.09/0.20/0.16 | 80.9/19.1 | 9.8 | 0.73 |
In addition, other catalysts were prepared, considering a reflux temperature of 110 °C, but including ammonium hydroxide (NH4+/Mo molar ratio of 0.33 or 0.66) or methylammonium chloride (NH4+/Mo molar ratio of 0.33) in the synthesis gel. The corresponding catalyst precursors will be named as samples P11A-as, P-11B-as and P11C-as, respectively. In these cases, dried solid precursors were heat-treated at 600 °C in a N2 stream (P11A-N, P11B-N and P11C-N catalyst, respectively), or calcined in air at 250 °C and then heat-treated at 600 °C in a N2 stream (namely P11C-aN) for the sample synthesized in the presence of methylammonium chloride.
2.2. Characterization
Chemical analyses of the catalysts were carried out using an inductive coupled plasma-atomic emission spectrometer (ICP-AES).BET specific surface areas were determined by multipoint N2 adsorption (77 K) on a Micromeritics TriStar 3000 apparatus.
Powder X-ray diffraction (XRD) patterns were collected using a PANalytical CUBIX diffractometer, with a monochromatic Cu Kα1 source operating at 45 kV and 4 mA. The phase composition of the catalysts was analysed with X'Pert Highscore Plus software. The number of amorphous phases in the samples was determined by adding 20 wt% of V2O5 [JCPDS: 77-2418] as an internal standard.
Scanning electron micrographs (SEM) were collected on a JEOL JSM 6300 LINK ISIS instrument operating at 200 kV, which was equipped with a high-angle annular dark-field (HAADF) detector. Energy dispersive X-ray spectroscopy (EDS) analyses were also performed using a coupled X-Max 80 (Oxford Instruments) detector.
Raman spectra were collected with an inVia Renishaw spectrometer, equipped with a microscope (Olympus), employing 2.5 cm−1 spectral resolution, 50× microscope objective, and 20 s integration time with 50 scans per spectrum. The samples were excited by the 785 nm line of an Ar+ laser with 2.5 mW laser power.
Infrared spectra were recorded at room temperature in the 300–3900 cm−1 region with a Nicolet 205xB spectrophotometer equipped with a data station, at a spectral resolution of 1 cm−1 with an accumulation of 128 scans. The pellets were prepared with 20 mg of sample mixed with 100 mg of dry KBr and pressed into disks.
Temperature programmed reduction (H2-TPR) experiments were performed using a Micromeritics Autochem 2910 equipped with a TCD, in which the reducing gas was 10% H2 in Ar (using a total flow rate of 50 mL min−1). The samples were heated from 40 to 800 °C (heating rate of 10 °C min−1).
X-ray photoelectron spectroscopy (XPS) measurements were performed on a SPECS spectrometer equipped with a Phoibos 150 MCD-9 detector using a monochromatic Al Kα (1486.6 eV) X-ray source. Spectra were recorded using an analyzer pass energy of 50 eV, an X-ray power of 100 W, and an operating pressure of 10−9 mbar. Spectral treatment was performed using CASA software. In all cases, binding energies were referred to C 1s at 284.5 eV.
2.3. Catalytic tests
Catalytic experiments for partial oxidation of propane and ethane ODH were carried out at atmospheric pressure in a fixed bed quartz tubular reactor (i.d. 12 mm, length 400 mm) in the temperature range 350–450 °C. The catalysts (with a homogeneous particle size between 0.3 and 0.5 mm) were diluted with silicon carbide in order to maintain a constant volume in the catalytic bed. Several catalyst weights (from 0.20 to 3.0 g), and total flows (from 20 to 100 mL min−1) were used in order to achieve different contact times. The gas feed consisted of C3H8/O2/H2O/He or C2H6/O2/He with molar ratios of 4/8/30/58 or 5/5/90, respectively.Before the chromatographic analyses, the system was maintained for 30 min at the desired reaction temperature to reach the steady state. For each reaction temperature, two different analyses were conducted. The results presented correspond to the average of both analyses. In all the cases, at the same reaction temperature the catalytic results obtained hardly varied.
Reactants and products in both reactions were analyzed by online gas chromatography, using two packed columns:33 i) molecular sieve 5 Å (3 m) and ii) Porapack Q (3 m).
3. Results and discussion
3.1. Characterization of the catalyst precursors
The as-synthesized materials (before heat-treatments) were characterized by XRD (Fig. S1†) and IR (Fig. S2†). Regardless of some differences in relative intensities and peak widths, the XRD patterns of all samples are characterized by the presence of main peaks at 2θ = 8.2, 21.7, 22.5, 26.7, 28.0 and 28.6° (Fig. S1,† patterns a–c). The peak observed at low angle 2θ = 8.2° is found in some Keggin-type polyoxomolybdates with NH4+, H+ and/or K+ as counter cations.34–37 Indeed, the diffraction pattern most similar to those of our crystalline precipitates has been found for a recently reported Mo-based heteropolyoxometalate (HPM) in which pyramidal TeO32− heteroanions occupy the cavities of a capsule-like structure formed by two hemispheres of oxygen-coordinated Mo and V species, one of which is related to a lacunary Keggin structure.37 The diffraction pattern of this Keggin derivative HPM displays a 100% relative intensity for the 2θ peak at 8.2°, together with major peaks at 7.6, 16.5, 26.7, and 27.9°. Moreover, the major peaks at 21.7 and 22.5° for our reflux precipitates are also found for the cited Keggin derivative heteropolyoxometalate structure, although as minor diffractions in the latter case.37 Thus, the positions of the diffraction peaks in our crystalline solid suggests a similar structure to the cited Keggin derivative.37 However, the mismatch among some of the relative intensities does not allow unambiguous assignment. Anyway, it should be mentioned that a major peak around 22° is also found as characteristic in V-containing Mo-based oxides with a hexagonal or orthorhombic perovskite derivative structure.12,15,38 Those structures consist of corner-sharing octahedral layers, which depending on the specific octahedral arrangement, form pentagonal, hexagonal and even heptagonal channels.12,39 The distance of ca. 4 Å between consecutive atomic layers, linked via corner-sharing octahedra along the [001] direction in these perovskite-derivative structures, corresponds to the major diffraction centered at 2θ = 22°.12,15The IR spectra of the as-synthesized materials (Fig. S2†) show multiple absorption peaks overlapping between 470 and 1100 cm−1, together with bands centered at ca. 3150 and 1400 cm−1 associated with N–H vibration modes from NH4 species,40,41 as well as O–H vibration modes at ca. 3450 and 1610 cm−1 associated with water molecules.41
In the case of sample P11-C-as, several bands in the 1200–1560 range can be observed, which are related to NH3 rock and CH3 bend bands, confirming the presence of methyl-ammonium cations.42 Nevertheless, the infrared spectrum of the sample P8-as, i.e., the one with the highest crystallinity, is quite similar to that found for the V-containing Mo–Te Keggin derivative polyoxometalate which also presents XRD patterns (182758-ICSD) analogous to those found for the precursor at issue (Fig. S1,† pattern a).37
All above results are consistent with the initial formation, during the reflux synthesis, of a Te–Mo polyoxometalate in which the incorporation of V and Nb is favored by increasing the reflux temperature. (V + Nb)/Mo atomic ratios above ca. 0.1 for the reflux precipitate entail a loss of ordered structure or crystallinity. Consequently, the pristine crystalline structure undergoes transformation into an amorphous molybdate containing a similar amount of Te, V and Nb.
3.2. Characterization of the heat-treated catalysts
In general, the final activated catalysts feature low specific surface areas (within the range of 5–10 m2 g−1). This result was expected, according to previous surface areas reported for this kind of catalyst obtained from precursors synthesized without employing a hydrothermal method, but with a V4+ salt instead of a V5+ one.43 Despite the small variations among the surface areas of the catalysts prepared (Table 1), a general increase can be differentiated for those obtained employing ammonium hydroxide (>6 m2 g−1), compared with those prepared without it (<6 m2 g−1). Moreover, it must be mentioned that the catalyst showing the highest surface area (ca. 10 m2 g−1) is the one prepared with methylammonium chloride.The diffraction patterns of the catalysts heat-treated at 600 °C are shown in Fig. 1A and B. Interestingly, it can be observed that the presence of the so-called M1 phase, (Te2O)M20O56 (M = Mo, V, Nb) (JCPDS: 18-582), is favored by increasing the temperature in the reflux synthesis, as well as by adding an appropriate amount of ammonium ions in the synthesis gel.
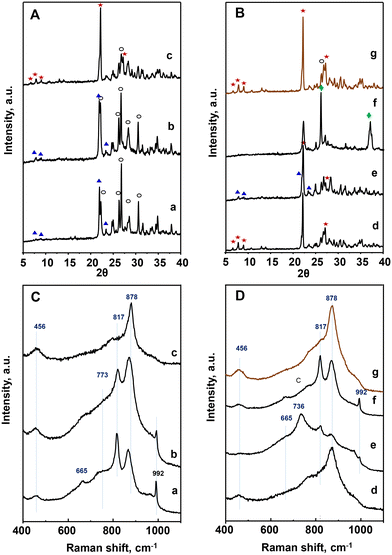 | ||
Fig. 1 XRD patterns (A and B) and Raman spectra (C and D) of heat-treated catalysts: a) P8-N; b) P10-N; c) P11-N; d) P11A-N; e) P11B-N; f) P11C-N; g) P11C-aN. Characteristics of the catalysts are shown in Table 1. Symbols: M1 phase ( ); TeMo5O16 (○); Mo5O14 ( ); TeMo5O16 (○); Mo5O14 ( ); MoO2 ( ); MoO2 ( ). ). | ||
It must be noticed that the sample prepared with methyl ammonium in the synthesis gel and heat-treated at 600 °C, P11C-N, presents a completely different XRD pattern than those observed for the rest of the catalysts (Fig. 1B). In fact, the XRD pattern of this sample is consistent with a mixture of M5O14, (M = Mo, V, Nb) and MoO2 phases. These structures are formed most likely due to a partial reduction of metal cations during the heat-treatment under an inert gas stream but in the presence of a hydrocarbon compound. In view of this result, the precursor (P-11-as) was also submitted to a different procedure: first calcination at 250 °C in air, followed by heat-treatment at 600 °C in N2. The resulting catalyst was named as P11C-aN (Fig. 1B, pattern g). The introduction of a previous activation step to remove the hydrocarbon content gave rise to a catalyst majorly containing the M1 phase (Fig. 1B, pattern g).
Quantitative phase analysis using the Rietveld method (Table S2†) shows that the amount of the so-called M1 phase, considered as the active phase for alkane activation, increases following the next trend for the catalysts prepared: P8-N < P10-N < P11B-N < P11C-aN < P11A-N. On the other hand, an opposite trend is observed for both TeM5O16 and M5O14 phases (M = Mo, V, Nb), which are present in the highest relative amount for the catalyst P8-N. Accordingly, these results suggest a certain influence of both the synthesis temperature and the presence of an appropriate amount of ammonium ions in the synthesis gel on obtaining catalysts with a high content (>65%) of M1 phase.
These results are confirmed by Raman spectra (Fig. 1C and D), which in the case of P8-N and P10-N catalysts present the main bands at 456, 665, 773, 817, 880 and 992 cm−1, related to TeM5O16 and M5O14 (M = Mo, V, Nb) structures (Fig. 1C, spectra a and b).44 However, the catalysts synthesized at 110 °C, display a main band at 872 cm−1 in addition to the low intensity bands at ca. 456 and 817 cm−1 (Fig. 1CD, spectrum c and , spectra d, e and g), characteristic of the M1 phase.45
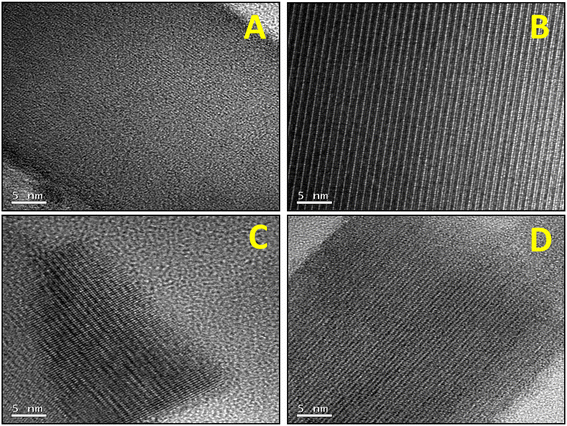
Samples were further investigated by field emission scanning electron microscopy (FESEM, Fig. 2) and high resolution transmission electron microscopy (HRTEM, Fig. 3). From the FESEM study, it could be observed that by increasing the temperature for the precursor reflux synthesis, a change in the shape of the crystals in the final catalyst occurs: from arguably large plaquettes in the case of P8-N (Fig. 2A) to a significant aggregation of cylinders in P11-N (Fig. 2B). Moreover, it can be also observed that the addition of organic compounds such as ammonia (P11A-N) or methylammonium chloride (P11C-aN) in the precursor reflux synthesis leads to a further decrease in the mean crystal size of the final catalysts (Fig. 2C and D). Additionally, the HRTEM images (Fig. 3) displayed indicate structural differences within the crystallites of the final catalysts depending on the synthesis parameters studied. Thus, single crystalline domains were mostly observed for the catalysts obtained from precursors synthesized at 110 °C, and more especially in the P11C-aN catalyst. By contrast, intergrowth domains were mostly found in the crystallites of the catalyst obtained from a precursor precipitated at 80 °C (i.e., P8-N).
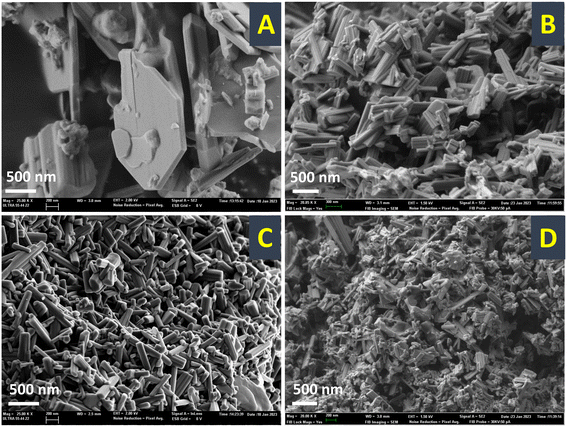 | ||
| Fig. 2 FESEM micrographs of selected heat-treated catalysts: A) P8-N; B) P11-N; C) P11A-N; D) P11C-aN. Note that the HRTEM micrographs of each catalyst are displayed within the figure. | ||
This tendency can be widely observed in the ESI,† where the FESEM and HRTEM micrographs (Fig. S3 and S4,† respectively) in different magnifications for the rest of the catalysts are shown.
Experiments of temperature programmed reduction (TPR) with hydrogen have been performed for activated catalysts, whose results can be comparatively observed in Table 1 and Fig. 4. The H2-uptake in the TPR spectra starts at ca. 420 °C for all the catalysts regardless of the preparation procedure. Nevertheless, differences exist among them either in the temperature for the maximum rate of reduction or the temperature at which the reduction is over. The most reducible behavior; i.e., the maximum at the lowest temperature; is observed for the catalyst P11-N, the one with the highest M1 phase content (the phase with the highest amount of Nb, seen in Table S1†). Although the P11-N catalyst also contains M5O14 and TeMO16 as minority phases, the TPR displays a single and nearly symmetric reduction peak with the maximum at ca. 500 °C. This reduction at 500 °C is also observed for P10-N and P8-N catalysts, but as a shoulder overlapped with additional peak maxima with higher intensity at 577 °C and 632 °C, respectively. Interestingly, the intensity of the common reduction at 500 °C gradually decreases concomitantly with the temperature of the reflux synthesis used to prepare the catalyst precursor (Fig. 4). Therefore, the lower the reflux temperature used to prepare the precursor, the lower the reducibility, and the higher the heterogeneity of reducible species in the final catalyst.
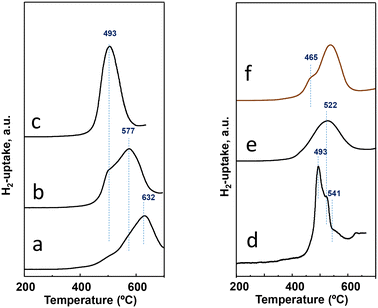 | ||
| Fig. 4 H2-uptake during the TPR-H2 experiments for activated catalysts: a) P8-N; b) P10-N; c) P11-N; d) P11A-N; e) P11B-N; f) P11C-aN. Characteristics of the catalysts are shown in Table 1. | ||
On the other hand, Table 1 shows comparatively the results of the chemical composition for the bulk (EDX) and near surface (XPS) of the final catalysts. In general, similar Te/Mo ratios are found in all cases, whereas some differences can be observed in the contents of both V and Nb, which seem to be higher in catalysts obtained from precursors synthesized at 110 °C. In addition, it can also be observed that the composition determined for the bulk is slightly different to that observed by XPS for the near surface composition.
From the analysis of components within the XPS region corresponding to the V2p3/2 core level of all the catalysts (Fig. 5), it was possible to conclude that the synthesis parameters for the precursor precipitation directly influence the V4+/V5+ ratio near the surface of the final catalyst. In this sense, an increase in the reflux temperature brings an enhancement in the relative amount of V4+ surface species of the final catalyst (Table 1). However, the combination of 110 °C in the reflux temperature and the additional concentration of ammonium cations (as ammonium hydroxide or methylammonium chloride) in the synthesis media clearly favours a partially reduced environment where V4+ species are especially predominant, as in sample P11C-aN (Fig. 5B). Interestingly, it has been previously reported that V4+ species are involved in the better catalytic performance of this type of catalyst for oxidative dehydrogenation of ethane (ODHE).44,45 Thus, samples with the highest relative amount of V4+ surface species are expected to be the ones exhibiting the highest selectivity to ethylene among the ones prepared in the present article. Nevertheless, the catalyst prepared with methylammonium chloride but activated only under an inert atmosphere (P11C-N, Fig. 5B), although exhibiting a higher proportion of V4+ species, does not present the M1 phase, suggesting that this catalyst would perform notably worse in ODHE. It must be mentioned that the XPS spectrum of the catalyst P8-N (Fig. 5A) is ca. 1 eV shifted to lower binding energies due to the experimental conditions used for this measurement (flood gun applied) getting ostensibly charged.
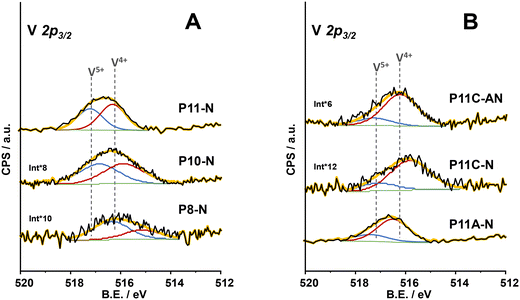 | ||
| Fig. 5 XPS results of V 2p3/2 core level of the catalysts: A) P8-N; P10-N and P11-N catalysts; B) P11A-N; P11C-N and P11C-aN catalysts. | ||
On the other hand, XPS spectra for the Mo3d, Te3d and Nb3d core levels have been included in the ESI† (Fig. S5). From the binding energy maxima in the respective spectra, Mo6+, Te4+ and Nb5+ appear as the main oxidation states for these metals present near the surface of the catalysts studied. Nonetheless, the case of the P11C-N sample (Fig. S5D†) is particularly interesting, where no intensity for the Te3d region could be detected. This fact suggests that the combination of methylammonium chloride and severe heat treatment under a N2 stream (600 °C) leads to an environment reductive enough to transform tellurium cations into metallic tellurium, collapsing the M1 structure this way.
3.3. Catalytic results in propane partial oxidation
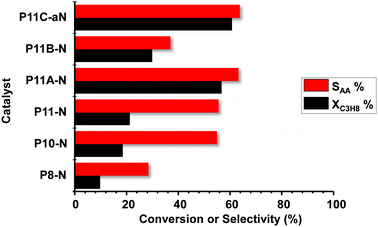
Fig. 6 shows comparatively the catalytic results obtained during the partial oxidation of propane, at 400 °C, over the MoVTeNbO catalysts developed employing the reflux method. A study of the catalyst stability was carried out for 48 h and showed no significant variation of the catalytic performance for the time assessed.Acrylic acid (AA), acetic acid, propene and carbon oxides (CO + CO2) were the main reaction products. The formation of reaction products follows a reaction network as presented in Scheme S1,† which is in agreement to previous results.9,14 In this way, and since acrylic acid is a secondary reaction product, the comparison of selectivity to acrylic acid must be carried out at a similar propane conversion level. Accordingly, additional catalytic results are also included in Table S2.†
According to our results, it can be concluded that the catalytic activity increases when increasing the reflux temperature, from 80 °C to 110 °C, to precipitate the precursor of the final catalyst. In addition, comparing the samples from the syntheses at 110 °C, it can be stated that the presence of ammonium cations in the synthesis gel also promotes the obtention of more active and selective catalysts, with P11C-aN presenting the best catalytic performance in terms of both catalytic activity and selectivity to acrylic acid.
The elevated yield to acrylic acid obtained using the optimal P11C-aN catalyst sample (44%) is remarkable, which is among the highest reported in the literature. It is also noteworthy that the space–time yield, STYAA, of 26.4 gAA kgcat−1 h−1 reached 410 °C.
3.4. Catalytic results in ethane ODH
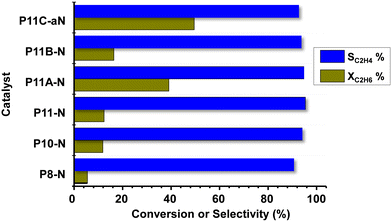
Fig. 7 shows comparatively the catalytic results obtained during the ethane ODH over MoVTeNbO catalysts at 400 °C. Ethene, CO and CO2 have been only observed. Oxygenated products other than carbon oxides (CO and CO2) were not identified. The formation of reaction products follows a reaction network, with carbon oxides formed mainly as a parallel reaction, as presented in Scheme S2,† which is in agreement to previous results.8,9It can be seen that for all catalysts the selectivity to ethylene is very high, with values exceeding 90%. Additional results are also included in Table S3.† The catalytic activity of the initial set of catalysts (synthesized at 80, 100 and 110 °C, i.e.P8-N, P10-N and P11-N, respectively) shows that an increase in the synthesis temperature also increases the ethane conversion, as reported above for propane conversion. Furthermore, the other catalysts synthesized at 110 °C and modified with ammonium hydroxide or methylammonium chloride present an even higher reactivity, especially catalysts P11A-N and P11C-aN.
Thus, in the case of the P11C-aN catalyst, and under the reaction conditions used here, we observed a space–time yield, STYC2H4, of 95 gC2H4 kgcat−1 h−1 at 410 °C.
4. Discussion
The results presented here indicate that MoVTeNb catalysts synthesized using a reflux method in an aqueous solution can be highly active and selective in the oxidative dehydrogenation of ethane to ethylene and also in the selective oxidation of propane into acrylic acid. Interestingly, to prepare optimal catalysts the synthesis conditions must be precisely controlled. Thus, reflux at temperatures of 80 °C leads to reasonably active and selective catalysts, however, by increasing the reflux temperature up to 110 °C the catalytic behavior highly improves, which can be further enhanced by adding appropriate modifiers. Noteworthily, by using this optimal reflux method, the catalytic results are among the most competitive catalysts reported to date for both reactions (ethane to ethylene and propane to acrylic acid).Moreover, an increase in the reflux temperature has led to an increase in the catalytic activity for both reactions in spite of the fact that the amount of surface sites decreases, since the surface area decreases (barely 2.7 m2 g−1 in the original catalyst synthesized at 110 °C). This means that the areal rate highly increases when refluxing at the highest temperature.
Then, decreasing the reflux temperatures to 100 °C or even less highly limits the formation of the active and selective orthorhombic M1 phase. Thus, for these catalysts, by using Rietveld refinement it was concluded that no more than 30% of the phases obtained are M1 (see Table S1†). In contrast, increasing the reflux temperature to 110 °C (sample P11-N) resulted in a notable promotion (66%) of the M1 phase content after the Rietveld analysis.
Then, 110 °C was used as the refluxing temperature for the other 3 samples where different activation conditions and additives were employed to further optimize the catalytic performance. This way, catalysts with ca. 75% of M1 were synthesized (P11A-N and P11C-aN). The higher or lower formation of the orthorhombic M1 phase is related to the presence of a Te–Mo polyoxometalate crystalline phase with a lacunary Keggin structure of the catalyst precursor (before the final thermal activation). It has been observed that in this structure the incorporation of V and Nb takes place to a larger extent when increasing the reflux temperature. Thus, the presence of polyoxometalates with a higher concentration of vanadium and niobium facilitates a further transformation of the precursor into the M1 phase, limiting its evolution to V- and Nb-free phases like Mo5O14 or TeMo5O16. Consequently, the highest reflux temperature leads to the main formation of the M1 phase.
The importance of the presence of this phase for the activation of the short chain alkanes is demonstrated in Fig. S6.† In this figure the reaction rate normalized per surface area has been plotted against the proportion of the M1 phase in the catalyst. Then, a clear relationship for both the ethane and the propane oxidation can be observed. These results suggest that the M1 phase is much more reactive than the other phases observed (the amorphous phase, in addition to crystalline Mo5O14 and TeMo5O16 phases). Moreover, as observed in Table S4,† the areal rate importantly varies depending on the catalyst. However, if the reaction rate is normalized both per surface area and per M1 loading, rather similar values are obtained for all catalysts for both reactions.
The importance of the M1 phase is even more paramount in the selective formation of the dehydrogenated and partial oxidation products. Fig. S7† shows that under isoconversion and isothermal conditions the selectivity to ethylene is the highest in the catalysts with a higher proportion of the M1 phase. The same trend is observed in the propane oxidation with the acrylic acid selectivity although, in this case, we do not have data under isoconversion and isothermal conditions to obtain a more accurate comparison.
The parallel behavior observed regarding the catalytic activity of the ethane and propane oxidation (Fig. S6†) is remarkable, suggesting that the active sites for the activation of both alkanes are similar if not the same ones. However, whereas the olefin is the main reaction product in the case of ethane, a partial oxidation product is mainly obtained from propane. The formation of different reaction products is related with the different reaction intermediates and the stability of the products involved (high stability for ethylene and acrylic acid and low for propylene). In IR experiments of adsorbed ethylene, a fast desorption of the olefin has been reported on MoVTeNb catalysts,45 confirming the low extent of the undesired surface catalyzed reaction between oxygen and ethylene. However, IR experiments of adsorbed propylene confirm the formation of allylic species, which are an intermediate towards acrylic acid formation.9 We want to remark that, as it happened with the reactivity, those catalysts with a higher ethylene formation (Fig. 7) are also those that produce more acrylic acid from propane (Fig. 6).
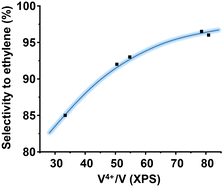
The oxidation state of V on the surface has been also shown as a paramount parameter for the catalytic performance.46 This is logical considering that vanadium is the activating element of the alkanes. Then, in ethane oxidation, the higher the amount of V4+ species, the higher the selectivity to ethylene. Fig. 8 shows a clear correlation between the proportion of surface V4+ species (determined by XPS) and the selectivity to ethylene. This trend shows that in addition to the presence of the M1 phase, the nature of the surrounding of the vanadium atoms must be considered.
Overall, the present study suggests that the nature of crystalline phases and the catalytic performance for C2–C3 partial oxidation depends on the synthesis conditions of the catalysts, which also favored changes in the oxidation states of the main elements, especially V atoms, as concluded from the XPS results.
We want to mention that stability tests were undertaken using the P11A-N catalyst at 380 °C for propane oxidation (conditions as in Table S2†) and at 386 °C for ethane oxidation (conditions as in Table S3†). Analyses for 5 h were undertaken and no appreciable differences neither in conversion nor selectivity were observed with the time on line.
5. Conclusions
In conclusion, the optimized reflux synthesis of metallic precursors leads to competitive MoVTeNbO catalysts for the oxidative dehydrogenation of ethane and the selective oxidation of propane into acrylic acid. These catalysts can be prepared by refluxing an aqueous solution of starting materials using vanadyl sulphate, nevertheless, it has been also shown in the present article that the reflux temperature plays an important role in both the preparation of the M1 phase and the catalytic performance. The incorporation of V and Nb to a polyoxometalate in the precursors is favored when working at high temperature (110 °C), promoting the formation of the orthorhombic M1 phase, which has been shown as the active and selective phase for both reactions studied. Thus, the sample prepared at a synthesis temperature of 110 °C and then heat-treated at 600 °C in N2 presented the best catalytic performance.In addition, the incorporation of cations (ammonium or methylammonium) in the synthesis gel also promotes the formation of more active and selective catalysts in the C2–C3 oxidation reactions. However, in these last cases, the activation procedure must be changed in order to optimize the characteristics of catalysts. Thus, the sample prepared in the presence of additional ammonium cations can be activated at 600 °C in N2, presenting relatively higher activity and selectivity in the C2–C3 partial oxidation. Conversely, in the case of the catalyst prepared with methylammonium cations in the synthesis gel, the activation of the catalyst needs a previous activation step in air (at 250 °C) before heat-treatment at 600 °C in N2, since an over reducing atmosphere provoked by the presence of the appropriate methylammonium cations turns into the non-formation of the M1 phase.
Author contributions
Dr. A. Massó Ramírez: material preparation and characterization, kinetic measurements and data analysis. A. de Arriba: material preparation, XPS experiments and data analysis. Dr. F. Ivars-Barceló: XRD characterization, data analysis and interpretation, and manuscript preparation. Dr. A. Ykrelef: material preparation and characterization, and data analysis. Dr. B. Solsona: electron microscopy, data analysis, and manuscript editing. Prof. J. M. López Nieto: concept paper of the study, data analysis and interpretation, and manuscript editing.Conflicts of interest
The authors declare that they have no known competing financial interests or personal relationships that could have appeared to influence the work reported in this paper.Acknowledgements
The authors gratefully acknowledge the financial support by the Ministerio de Ciencia e Innovación of Spain, MINECO/FEDER (Projects: PID2021-126235OB-C31, PID2021-126235OB-C33, TED2021-130756B-C32 and TED2021-129555B-I00). F. Ivars-Barceló gratefully acknowledges the support from “Ramón y Cajal” excellence program for recruitment (Ref.: RYC2020-029470-I/AEI/10.13039/501100011033).References
- T. Ushikubo, K. Oshima, A. Kayo, T. Umezawa, K. Kiyono and I. Sawaki, EP Pat., 0529853 A2, 1992, assigned to Mitsubishi Search PubMed.
- T. Ushikubo, K. Oshima, A. Kayou and M. Hatano, Ammoxidation of propane over Mo-V-Nb-Te mixed oxide catalysts, Stud. Surf. Sci. Catal., 1997, 112, 473–480 CrossRef CAS.
- H. Watanabe and Y. Koyasu, New synthesis route for Mo–V–Nb–Te mixed oxides catalyst for propane ammoxidation, Appl. Catal., A, 2000, 194/195, 479–485 CrossRef.
- H. Tsuji and Y. Koyasu, Synthesis of MoVNbTe(Sb)Ox Composite Oxide Catalysts via Reduction of Polyoxometalates in an Aqueous Medium, J. Am. Chem. Soc., 2002, 124, 5608–5609 CrossRef CAS PubMed.
- T. Ushikubo, H. Nakamura, Y. Koyasu and S. Wajiki, US Pat., 5380933, 1995, assigned to Mitsubishi Search PubMed.
- B. Solsona, F. Ivars, P. Concepción and J. M. López Nieto, Selective oxidation of n-butane over MoV-containing oxidic bronze catalysts, J. Catal., 2007, 250, 128–138 CrossRef CAS.
- J. M. López Nieto, P. Botella, M. I. Vázquez and A. Dejoz, US Pat., 7319179 B2, 2008, assigned to CSIC-UPV Search PubMed.
- P. Botella, E. Garcia-Gonzalez, A. Dejoz, J. M. Lopez Nieto, M. I. Vazquez and J. Gonzalez-Calbet, Selective oxidative dehydrogenation of ethane on MoVTeNbO mixed metal oxide catalysts, J. Catal., 2004, 225, 428–438 CrossRef CAS.
- J. M. Lopez Nieto, B. Solsona, P. Concepcion, F. Ivars, A. Dejoz and M. I. Vazquez, Reaction products and pathways in the selective oxidation of C2–C4 alkanes on MoVTeNb mixed oxide catalysts, Catal. Today, 2010, 157, 291–296 CrossRef CAS.
- T. T. Nguyen, B. Deniau, P. Delichere and J.-M. M. Millet, Influence of the Content and Distribution of Vanadium in the M1 Phase of the MoVTe(Sb)NbO Catalysts on their Catalytic Properties in Light Alkanes Oxidation, Top. Catal., 2014, 57, 1152–1162 CrossRef CAS.
- P. Kube, B. Frank, S. Wrabetz, J. Krçhnert, M. Hävecker, J. Velasco-Vélez, J. Noack, R. Schlögl and A. Trunschke, Functional Analysis of Catalysts for Lower Alkane Oxidation, ChemCatChem, 2017, 9, 573–585 CrossRef CAS.
- J. M. M. Millet, H. Roussel, A. Pigamo, J. L. Dubois and J. C. Jumas, Characterization of tellurium in MoVTeNbO catalysts for propane oxidation or ammoxidation, Appl. Catal., A, 2002, 232, 77–92 CrossRef CAS.
- J. M. Oliver, J. M. López Nieto, P. Botella and A. Mifsud, The effect of pH on structural and catalytic properties of MoVTeNbO catalysts, Appl. Catal., A, 2004, 257, 67–76 CrossRef CAS.
- P. Botella, J. M. López Nieto, B. Solsona, A. Mifsud and F. Marquez, The Preparation, Characterization, and Catalytic Behavior of MoVTeNbO Catalysts Prepared by Hydrothermal Synthesis, J. Catal., 2002, 209, 445–455 CrossRef CAS.
- D. Vitry, Y. Morikawa, J. L. Dubois and W. Ueda, Mo-V-Te-(Nb)-O mixed metal oxides prepared by hydrothermal synthesis for catalytic selective oxidations of propane and propene to acrylic acid, Appl. Catal., A, 2003, 251, 411–424 CrossRef CAS.
- A. Celaya Sanfiz, T. W. Hansen, F. Girgsdies, O. Timpe, E. Rödel, T. Ressler, A. Trunschke and R. Schlögl, Preparation of Phase-Pure M1 MoVTeNb Oxide Catalysts by Hydrothermal Synthesis—Influence of Reaction Parameters on Structure and Morphology, Top. Catal., 2008, 50, 19–32 CrossRef CAS.
- Q. He, J. Woo, A. Belianinov, V. V. Guliants and A. Y. Borisevich, Better Catalysts through Microscopy: Mesoscale M1/M2 Intergrowth in Molybdenum–Vanadium Based Complex Oxide Catalysts for Propane Ammoxidation, ACS Nano, 2015, 9, 3470–3478 CrossRef CAS PubMed.
- P. Beato, A. Blume, F. Girgsdies, R. E. Jentoft, R. Schlögl, O. Timpe, A. Trunschke, G. Weinberg, Q. Basher, F. A. Hamid, S. B. A. Hamid, E. Omar and L. Mohd Salim, Analysis of structural transformations during the synthesis of a MoVTeNb mixed oxide catalyst, Appl. Catal., A, 2006, 307, 137–147 CrossRef CAS.
- H. Tsuji, K. Oshima and Y. Koyasu, Synthesis of Molybdenum and Vanadium-Based Mixed Oxide Catalysts with Metastable Structure: Easy Access to the MoVNbTe(Sb)Ox Catalytically Active Structure Using Reductant and Oxoacid, Chem. Mater., 2003, 15, 2112–2114 CrossRef CAS.
- M. Sanchez Sanchez, F. Girgsdies, M. Jastak, P. Kube, R. Schlögl and A. Trunschke, Aiding the Self-Assembly of Supramolecular Polyoxometalates under Hydrothermal Conditions to Give Precursors of Complex Functional Oxides, Angew. Chem., Int. Ed., 2012, 51, 7194–7197 CrossRef CAS PubMed.
- R. Canioni, C. Marchal-Roch, N. Leclerc-Laronze, M. Haouas, F. Taulelle, J. Marrot, S. Paul, C. Lamonier, J.-F. Paul, S. Loridant, J.-M. M. Millet and E. Cadot, Selective conversion of {Mo132} Keplerate ion into 4-electron reduced crown-capped Keggin derivative [Te5Mo15O57]8−. A key intermediate to single-phase M1 multielement MoVTeO light-alkanes oxidation Catalyst, Chem. Commun., 2011, 47, 6413–6415 RSC.
- P. Botella, P. Concepcion, J. M. Lopez Nieto and Y. Moreno, The influence of Te-precursor in Mo-V-Te-O and Mo-V-Te-Nb-O catalysts on their catalytic behaviour in the selective propane oxidation, Catal. Today, 2005, 99, 51–57 CrossRef CAS.
- X. L. Tu, N. Furuta, Y. Sumida, M. Takahashi and H. Niiduma, A new approach to the preparation of MoVNbTe mixed oxide catalysts for the oxidation of propane to acrylic acid, Catal. Today, 2006, 117, 259–264 CrossRef CAS.
- Sh. Qian, Y. Chen, B. Yan and Y. Cheng, Plasma Treated M1 MoVNbTeOx-CeO2 Composite Catalyst for Improved Performance of Oxidative Dehydrogenation of Ethane, Green Energy Environ., 2023, 8(3), 904–914 CrossRef CAS.
- T. Nguyen, M. Aouine and J. M. M. Millet, Optimizing the efficiency of MoVTeNbO catalysts for ethane oxidative dehydrogenation to ethylene, Catal. Commun., 2012, 21, 22–26 CrossRef CAS.
- X. Tu, M. Niwa, A. Arano, Y. Kimata, E. Okazaki and S. Nomura, Controlled silylation of MoVTeNb mixed oxide catalyst for the selective oxidation of propane to acrylic acid, Appl. Catal., A, 2018, 549, 152–160 CrossRef CAS.
- B. Chu, H. An, X. Chen and Y. Cheng, Phase-pure M1 MoVNbTeOx catalysts with tunable particle size for oxidative dehydrogenation of ethane, Appl. Catal., A, 2016, 524, 56–65 CrossRef CAS.
- Y. V. Kolen'ko, W. Zhang, R. N. d'Alnoncourt, F. Girgsdies, T. W. Hansen, T. Wolfram, R. Schlögl and A. Trunschke, Synthesis of MoVTeNb Oxide Catalysts with Tunable Particle Dimensions, ChemCatChem, 2011, 3, 1597–1606 CrossRef.
- Y. V. Kolen'ko, K. Amakawa, R. N. d'Alnoncourt, F. Girgsdies, G. Weinberg, R. Schlögl and A. Trunschke, Unusual Phase Evolution in MoVTeNb Oxide Catalysts Prepared by a Novel Acrylamide-Gelation Route, ChemCatChem, 2012, 4, 495–503 CrossRef.
- D. Melzer, G. Mestl, K. Wanninger, Y. Zhu, N. D. Browning, M. Sanchez-Sanchez and J. A. Lercher, Design and synthesis of highly active MoVTeNb-oxides for ethane oxidative dehydrogenation, Nat. Commun., 2019, 10, 4012 CrossRef PubMed.
- S. Ishikawa, T. Murayama, Sh. Ohmura, M. Sadakane and W. Ueda, Synthesis of Novel Orthorhombic Mo and V Based Complex Oxides Coordinating Alkylammonium Cation in Its Heptagonal Channel and Their Application as a Catalyst, Chem. Mater., 2013, 25, 2211–2219 CrossRef CAS.
- I. Ramli, P. Botella, F. Ivars, W. P. Meng, S. M. M. Zawawi, H. A. Ahangar, S. Hernández and J. M. López Nieto, Reflux method as a novel route for the synthesis of MoVTeNbOx catalysts for selective oxidation of propane to acrylic acid, J. Mol. Catal. A: Chem., 2011, 342, 50–57 CrossRef.
- A. Massó-Ramírez, F. Ivars-Barceló and J. M. López Nieto, Optimizing Reflux Synthesis Method of Mo-V-Te-Nb mixed oxide Catalysts, for Light Alkane Selective Oxidation, Catal. Today, 2020, 356, 322–329 CrossRef.
- Z. Zhang, M. Sadakane, T. Murayama, N. Sakaguchi and W. Ueda, Preparation, Structural Characterization, and Ion-Exchange Properties of Two New Zeolite-like 3D Frameworks Constructed by ε-Keggin-Type Polyoxometalates with Binding Metal Ions, H11.4[ZnMo12O40Zn2]1.5− and H7.5[Mn0.2Mo12O40Mn2]2.1−, Inorg. Chem., 2014, 53, 7309–7318 CrossRef CAS PubMed.
- R. Allmann and H. D'amour, The structure of the Keggin complex [PW12O40]3− using the example of triclinic NaH2[PW12O40] xH2O (x = 12-14), Z. Kristallogr. – Cryst. Mater., 1975, 141, 161–173 CrossRef CAS.
- A. Leclaire, M. M. Borel, J. Chardon and B. Raveau, A mixed valent Keggin polyoxometallate involving molybdenum and tungsten, Mater. Res. Bull., 1995, 30, 1075–1080 CrossRef CAS.
- M. N. Corella-Ochoa, H. N. Miras, A. Kidd, D.-L. Long and L. Cronin, Assembly of a family of mixed metal {Mo:V} polyoxometalates templated by TeO32−: {Mo12V12Te3}, {Mo12V12Te2} and {Mo17V8Te}, Chem. Commun., 2011, 47, 8799–8801 RSC.
- E. García-González, J. M. López Nieto, P. Botella and J. M. González-Calbet, On the Nature and Structure of a New MoVTeO Crystalline Phase, Chem. Mater., 2002, 14, 4416–4421 CrossRef.
- W. Ueda, D. Vitry, T. Kato, N. Watanabe and Y. Endo, Key aspects of crystalline Mo-V-O-based catalysts active in the selective oxidation of propane, Res. Chem. Intermed., 2006, 32, 217–233 CrossRef CAS.
- B. W. L. Southward, J. S. Vaughan and C. T. O'Connor, Infrared and Thermal Analysis Studies of Heteropoly Acids, J. Catal., 1995, 153, 293–303 CrossRef CAS.
- D. Chen, M. Liu, L. Yin, T. Li, Z. Yang, X. Li, B. Fan, H. Wang, R. Zhang, Z. Li, H. Xu, H. Lu, D. Yang, J. Sun and L. Gao, Single-crystalline MoO3 nanoplates: topochemical synthesis and enhanced ethanol-sensing performance, J. Mater. Chem., 2011, 21, 9332–9342 RSC.
- A. J. Harding, K. D. Dobson, B. A. Ogunnaike and W. N. Shafarman, Thermal and Structural Characterization of Methylammonium- and Formamidinium-Halide Salts, Phys. Status Solidi A, 2021, 218, 2100246 CrossRef CAS.
- F. Ivars, B. Solsona, S. Hernández and J. M. López Nieto, Influence of gel composition in the synthesis of MoVTeNb catalysts over their catalytic performance in partial propane and propylene oxidation, Catal. Today, 2010, 149, 260–266 CrossRef CAS.
- B. Solsona, M. I. Vázquez, F. Ivars, A. Dejoz, P. Concepción and J. M. López Nieto, Selective oxidation of propane and ethane on diluted Mo–V–Nb–Te mixed-oxide catalysts, J. Catal., 2007, 252, 271–280 CrossRef CAS.
- A. de Arriba, B. Solsona, A. M. Dejoz, P. Concepción, N. Homs, P. Ramírez de la Piscina and J. M. López Nieto, Evolution of the optimal catalytic systems for the oxidative dehydrogenation of ethane: The role of adsorption in the catalytic performance, J. Catal., 2022, 408, 388–400 CrossRef CAS.
- A. De Arriba, B. Solsona, E. García-González, P. Concepción and J. M. López Nieto, Te-doped MoV-Oxide (M1 phase) for ethane ODH. The role of tellurium on morphology, thermal stability and catalytic behaviour, Appl. Catal., A, 2022, 643, 118780 CrossRef CAS.
Footnote |
| † Electronic supplementary information (ESI) available. See DOI: https://doi.org/10.1039/d3cy00372h |
| This journal is © The Royal Society of Chemistry 2023 |

