How do density functionals affect the Hirshfeld atom refinement?†
Bruno
Landeros-Rivera
 *a,
David
Ramírez-Palma
b,
Fernando
Cortés-Guzmán
 c,
Paulina M.
Dominiak
 d and
Julia
Contreras-García
 *a
*a
aCNRS, UMR 7616, Laboratoire de Chimie Théorique, Paris, France. E-mail: brunolanderos@hotmail.com
bDepartamento de Química, Centro de Investigación y de Estudios Avanzados del IPN (CINVESTAV), Avenida IPN 2508, Col. San Pedro Zacatenco, Ciudad de México, 07360, Mexico
cUniversidad Nacional Autónoma de México, Instituto de Química, Ciudad Universitaria, Ciudad de México, 04510, Mexico
dBiological and Chemical Research Centre, Department of Chemistry, University of Warsaw, Poland
First published on 22nd December 2022
Abstract
In this work, the effect of mixing different amounts of Hartree–Fock (HF) exchange with hybrid density functionals applied to the Hirshfeld atom refinement (HAR) of urea and oxalic acid dihydrate is explored. Together, the influence of using different basis sets, methods (including MP2 and HF) and cluster sizes (to model bulk effects) is studied. The results show that changing the amount of HF exchange, no matter the level of theory, has an impact almost exclusively on the H atom refinement parameters. Contrary to pure quantum mechanical calculations where good geometries are obtained with intermediate HF exchange mixtures, in the HAR the best match with neutron diffraction reference values is not necessarily found for these admixtures. While the non-hydrogen covalent bond lengths are insensitive to the combination of method or basis set employed, the X–H bond lengths always increase proportionally to the HF exchange for the analysed systems. This outcome is opposite to what is normally observed from geometry optimisations, i.e., shorter bonds are obtained with greater HF exchange. Additionally, the thermal ellipsoids tend to shrink with larger HF exchange, especially for the H atoms involved in strong hydrogen bonding. Thus, it may be the case that the development of density functionals or basis sets suitable for quantum crystallography should take a different path than those fitted for quantum chemistry calculations.
1 Introduction
Because of the recent advances in quantum crystallography, this area of science has gained more popularity among scientists in both the theoretical and experimental fields of chemistry and biology.1–6 In particular, the implementation of the Hirshfeld atom refinement (HAR)7 in Olex2,8 where non-spherical atomic form factors are computed from ab initio molecular calculations,9 has potentially made this technique a routine tool that could be run in a computer desktop.10 As this implementation has raised the possibility to read molecular orbitals calculated with different codes or quantum mechanical methods, the next question arises for a crystallographer: which is the appropriate level of theory needed for my refinement?A key to answering this question lies in the relationship between crystallography and quantum mechanics, which is given by electron density, ρ(r). In an X-ray diffraction experiment, the measured quantities are the reflection intensities, which are proportional to the square of the structure factors (SFs). The SFs are related to ρ(r) by a Fourier transform, in which the convolution approximation is employed to separate its static and dynamic components. Thus, atomic positions and thermal parameters are refined by minimising the difference between the experimental and the calculated SFs, the latter being obtained from a chosen model. For a long time, the independent atom model (IAM) has been the most used for obtaining the calculated SF. While it works fine for refining the atomic positions and anisotropic displacement parameters (ADPs) of non-hydrogen atoms, it fails for providing an accurate description of H atoms. Besides, no property other than the geometry could be derived from the IAM. The Hansen-Coppens multipole model (MM)11 represented an advantage over the IAM since non-spherical SFs can be obtained by introducing extra refinement parameters, the deformation functions, which account for the deviation of sphericity caused by all sorts of atomic interactions in the crystalline environment. By doing this, a more realistic model of ρ(r) is obtained, from which some properties can be analyzed.12 Despite this advance in modeling the static electron density properties, the MM is still not able to refine accurately H atoms.13 An alternative is the use of the transferable aspherical atomic model14 (TAAM) which, in contrast to the MM, used prefixed aspherical parameters obtained from optimized databanks, making it almost as fast as the IAM. Moreover, the TAAM is able to refine H atoms anisotropically, which makes it suitable for the accurate refinement of large H-containing structures where ab inito-based refinements are too demanding (vide infra). Notwithstanding this, the use of the TAAM is limited by the atom-types contained in the databanks and, therefore, it is not universally applicable. Hence, other refinement methods like the HAR can circumvent this problem.
In the HAR, the static components of the calculated SFs are derived from the application of a Hirshfeld stockholder partition to the ρ(r) computed from a selected ab initio method, while the usual atomic displacement parameters are used for describing thermal motion. The adequacy of this partition has been discussed elsewhere,15 where it was observed that the electron density model influenced more in the crystallographic residuals than using different partitioning methods. In contrast to the IAM and the MM, the HAR is the only databank-free refinement method available which is able to refine anisotropically H atoms without resorting to any other type of experimental or theoretical information, including metal–hydrogen bonds as long as the diffraction data are of good quality.7,16,17 Also, the data quality required for a proper refinement with the HAR is less demanding than that needed for the TAAM.14
It is expected that the better the ab initio model from which ρ(r) is derived, the better the agreement with the experimental SF will be. Although it can be anticipated that post-Hartree–Fock methods should provide a ρ(r) closer to the “real one”, it was concluded from a recent investigation that their employment in HAR does not necessarily imply a clear advantage over DFT-derived electron densities.18 Furthermore, their highly demanding computational cost makes them unfeasible for supramolecular systems, where large clusters are needed for a proper description of intermolecular interactions In this sense, the use of periodical calculations is expected to provide better models.19 Thus, at the moment, DFT seems to be the most practical choice due to its balance between accuracy and cost.
This means that the problem of choosing a suitable density functional,20–22 common in quantum chemical simulations, has now been imported to crystallography. Naturally, the best choice should be that which provides a better ρ(r). An analysis of an extended list of density functionals showed that fitting them mainly with the goal of reproducing better energies does not necessarily improve the corresponding (theoretical) electron densities.23 In this study, Medvedev et al. compared some properties of ρ(r) of a group of selected isolated atoms, computed with the different density functionals, with a coupled-cluster single and double calculation. They showed that hybrid GGA functionals provide ρ(r) closer to the reference one, which is reasonable because it is known that a mixture of a certain amount of the exact Hartree–Fock (HF) exchange can compensate for some of the failures of the pure exchange functionals, such as the delocalization error.24 However, it is not evident that this conclusion will be sustained for the prediction of the best theoretical SF or refinement parameters. Therefore, quantum crystallography opens the possibility of developing density functionals focused on providing a better ρ(r).
With this in mind, we propose that the first step is to investigate what is the effect of mixing different amounts of HF exchange in the application of DFT to the HAR. It is expected that along with improving ρ(r), better refined geometries will also be obtained. This is relevant for the application of other techniques like the X-ray constrained wavefunction fitting (XCW), where the geometry obtained from the HAR remains fixed, and ρ(r) is fitted to minimise the difference between the experimental and the theoretical SFs.25 For example, in the case of ammonia crystals,7 a better agreement between theoretical and experimental SFs was found by applying HAR than by performing an XCW fitting26 using as the input the refinement parameters derived from a multipole refinement.27 Furthermore, if the geometry obtained from the HAR is significantly far from the “real one”, then the XCW fitting will try to match two electron densities that correspond to two different external potentials, which will imply a violation of the first Hohenberg–Kohn theorem.28 Thus, we have analysed the effect of modifying the amount of HF exchange of different hybrid density functionals, along with using different basis sets and cluster sizes (to model bulk effects) in the application of the HAR to two simple hydrogen bonded systems: urea and dihydrated oxalic acid. We pay special attention to the PBE exchange–correlation functional since its well known hybrid, PBE0,29 is based on physical constraints and it is known to show good performance in the prediction of molecular properties.30
2 Methodology
2.1 Refinements
Reflection data of urea and dihydrated oxalic acid were taken from ref. 31 and 32, respectively (out of the 14 data collection, the oxa8 was taken as it shows lower systematic errors). Full data without F2/σ(F2) or resolution cutoffs were employed for the Hirshfeld atom refinements, taking the parameters obtained from a previous spherical refinement as the input. The full resolution of urea and oxalic acid is 1.45 and 1.20 Å−1, respectively. The refinements were performed using F2 (the squared structure factors). The estimation of the weights given to each reflection in the least-squares procedure (weighting scheme) was performed with the equation: w = [σ(F2) + (aP)2 + bP]−1, where P = (2/3)Fcalc2 + (1/3)Max(Fobs2, 0), and a and b are adjustable parameters employed to achieve a normal distribution of residuals. All atoms, including hydrogens, were refined anisotropically, without any constraint (nor restraint).The PBE exchange–correlation functional, with different amounts of Hartree–Fock exchange going from 0 to 100%, was employed using the following formula:
| Exc = aEHFx + (1 − a)EPBEx + EPBEc | (1) |
2.2 Systems
Urea phase I crystallises in the P421 m space group, and the asymmetric unit consists of only half a molecule. Each molecule forms 8 hydrogen bonds with its neighbours, from which only two are not equivalent by symmetry. These are N–H⋯O hydrogen bonds, one of which seems stronger than the other. According to neutron diffraction experiments measured at 123 K,35 they have intermolecular distances of 2.009(2) Å with H1 and 2.067(2) Å with H2 (see Fig. 1). For the refinement, a cluster of 10 molecules that are within a 3.8 Å radius around the central molecule was used (Fig. 1). For the MP2 case, the cluster consisted of 8 molecules closer to the atoms of the asymmetric unit.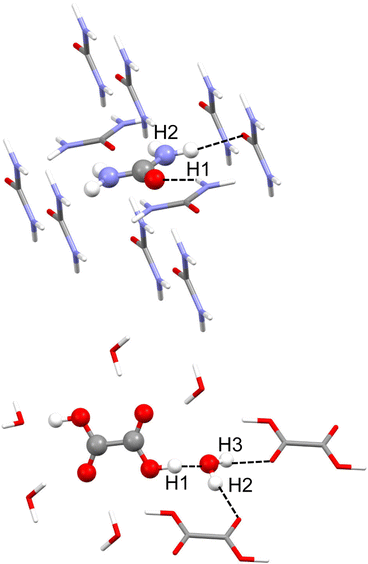 | ||
| Fig. 1 Cluster models used in the HAR for urea (top) and oxalic acid (bottom). Hydrogen atom labels of the asymmetric unit are shown. Unique hydrogen bonds are shown as black dotted lines. | ||
Dihydrated oxalic acid crystallises in the P21/c space group, and the asymmetric unit consists of one half oxalic acid and one water molecule. The hydrogen atom (H1) of the carboxylic group is forming a very strong hydrogen bond with the oxygen of the water molecule. At the same time, both hydrogen atoms of the water molecule (H2 and H3) are forming strong hydrogen bonds with the carbonyl groups of the other two different oxalic acid molecules. The average intermolecular hydrogen bond distances involving H1, H2 and H3 obtained from 14 neutron diffraction experiments32 are 1.409(2), 1.880(2) and 1.921(2) Å, respectively. Thus, these are shorter and presumably stronger hydrogen bonds than those involved in urea. For the refinement, a cluster was used consisting of one central oxalic acid molecule forming hydrogen bonds with the closest 6 water molecules. The two oxalic acid molecules forming a hydrogen bond with the water molecule in the asymmetric unit have also been included (Fig. 1).
3 Results
3.1 Hydrogen bond strength
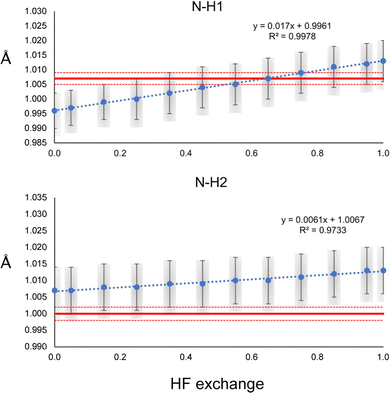
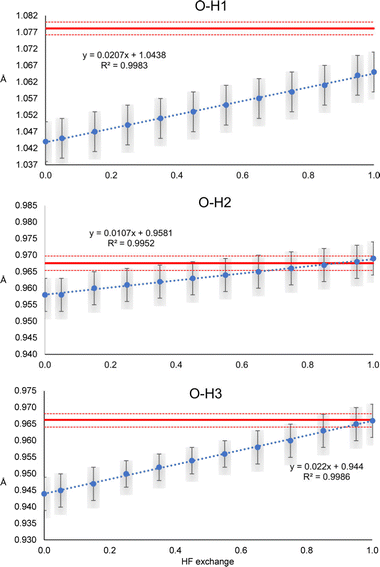
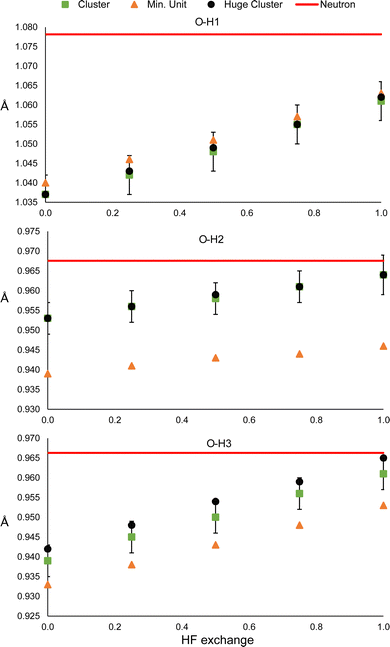
The N–H1 and N–H2 distances obtained with the HAR for urea and the PBEx functional are shown in Fig. 2. As a reference, the neutron diffraction value is shown in red. Although the synchrotron and neutron diffraction experiments were performed at 123 K, systematic errors are expected in both experiments, and thus, they will never reach exactly the same refined parameters. Nevertheless, the neutron diffraction distances are good references for indicating if the trends observed for the density functionals are in a good direction. As can be seen, high HF exchange is necessary for the HAR to match the neutron diffraction distance for the N–H1 bond, although at PBE25, the std errors of both refinements already overlap. In contrast, all values are overestimated with respect to the neutron diffraction value for N–H2. Only below PBE05, the std errors overlap. In both cases, the distance increases linearly with the percentage of HF exchange. Although, the increase seems to be faster for H1, which is involved in the stronger hydrogen bond (the rate of change is 2.8 times larger). For PBE100, both distances reach the same values. An important result is that the other covalent bonds (C–O and C–N) remain virtually unchanged with the increase of HF exact exchange. Thus, this effect affects exclusively H atoms involved in hydrogen bonding.A similar trend is observed for the O–H distances of oxalic acid (Fig. 3). They tend to increase as the percentage of HF exchange increases too, and the rate of change is larger for the O–H1, which is the strongest one. Note that for this bond, not even with PBE100 of HF exchange, the reached value is close to the reference, nor the std errors ever overlap. This is the extreme opposite of what was observed in N–H2 of urea. Alike urea, the increase of HF exchange does not change substantially the C–O and C–C bonds. Thus, it could be the case that the cancellation of errors between pure GGAs and the use of Hartree–Fock exchange, very commonly observed in molecular and solid-state quantum chemical calculations, is not preserved for the refinement of atomic positions in the HAR.
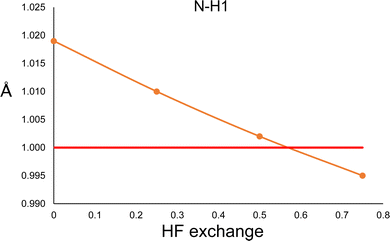
In order to explore this situation, we performed a constrained geometry optimisation of the urea crystal with DFT periodical conditions. The cell parameters and atomic positions of non-hydrogen atoms were kept fixed to those of neutron diffraction values, and only the hydrogen atoms were allowed to relax. The calculations were performed with Crystal17,36 with the POB-TZVP basis set, and the PBE functional with different amounts of HF exchange. The results are shown in Fig. 4. According to the calculation, both N–H distances are essentially the same (only N–H1 is shown in Fig. 4). As can be seen, the trend is the opposite of the one observed in the HAR. More HF exchange causes the N–H bond to be compressed, as expected. Thus, this result clearly suggests that different behaviours will be expected for hybrid functionals in quantum chemical calculations and HAR refined distances.
Regarding the anisotropic parameters of H atoms (Fig. S1–S5, ESI†), as a general trend, the thermal ellipsoids decrease their size with higher HF exchange (U11, U22 and U33 decrease). Small variations are observed for H1 and H2 of urea. However, these are relatively large for oxalic acid, in particular H1 where U11, U33 and U13 show a decrease of about 0.012 Å2 when going from 0 to 100% of HF exchange. Besides, smaller decreases are seen for the ADPs of the water H atoms, except for U33 of H3, which shows a relatively large increase. A possible explanation of why U11, U22 and U33 tend to decrease with HF exchange is given in the Discussion section. Moreover, the parameters that are more sensible to HF exchange are also the ones that deviate further from the neutron diffraction reference values. There is no general trend between HF exchange mixture and better neutron diffraction values.
It is important to state that the precision obtained from the refinement of the ADPs of the non-hydrogen atoms is two orders of magnitude lower than that of the H atoms. Accordingly, the effect of HF exchange in non-hydrogen atom ADPs is also observable as being two orders of magnitude lower than in the H atoms (Fig. S6–S12, ESI†). In general, there is a better agreement between the refined ADPs and the neutron diffraction values for non-hydrogen atoms. Therefore, the effect of HF exchange in non-hydrogen atoms is imperceptible in comparison with H atoms. Because of this, in the rest of this work, we focused only on analyzing H refinement parameters.
Interestingly, both systems show a minima of R1 as a function of HF exchange close to 25%, which corresponds to PBE0 (Fig. S13, ESI†). This is a weightless residual which measures the agreement between the calculated and the observed SFs (the smaller the value, the better the agreement). For values larger than 50%, R1 is higher than for the pure PBE functional. This means that, regardless of the constant increase of the N–H or O–H bond distances with HF exchange, the electron density model seems to fit better at percentages close to that of PBE0. Nevertheless, in all cases, R1 is lower than that obtained with the IAM. In the case of GooF (Fig. S14, ESI†), it shows a constant decrease with HF exchange in the case of urea, going approximately from 0.7 to 0.5. On the other hand, smaller variations with a U shape (with a minimum of close to 25%) are observed for oxalic acid. For the latter, all values are closer to unity, as expected for this function which depends on the weight given to each reflection. The reason for the discrepancy in the behaviour of the GooF of the two systems could be in the quality of the standard uncertainties of the reflection data, and the use of a non-optimal weighting scheme, which has been discussed elsewhere.37
3.2 Basis set
Using large basis sets is known to be beneficial within the computational framework because it allows, for example, minimising the basis set superposition error38 or predicting better vibrational frequencies.39 Considering this, we analysed the effect of using different basis sets in the HAR. The results are shown in Fig. 5. The first thing to notice is that the same result is obtained with all basis sets, i.e., both bond distances increase with the percentage of HF exchange. Moreover, the slope obtained with each basis set is relatively unchanged, in comparison with the intercept, which is notoriously different. The smallest basis set (def2-SVP) produces the largest distances. For the def2-TZVP and 6-311G** basis sets, the bond distances are similar and shorter than those obtained from the def2-TZVPP, cc-pVTZ and def2-TZVPPD basis sets. Quadruple basis sets generally show difficulties for convergence when clusters are used and therefore were not explored.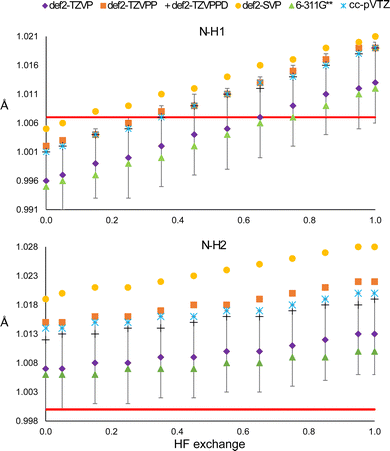 | ||
| Fig. 5 N–H1 (top) and N–H2 (bottom) distances obtained from the HAR, using different basis sets with the PBEx functional. The red line corresponds to the neutron diffraction value. | ||
Despite the mentioned differences, all distances obtained from triple-zeta basis sets are within the std error of the reference def2-TZVP, so there seems not to be a statistically significant improvement in using higher angular momentum or diffuse functions. The same is true for the ADPs (Fig. S15 and S16, ESI†). Note that none of the basis sets is closer to the N–H2 neutron diffraction reference distance. Furthermore, for all basis sets, the minimum value of R1 is obtained between 15 and 35% of HF exchange (Fig. S17, ESI†). Thus, it is not clear that increasing the basis set or HF exchange will improve the model.
3.3 Model effect
It could be the case that the former observations are particular to the PBE functional. To check whether this is not the case, we compared the results with those obtained with the BLYPx and the TPSSx functionals (Fig. 6). Also, the distances refined with HF and MP2 are shown for comparison.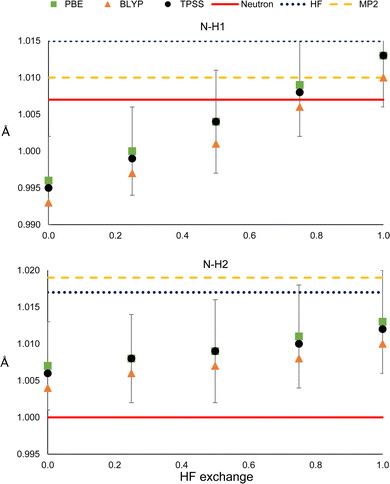 | ||
| Fig. 6 N–H1 (top) and N–H2 (bottom) distances obtained from HAR, using different electronic structure methods. | ||
As can be seen in Fig. 6, BLYPx and TPSSx show the same trend as PBEx; they increase the N–H bond distances. Similar quantities of HF exchange are needed to get closer to the neutron diffraction value for N–H1, but the three functionals go farther away from the reference of N–H2. Moreover, the refined values of BLYPx and TPSSx are always within the std errors of PBEx. This is also true for the ADPs, even for the MP2 and HF values in most of the cases (Fig. S18 and S19, ESI†). As expected from these results, HF predicts larger distances in both cases. While MP2 provides a bond distance similar to the reference for N–H1, it gives the worst value for N–H2. Thus, as long as the refined N–H bond lengths are obtained by fixing the exchange and correlation functionals (eqn (1)), they will increase with HF exchange.
Nevertheless, this trend is not straightforward when comparing commonly used density functionals that have already fixed (or range-dependent variable) amounts of HF exchange but different exchange and correlation expressions. The N–H refined distances obtained with PBE and PBE0 were compared with those derived with other density functionals that include meta-GGA (M06-L), hybrid-GGA (B3LYP and BHandHLYP), meta-hybrid GGA (M06 and M06-2X) and range-separated hybrid functionals (wB97X, CAM-B3LYP and LC-PBE). As can be seen in Fig. S20 (ESI†), it is not always the case that larger bond lengths are obtained from functionals with a larger amount of HF exchange. There is no appreciable change between the bond distances obtained from hybrid and range-separated functionals. Besides, the difference between the R1 values of hybrid and the more costly long-range separated functionals is too small to state that the latter offers a clear advantage. Therefore, the increase in the X–H bond lengths with HF exchange will only be observed when the exchange and correlation functionals are kept fixed.
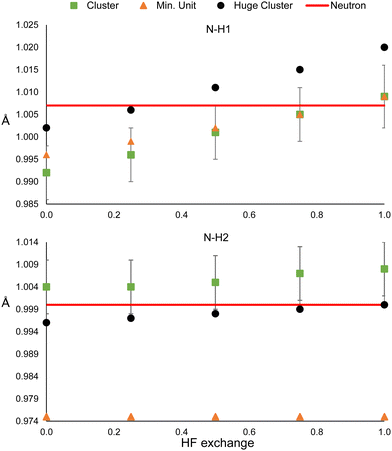
3.4 Long-range interactions
The model could be biased by the wrong description of long-rage interactions in two different ways. The presence of bulk effects, and the intrinsic problem of DFT for describing these types of interactions. In order to analyse the former, the refinements were repeated using a larger cluster: 32 molecules around the central one in urea, and 24 and 35 oxalic acid and water molecules, respectively, surrounding the central hetero-dimer. Also, the refinements were repeated using only the minimum unit, which consists of one molecule for urea, and the hetero-dimer for oxalic acid. In this way, bulk effects (simulated by cluster approach in the HAR) are quenched. By the time the refinements of these sections have performed an update of the Olex2 1.5-alpha version was released. We noticed that after the update, shorter N–H and O–H bonding distances were obtained for the main clusters (Fig. 1); hence, we could not reproduce the previous values. Nevertheless, this difference is smaller than the std error (see Fig. 2 and 3). Additionally, the same trends are observed, i.e., the distances increase with HF exchange.The results for the two N–H bonds of urea are shown in Fig. 7. The bond N–H1 distances of the single-molecule and the reference cluster (Fig. 1) are statistically equivalent for all HF exchange admixtures. In all cases, the N–H bonded obtained from the huge cluster is about 0.01 Å larger. This latter result suggests using the surrounding shell is not enough to model properly all bulk effects. In contrast, the N–H2 is not only strongly underestimated for the singe-molecule refinement (0.029 Å for 0% of mixing), but it remains unchanged even for high values of HF exchange. The values obtained from the huge cluster are lower than those of the reference cluster and closer to the neutron diffraction value. These results suggest that the effect of HF exchange over hydrogen atoms could be more relevant for strong hydrogen bonds.
The results of oxalic acid are shown in Fig. 8. For O–H1, the bonding distance is very similar in the hetero-dimer and the two clusters. Probably, the reason is that the O–H1⋯O hydrogen bond is present in the hetero-dimer and is already well modeled. This is reasonable because this is a very strong hydrogen bond that must have an important covalent contribution. In the case of O–H2 and O–H3, the standard cluster (Fig. 1) and the huge clusters provide also very similar results, which suggests that for strong hydrogen bonded systems considering only the first neighbouring shell is a good approximation for considering bulk effects. In contrast, the bonding distances are strongly underestimated by the hetero-dimer refinement. This supports the conclusion that HF exchange has a more relevant effect on the refined distances involved in strong hydrogen bonding.
In the case of the ADPs (Fig. S22–S26, ESI†), the reference and huge cluster values are always statistically equivalent, while the minimum unit deviates from these in about half of the cases. Again, R1 reaches its minimum around 25% of HF exchange and (Fig. S27, ESI†) is always higher for the minimum unit refinements (although still lower than the IAM). Therefore, our results indicate that there is a considerable improvement in the refinement by using a cluster consisting of the closest neighbours with respect to the minimum unit, but there is only a marginal gain in using a larger cluster in comparison to the computational demand this implies. Nevertheless, this could not be the case for ionic molecular systems.
With regards to the deficiency of DFT for describing long-range interactions, the situation with the popular hybrid functionals is more complicated. Normally, for an adequate description of the energetics or the geometry of supramolecular systems, the addition of empirical corrections to the energy, such as in Grimme's scheme,40–42 is enough to provide accurate results. Nevertheless, this type of correction does not alter the Kohn–Sham orbitals (and thus the electron density) and therefore, is useless for the HAR. Dispersion effects should be included in the SCF process in order to see an improvement in the HAR method. In its current implementation in Olex2 (version 1.5-alpha), a non-local density-dependent dispersion correction is used for the computation of the Kohn–Sham orbitals in HAR, when Orca is employed for the wavefunction calculations. This approach is based on the van der Waals correlation functional V10,43 in which a non-local (NL) term is added to the standard exchange–correlation energy to take into account long-range dispersion effects. Once the NL term is calculated using the ρ(r) of the non-corrected functional, a new SCF cycle is performed in order to obtain a new dispersion corrected ρ(r). This process is called the self-consistent non-local method (SCNL) and can be applied to several density functionals by adjusting a parameter employed in the computation of the NL term. We explored the effect of using this correction, along with changing the percentage of HF exchange, in the bonding distances obtained from HAR with the PBEx functional and the def2-TZVP basis set. In the case of urea, all the N–H distances were the same as those computed without using the NL correction. Since the SNCL method is more time-consuming and doesn’t seem to provide any clear advantage, we suggest it is not needed. Exploring other possibilities of using dispersion-corrected electron densities in HAR requires a deeper analysis that is out of the scope of this work, and will be a matter of future investigations.
4 Discussion
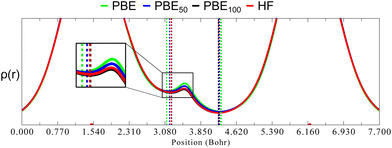
As mentioned before, one of the main goals of mixing HF exchange with density functionals, as well as of the improvement in the description of long-range interactions, has been to achieve chemical accuracy,44–48 which is generally defined in energetic terms as 1 kcal mol−1.49 Moreover, the usual DFT benchmark studies30,50–55 for accurate equilibrium geometries, stationary points, or vibrational frequencies also depend in predicting good energies and their derivatives, since they rely on the exploration of the potential energy surface. In contrast, in the HAR, energy has no role in the refinement process. Instead, ρ(r) is the most important property (although some issues such as the partition in atomic form factors,15 thermal motion or the introduction of experimental uncertainties37 are relevant as well). As will be shown, this difference explains why in geometry optimisations HF tends to predict short bond lengths for covalently bound main group elements, but it seems to happen just the opposite in the refined distances obtained from the HAR.The lack of electron correlation in HF introduces an artificial ionic character which causes an overestimation of bond dissociation energies and an underestimation of bond lengths.56 This deficiency in HF also causes an overlocalization of electrons (in free pairs, atoms or bonds), as opposed to the overdelocalization found in pure GGA functionals, which causes an overestimation of bond lengths. Largely, the success of hybrid functionals depends on the cancellation of these two opposite effects, as was mentioned before. To rationalise what consequences these contrasting phenomena have in the HAR, we compare ρ(r) in the line relying on the (almost) linear O1–H1⋯O3 hydrogen bond in oxalic acid for different admixtures of HF exchange (Fig. 9). These graphs were obtained from single point calculations performed over the geometry of a cluster (constructed as in Fig. 1), generated from the nuclear diffraction average positions.
As can be seen in Fig. 9, going from PBE to PBE100, the electron density in the position of the H nucleus diminishes. The results from PBE100 and HF are very close, meaning that correlation (at least described by PBE) has a negligible effect. As well, the bond critical points (marked by dotted lines) are displaced nearer to the hydrogen nucleus as HF exchange increases, which is more notorious for the covalent O1–H1 bond. These results point to a decrease in the H atom volume when HF exchange is increased. In order to quantify this, the QTAIM atomic charges and volumes were computed in each case (Table S1, ESI†). From these values, it is clear that as HF exchange increases, the charge transfer from the H atom to both O atoms increases. Going from PBE to PBE100, the O1 and O3 atoms gain −0.29 and −0.21 electrons, respectively, while the H atom loses 0.13. This behaviour is consistent with the ionic character introduced with HF exchange mentioned before. This charge transfer has a negligible effect on the O atoms volume (that increases by less than 2%), but strongly affects the H atom volume, which decreases by 42%. This explains why the increase in HF exchange seems inconsequential for the C–O bond distances obtained from the HAR for this system, but becomes relevant for the O–H bond lengths. Similar results, although with a less dramatic charge transfer are observed for the N–H1⋯O hydrogen bond in urea, which is consistent with the fact that the changes in the N–H1 distance are less severe (compare Fig. 2 and 3). Therefore, our results indicate that X–H bonds that are strongly polarised when involved in hydrogen bonding will be elongated in the HAR when HF exchange is increased. Moreover, this contraction of the H1 volume is consistent with the decrease observed in the ADPs of this atom. From Fig. 10, it is clear that the thermal ellipsoid of H1 is contracting more notoriously in the direction of the hydrogen bond. Thus, HF exchange is affecting both the static and dynamic components of the electron density in similar ways.
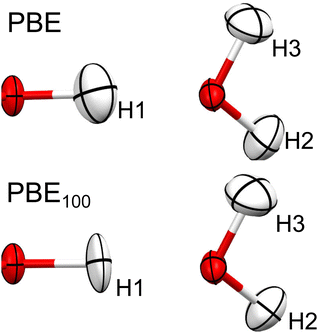 | ||
| Fig. 10 Thermal ellipsoids (at 50% probability) of H1, H2 and H3 of oxalic acid obtained from HAR, using PBE and PBE100. | ||
To rule out that the findings are the product of some other effects such as thermal diffuse scattering, we repeated the refinements against theoretical SFs of urea (convoluted with the neutron diffraction experimental ADPs). The theoretical structure factors were generated from a single point solid-state calculation, using the neutron diffraction lattice parameters and positions as input, with the Crystal17 software and the PBE0/POB-TZVP level of theory. As can be seen in Fig. S28 (ESI†), the refined distances increase as does the quantity of Hartree–Fock exchange. Regarding the ADPs (Fig. S29 and S30, ESI†), as with the experimental structure factors, there is no clear trend that any particular amount of HF exchange provides a better agreement with respect to the neutron diffraction reference. Finally, the R1 (Fig. S31, ESI†) shows a minimum of 0.25, as was observed in the experimental refinements. Since it also corresponds to the same amount of HF exchange that was employed for generating the SFs, it is a confirmation that the HAR is able to recover this fact.
Our explanation could provide a basis for understanding some of the trends found by Chodkiewicz et al.,15 who analyzed the effect of using different partition schemes for urea and oxalic acid dihydrated, in a method they called the generalized atom refinement. In particular, besides the Hirshfeld partition, they studied the Becke, iterative Hirshfeld, iterative stockholder and minimal basis iterative stockholder. While they didn’t observe any statistically significant difference between each partition (since the corresponding R1 factors were essentially the same for each), they did find that the refined X–H distances changed between each partition. From these partitions such as Becke and Hirshfeld, which yielded lower atomic charges for the H atoms, shorter X–H refined distances were obtained and vice versa. They also noticed that the refined X–H distances increased when going from BLYP to B3LYP and HF, as we did in this work. Therefore, it could be the general case that anything that reduces the volume of the non-spherical H atoms employed in the ab initio-based refinements (such as using different amounts of HF exchange or varying the partition method) will increase the refined X–H distances, although this hypothesis needs deeper exploration.
In summary, the effect of HF exchange causes two opposite effects in geometry optimisation calculations and HAR, although both are the product of the same physical phenomena, i.e., the increase in the ionic character and electron overlocalization. In the former procedure, greater HF exchange causes overbinding and, consequently, a shortening of bond distances. In contrast, in the HAR, the bond widens to compensate for the decrease in charge density along the bonding region and the nucleus, improving in this way, the match between the observed and calculated structure factors. These results are in agreement with the fact that H atom positions in ionic environments are more properly described by using HF or hybrid functionals in the HAR.57–59 This inference would imply that less polar bonds, such as C–H will be less sensitive to the increase of HF exchange, which will be the subject of future work.
5 Conclusion
The present work highlights that common assumptions in quantum computations do not always hold for the HAR. One could have anticipated that increasing the basis set, mixing a certain amount of HF exchange, or using correlated methods as MP2 would have improved the modeled ρ(r) needed for the HAR. Nevertheless, none of those trends were invariably observed for the selected systems. While the lowest R1 values were obtained for HF exchange mixtures of around 25%, such a correlation was not found in the description of X–H distances or the ADPs of H atoms. Some required very high values of HF exchange, while others needed none. This conclusion is especially important in the cases where the HAR is used for determining H positions from X-ray data alone. Moreover, the development of density functionals useful for the HAR, where the only important property is ρ(r) and the energy has no direct role, may take a different direction to that employed for quantum chemical calculations. Likewise, a more accurate modelling of the thermal motion of H atoms could be beneficial.Conflicts of interest
There are no conflicts to declare.Acknowledgements
B. L.-R. thanks CONACyT for the postdoctoral scholarship (CVU 366057). We acknowledge Jean Zay IDRIS (reference A0090811935) and the MeSU platform at Sorbonne-Université for the computational resources.References
- L. Massa and C. F. Matta, J. Comput. Chem., 2018, 39, 1021–1028 CrossRef CAS PubMed.
- M. L. Chodkiewicz, S. Migacz, W. Rudnicki, A. Makal, J. A. Kalinowski, N. W. Moriarty, R. W. Grosse-Kunstleve, P. V. Afonine, P. D. Adams and P. M. Dominiak, J. Appl. Crystallogr., 2018, 51, 193–199 CrossRef CAS PubMed.
- A. Genoni and P. Macchi, Crystals, 2020, 10, 473 CrossRef CAS.
- B. Gruza, M. L. Chodkiewicz, J. Krzeszczakowska and P. M. Dominiak, Acta Crystallogr., 2020, A76, 92–109 CrossRef PubMed.
- F. Kleemiss, E. K. Wieduwilt, E. Hupf, M. W. Shi, S. G. Stewart, D. Jayatilaka, M. J. Turner, K. Sugimoto, E. Nishibori and T. Schirmeister, et al. , Chem. – Eur. J., 2021, 27, 3407 CrossRef CAS PubMed.
- S. A. Shteingolts, J. K. Voronina, L. F. Saifina, M. M. Shulaeva, V. E. Semenov and R. R. Fayzullin, Acta Crystallogr., 2021, B77, 871–891 Search PubMed.
- S. C. Capelli, H.-B. Bürgi, B. Dittrich, S. Grabowsky and D. Jayatilaka, IUCrJ, 2014, 1, 361–379 CrossRef CAS PubMed.
- O. V. Dolomanov, L. J. Bourhis, R. J. Gildea, J. A. Howard and H. Puschmann, J. Appl. Crystallogr., 2009, 42, 339–341 CrossRef CAS.
- F. Kleemiss, O. V. Dolomanov, M. Bodensteiner, N. Peyerimhoff, L. Midgley, L. J. Bourhis, A. Genoni, L. A. Malaspina, D. Jayatilaka, J. L. Spencer, F. White, B. Grundkötter-Stock, S. Steinhauer, D. Lentz, H. Puschmann and S. Grabowsky, Chem. Sci., 2021, 12, 1675–1692 RSC.
- M. Chocolatl Torres, S. Bernes and U. Salazar Kuri, Acta Crystallogr., 2021, E77, 681–685 CrossRef PubMed.
- N. K. Hansen and P. Coppens, Acta Crystallogr., 1978, A34, 909–921 CrossRef CAS.
- C. Gatti and P. Macchi, in Modern Charge-Density Analysis, Springer, 2011, pp. 1–78 Search PubMed.
- L. J. Farrugia, IUCrJ, 2014, 1, 265–266 CrossRef CAS PubMed.
- K. K. Jha, B. Gruza, P. Kumar, M. L. Chodkiewicz and P. M. Dominiak, Acta Crystallogr., Sect. B: Struct. Sci., Cryst. Eng. Mater., 2020, 76, 296–306 CrossRef CAS PubMed.
- M. L. Chodkiewicz, M. Woińska and K. Woźniak, IUCrJ, 2020, 7, 1199–1215 CrossRef CAS PubMed.
- M. Woińska, S. Grabowsky, P. M. Dominiak, K. Woźniak and D. Jayatilaka, Sci. Adv., 2016, 2, e1600192 CrossRef PubMed.
- M. Woińska, M. L. Chodkiewicz and K. Woźniak, Chem. Commun., 2021, 57, 3652–3655 RSC.
- E. K. Wieduwilt, G. Macetti, L. A. Malaspina, D. Jayatilaka, S. Grabowsky and A. Genoni, J. Mol. Struct., 2020, 1209, 127934 CrossRef CAS.
- P. N. Ruth, R. Herbst-Irmer and D. Stalke, IUCrJ, 2022, 9, 286–297 CrossRef CAS PubMed.
- L. Goerigk and S. Grimme, Phys. Chem. Chem. Phys., 2011, 13, 6670–6688 RSC.
- S. S. Leang, F. Zahariev and M. S. Gordon, J. Chem. Phys., 2012, 136, 104101 CrossRef PubMed.
- P. Verma and D. G. Truhlar, Trends Chem., 2020, 2, 302–318 CrossRef CAS.
- M. G. Medvedev, I. S. Bushmarinov, J. Sun, J. P. Perdew and K. A. Lyssenko, Science, 2017, 355, 49–52 CrossRef CAS PubMed.
- E. R. Johnson, P. Mori-Sánchez, A. J. Cohen and W. Yang, J. Chem. Phys., 2008, 129, 204112 CrossRef PubMed.
- A. Genoni and B. Meyer, Adv. Quantum Chem., 2016, 73, 333–362 CrossRef CAS.
- I. Bytheway, D. J. Grimwood, B. N. Figgis, G. S. Chandler and D. Jayatilaka, Acta Crystallogr., 2002, A58, 244–251 CrossRef CAS PubMed.
- R. Boese, N. Niederprüm, D. Bläser, A. Maulitz, M. Y. Antipin and P. R. Mallinson, J. Phys. Chem. B, 1997, 101, 5794–5799 CrossRef CAS.
- P. Hohenberg and W. Kohn, Phys. Rev., 1964, 136, B864–B871 CrossRef.
- M. Ernzerhof and G. E. Scuseria, J. Chem. Phys., 1999, 110, 5029–5036 CrossRef CAS.
- J. C. Howard, J. D. Enyard and G. S. Tschumper, J. Phys. Chem. A, 2015, 143, 214103 CrossRef PubMed.
- H. Birkedal, D. Madsen, R. H. Mathiesen, K. Knudsen, H.-P. Weber, P. Pattison and D. Schwarzenbach, Acta Crystallogr., 2004, A60, 371–381 CrossRef CAS PubMed.
- R. Kamiński, S. Domagała, K. N. Jarzembska, A. A. Hoser, W. F. Sanjuan-Szklarz, M. J. Gutmann, A. Makal, M. Malińska, J. M. Bák and K. Wozńiak, Acta Crystallogr., 2014, A70, 72–91 CrossRef PubMed.
- T. H. Dunning Jr., J. Chem. Phys., 1989, 90, 1007–1023 CrossRef.
- F. Neese, F. Wennmohs, U. Becker and C. Riplinger, J. Chem. Phys., 2020, 152, 224108 CrossRef CAS PubMed.
- S. Swaminathan, B. Craven and R. McMullan, Acta Crystallogr., 1984, B40, 300–306 CAS.
- R. Dovesi, A. Erba, R. Orlando, C. M. Zicovich-Wilson, B. Civalleri, L. Maschio, M. Rérat, S. Casassa, J. Baima, S. Salustro and B. Kirtman, Wiley Interdiscip. Rev.: Comput. Mol. Sci., 2018, 8, e1360 Search PubMed.
- B. Landeros-Rivera, J. Contreras-Garca and P. M. Dominiak, Acta Crystallogr., 2021, B77, 715–727 Search PubMed.
- J. R. Alvarez-Idaboy and A. Galano, Theor. Chem. Acc., 2010, 126, 75–85 Search PubMed.
- E. Miliordos and S. S. Xantheas, J. Chem. Phys., 2015, 142, 03B604_1 Search PubMed.
- S. Grimme, J. Comput. Chem., 2004, 25, 1463–1473 CrossRef CAS PubMed.
- S. Grimme, J. Antony, S. Ehrlich and H. Krieg, J. Chem. Phys., 2010, 132, 154104 CrossRef PubMed.
- E. Caldeweyher, C. Bannwarth and S. Grimme, J. Chem. Phys., 2017, 147, 034112 CrossRef PubMed.
- O. A. Vydrov and T. Van Voorhis, J. Chem. Phys., 2010, 133, 244103 CrossRef PubMed.
- T. Schwabe and S. Grimme, Phys. Chem. Chem. Phys., 2006, 8, 4398–4401 RSC.
- J. Klimeš, D. R. Bowler and A. Michaelides, J. Phys.: Condens. Matter, 2009, 22, 022201 CrossRef PubMed.
- A. Otero-de-la Roza and E. R. Johnson, J. Chem. Phys., 2013, 138, 204109 CrossRef CAS PubMed.
- E. Brémond, I. Ciofini, J. C. Sancho-García and C. Adamo, Acc. Chem. Res., 2016, 49, 1503–1513 CrossRef PubMed.
- Y. Wang, Y. Li, J. Chen, I. Y. Zhang and X. Xu, JACS Au, 2021, 1, 543–549 CrossRef CAS PubMed.
- J. A. Pople, Rev. Mod. Phys., 1999, 71, 1267 CrossRef CAS.
- S. Parthiban, G. de Oliveira and J. M. L. Martin, J. Phys. Chem. A, 2001, 105, 895–904 CrossRef CAS.
- Q. S. Li, X. D. Xu and S. Zhang, Chem. Phys. Lett., 2004, 384, 20–24 CrossRef CAS.
- M. M. Quintal, A. Karton, M. A. Iron, A. D. Boese and J. M. L. Martin, J. Phys. Chem. A, 2006, 110, 709–716 CrossRef CAS PubMed.
- K. Theilacker, A. V. Arbuznikov, H. Bahmann and M. Kaupp, J. Phys. Chem. A, 2011, 115, 8990–8996 CrossRef CAS PubMed.
- A. Najibi and L. Goerigk, J. Comput. Chem., 2020, 41, 2562–2572 CrossRef CAS PubMed.
- M. W. D. Hanson-Heine, J. Phys. Chem. A, 2019, 123, 9800–9808 CrossRef CAS PubMed.
- D. Zhang and D. G. Truhlar, J. Chem. Theory Comput., 2020, 16, 5432–5440 CrossRef CAS PubMed.
- L. A. Malaspina, A. A. Hoser, A. J. Edwards, M. Woińska, M. J. Turner, J. R. Price, K. Sugimoto, E. Nishibori, H.-B. Bürgi, D. Jayatilaka and S. Grabowsky, CrystEngComm, 2020, 22, 4778–4789 RSC.
- L. A. Malaspina, A. Genoni, D. Jayatilaka, M. J. Turner, K. Sugimoto, E. Nishibori and S. Grabowsky, J. Appl. Crystallogr., 2021, 54, 718–729 CrossRef CAS PubMed.
- G. Novelli, C. J. McMonagle, F. Kleemiss, M. Probert, H. Puschmann, S. Grabowsky, H. E. Maynard-Casely, G. J. McIntyre and S. Parsons, Acta Crystallogr., 2021, B77, 785–800 Search PubMed.
Footnote |
| † Electronic supplementary information (ESI) available. See DOI: https://doi.org/10.1039/d2cp04098k |
| This journal is © the Owner Societies 2023 |

