 Open Access Article
Na+ diffusion mechanism and transition metal substitution in tunnel-type manganese-based oxides for Na-ion rechargeable batteries†
Irene
Quinzeni
a,
Kotaro
Fujii
 b,
Marcella
Bini
 cd,
Masatomo
Yashima
 b and
Cristina
Tealdi
 *cd
*cd
aRSE – Ricerca sul Sistema Energetico, Via R. Rubattino 54, 20134 Milan, Italy
bDepartment of Chemistry, School of Science, Tokyo Institute of Technology, 2-12-1 W4-17 Ookayama, Meguro-ku, Tokyo 152-8551, Japan
cDepartment of Chemistry, University of Pavia, Viale Taramelli 16, 27100 Pavia, Italy. E-mail: cristina.tealdi@unipv.it
dNational Reference Centre for Electrochemical Energy Storage (GISEL) – INSTM, Via G. Giusti 9, 50121 Firenze, Italy
First published on 11th November 2021
Abstract
Na0.44MnO2 (NMO) with a tunnel-type structure is a reference cathode material for rechargeable Na-ion batteries. In this work, structural, electrochemical and computational investigations are combined to study the properties of this material, particularly with reference to Cu substitution in the structure. For the first time, molecular dynamics (MD) is used to obtain insights into the mechanisms of Na+ diffusion in NMO, highlighting the role of structural modifications and Na distribution. The main results allow the investigation of the implication of high temperature treatments and the effect of Cu substitution on the defect and transport properties of the material with a tunnel-type structure. From an experimental point of view, the substitution promotes an increased stability of the material upon cycling and an improved capacity particularly at higher discharging rates, that stems from the synergistic effects of the composition, morphology and multiple polymorphs of the sample.
Introduction
Achieving efficient and sustainable energy storage is a key challenge of the present time. Lithium rechargeable batteries are widely used in the portable electronics market and their use is foreseen to grow and include a large sector of the emerging electric vehicles market. The ability to differentiate the chemistry on the basis of the functioning of secondary rechargeable batteries is of high importance in order to guarantee the right materials and performances for a particular application. For instance, Na-ion based rechargeable batteries (NIBs) are gaining attention as potential large stationary storage systems.1A key component in a rechargeable battery is the cathode material. The majority of high performance sodium-ion cathodes reviewed in the literature contains toxic and expensive elements like cobalt, vanadium or nickel.2,3 Na0.44MnO2 (NMO) is instead a well-investigated cathode material for NIBs based on earth abundant and non-toxic elements. Unfortunately, NMO presents performance problems in long cycling tests due to the dissolution of Mn3+ in the liquid electrolyte.4 Many studies have already been performed to tackle this problem while maintaining the goal of optimizing the work potential of this material. In particular, strategies that focus on the role of crystal morphology or the partial substitution of manganese with other transition elements are currently under intense investigation.5
NMO crystallizes in the orthorhombic system, in the Pbam space group, isostructural to the mixed oxide Na4Mn4Ti5O18.6 In the crystalline structure of NMO, three distinct crystallographic partially occupied sites for Na (called Na1, Na2 and Na3) and five distinct crystallographic sites for Mn are reported. According to the structural and computational data,7 two of these sites are occupied by Mn3+ ions and three by Mn4+ ions.
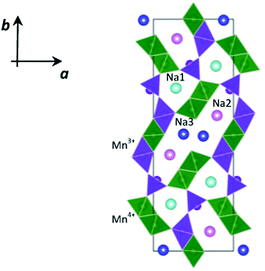
As shown in Fig. 1, this structure presents two types of channels running parallel to the c crystallographic axis: a smaller channel, 1D, which contains the Na+ ions positioned on the crystallographic site called Na1, and a larger S-shaped 2D tunnel, which contains the crystallographic sites called Na2 and Na3. All the Mn4+ ions and one of the Mn3+ ions are in octahedral coordination with oxygen, while one of the Mn3+ ions is in square pyramidal coordination. These coordination polyhedra share the vertices and edges to form the characteristic tunnel structure of this oxide, considered particularly promising for the intercalation of Na+ ions.8,9
The NMO tunnel oxide offers structural stability and a high diffusion rate of Na+ ions compared to the NaxMnO2 layer structured counterpart.10,11 However, it has a rather low average intercalation potential, which can be modulated through chemical substitution on the transition metal site. This strategy is also effective for many other cathode compounds.12–16
Indeed, substitution on different sites of the structure is a well-established strategy to modulate not only the average intercalation potential but also the structural stability upon battery cycling and the specific capacity at high charging rates.17–19 Among the possible substituents for the Na0.44MnO2 composition, different cations have been tested, such as Ti, Co, Ni, Mg and Cu.20–23 An emerging problem in the preparation of substituted NaxMnO2 materials is the relative stability of polymorphs; it is reported that doping/substitution, in particular with Cu, Ni and Co which could increase the average intercalation potential, tends to favour the formation of layered structures or even their mixtures.20,22,23 A beneficial effect of the presence of Cu2+ ions has been confirmed in systems consisting of a mixture of tunnel and layered phases, even if it is clearly difficult to separate the contributions due to the two components of the multi-phase system.22 At the same time, a positive effect on the cathode's electrochemical performances due to the presence of a mixture of polymorphs in the NaxMnO2 systems, either layered24 or tunnel/layered25,26 phases, has been evidenced also for different compositions.
The mechanism and energetics of Na+ ion diffusion in the NMO tunnel structure have been the subject of some recent articles based on density functional theory (DFT) calculations.4,21 The diffusion paths considered took into account the possible jumps shown schematically in Fig. 2 and reflected the intercalation profile previously calculated for this material.7
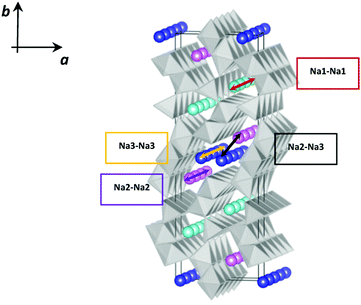 | ||
| Fig. 2 Schematic representation of four possible Na+ ion diffusion paths in Na0.44MnO2; Na1 cyan, Na2 pink, and Na3 blue. | ||
On the basis of these computational studies, it has been estimated that the path characterized by the lowest energy barrier is the one involving Na3–Na3 jumps, and the Na2–Na2 and Na2–Na3 pathways are characterized by slightly higher energy. A much higher energy barrier characterizes instead the Na1–Na1 path (Fig. 2). This suggests the existence of 2D diffusion in the larger channels and lower 1D diffusion in the smaller channels.4 Even though there is substantial agreement for what concerns the general features of the Na+ diffusion paths, the difference in energy barriers calculated in the two independent studies is high (Table 1), to the point of practically considering the Na1 site inactive on the basis of the calculations reported in ref. 21. Therefore, there is still an open debate on the mechanism of Na diffusion in the NMO tunnel structure.
The diffusion paths considered in ref. 4, and calculated at 0 K, were also visualized according to 3D bond-valence-sum-difference maps (BVSM) obtained from the experimental crystallographic data measured at room temperature. Room temperature is the target temperature for rechargeable battery applications and it is of course the most investigated situation; however, as we will show in this work, mechanistic features appearing at higher temperatures (typical of the synthetic procedures used to obtain the material) may have an influence on the properties of the material.
To date, as far as we know, there is no molecular dynamics (MD) study on the NMO tunnel structure with the objective of studying the structural and diffusion properties of Na ions as a function of temperature. In this work we hence combine experimental and computational approaches to investigate the effect of temperature and Cu2+ substitution on the structural, transport and electrochemical properties of this compound.
Methods
Synthetic procedures and characterization
Na0.44MnO2 and Na0.44Mn0.9Cu0.1O2 (denoted as NMO and NMCO in the following, respectively) were prepared by a sol–gel method. CH3COONa (with 10 wt% excess with respect to the stoichiometric amount) and (CH3COO)3Mn·4H2O with the addition of (CH3COO)2Cu·2H2O for the doped sample were weighed and dispersed in water. The solution was stirred, heated at 50 °C and left to dry overnight; then the dried powders were treated in an oven at 300 °C for 6 h (NMO) and at 200 °C for 5 h (NMCO) to remove all the organic components. Finally, the powders were thermally treated for 12 h at 840 °C (NMO) and 800 °C (NMCO) (heating rate 10 °C min−1). The samples were preserved in a glovebox to avoid contact with the atmosphere until subsequent use.An additional sample was prepared using the solid state reaction procedure, as already reported in our previous studies27,28 and used for the neutron diffraction characterization.
X-Ray powder diffraction (XRD) measurements were performed using a D2 phaser diffractometer (Bruker) with Cu Kα radiation in the angular range of 10–70° with a step size of 0.02° and a counting time of 2 seconds per step. The XRD data were refined to determine the main structural parameters based on the Rietveld method by using the Topas 3.0 software (Bruker). A pattern on the NMCO sample was also collected ex situ, after the galvanostatic measurement, to confirm the stability of the phases (NMCO-post in the following).
Neutron diffraction data on the solid-state NMO sample were measured at 1073 K using the E9 instrument in HZB-BER II (Berlin). Rietveld refinement was carried out using RIETAN-FP.29 During refinement, a common isotropic atomic displacement parameter (ADP) was refined for all cation sites, and isotropic ADPs were individually refined for oxygen sites.
A Tescan Mira3 scanning electron microscope (SEM) was used for the morphological study of the gold sputtered samples. Energy dispersive X-ray spectroscopy (EDS) analysis was performed using the same instrument on powder samples without the gold sputtered layer.
The slurries for the electrochemical measurements were prepared by mixing the active materials with carbon (Super C65) and binder (PVdF) in a weight ratio of 80![[thin space (1/6-em)]](https://www.rsc.org/images/entities/char_2009.gif) :
:![[thin space (1/6-em)]](https://www.rsc.org/images/entities/char_2009.gif) 10
10![[thin space (1/6-em)]](https://www.rsc.org/images/entities/char_2009.gif) :
:![[thin space (1/6-em)]](https://www.rsc.org/images/entities/char_2009.gif) 10 in N-methyl-2-pyrrolidone (NMP, Aldrich) and magnetically stirring for about three hours. After this, the slurries were coated on an aluminium foil by using a doctor blade, dried for 3 h in a vacuum oven at 100 °C and hot pressed for 5 min. The electrodes were cut in the form of discs (1 cm in diameter) and Swagelok cells were assembled in a dry box under an argon atmosphere (MBraun, O2 < 1 ppm, and H2O < 1 ppm) with the slurries as the working electrode, Na metal as the reference and counter electrode and a Whatman GF/A disc as the separator. The electrolyte of choice was 1 M NaPF6 in EC
10 in N-methyl-2-pyrrolidone (NMP, Aldrich) and magnetically stirring for about three hours. After this, the slurries were coated on an aluminium foil by using a doctor blade, dried for 3 h in a vacuum oven at 100 °C and hot pressed for 5 min. The electrodes were cut in the form of discs (1 cm in diameter) and Swagelok cells were assembled in a dry box under an argon atmosphere (MBraun, O2 < 1 ppm, and H2O < 1 ppm) with the slurries as the working electrode, Na metal as the reference and counter electrode and a Whatman GF/A disc as the separator. The electrolyte of choice was 1 M NaPF6 in EC![[thin space (1/6-em)]](https://www.rsc.org/images/entities/char_2009.gif) :
:![[thin space (1/6-em)]](https://www.rsc.org/images/entities/char_2009.gif) DEC 1
DEC 1![[thin space (1/6-em)]](https://www.rsc.org/images/entities/char_2009.gif) :
:![[thin space (1/6-em)]](https://www.rsc.org/images/entities/char_2009.gif) 1 v
1 v![[thin space (1/6-em)]](https://www.rsc.org/images/entities/char_2009.gif) :
:![[thin space (1/6-em)]](https://www.rsc.org/images/entities/char_2009.gif) v.
v.
Cyclic voltammetry (CV) was performed by using a Gamry 3000 potentiostat at a scan rate of 0.1 mV s−1 for six cycles in the potential range of 2.0–3.8 V. For the galvanostatic charge–discharge tests, the Swagelok cells were cycled using an Arbin LBT21084 battery tester in the same potential range at C-rates between C/10 and 5C. The samples were also cycled for 200 cycles at C/2 (with 5 cycles at C/10 before and after) in the same potential window.
Computational methods
Static lattice energy minimizations were carried out on the parent Na0.44MnO2 structure to investigate the energetics of point defect formation and the effect of Cu substitution in this structure. Calculations were carried out using the GULP code.30 Starting structural parameters were taken from our NPD data. The system was modelled through the use of semi-empirical pair potentials in the form of Buckingham functions and a mean field approach to take into account the partial occupancy of the three Na+ crystallographic sites. The positions of Mn3+ and Mn4+ were assigned based on the results of a previous density functional theory study,7 so that the starting configuration for our calculations is the one reported in Fig. 1.Lattice defects were modelled using the Mott–Littleton methodology, which allows the effective treatment of local relaxation around the defect,31 with a region I size of 14 Å and the radius for region II fixed at 30 Å. This approach has been applied successfully for the investigation of several cathode materials for rechargeable batteries.32–35
Molecular dynamics (MD) simulations were carried out using the DL_POLY Classic code.36 Employing potential-based methods allows the study of much larger systems for timescales which would not be possible with other methods, such as density functional theory (DFT). In particular, this approach has the advantage, especially for highly defective systems like the one reported here, to avoid the necessity to assign a special arrangement of defects and dopants, that is typically observed in ab initio MD simulations due the low number of ions that can be included in the simulation box, and that has no experimental evidence.
For the MD simulations, all the ions were treated as rigid ions. A supercell consisting of 5 × 2 × 10 unit cells (6200 ions) was used and several models were constructed. In particular, MD simulations were conducted on models (1) differing in composition (NMO and 10% CuO doped NMO, i.e. NMCO); (2) having the same composition, differing in the relative distribution of Na+ between the small 1D channel and the large S-shaped channel (i.e. relative occupation of the Na1 site 60%, 71%, 90%); and (3) according to ionic (Na0.49Mn0.9Cu0.1O2) or electronic (Na0.44Mn0.9Cu0.1O2) compensation of cation substitution. For the ionic compensation, the interstitial Na+ ions are positioned in the 2D channel, in agreement with the results discussed in the following session. A list of the models prepared for MD simulations is reported in Table S2 (ESI†).
Doped and undoped supercells were explicitly relaxed at a constant pressure using the GULP software prior to MD simulations. Then, they were equilibrated in the NPT ensemble at 1 atm in the temperature range of 300–1000 K for at least 400 ps with a 0.5 fs timestep. The equilibrated volume at each temperature and composition was used as the starting point for the following simulations in the NVT ensemble (Nose–Hoover thermostat, velocity Verlet integration algorithm), in which the system was further equilibrated for another 250 ps before the production run of 500 ps. Na ion trajectories were graphically analysed using the VMD software,37 while the mean square displacements (MSD) were extracted by using the Moldyn software.38 Na+ diffusion coefficients (D) were calculated from the linear interpolation of the MSD vs. time graph, through the relation:
Results
Structural analysis
The XRD patterns of NMO and NMCO samples are compared in Fig. 3. The main peaks are common to both the patterns and can be assigned to the tunnel phase (Fig. 1) crystallizing in the orthorhombic system with the Pbam space group.6 For a detailed structural analysis of the patterns, the Rietveld refinement was performed, and the main structural parameters are reported in Table 2.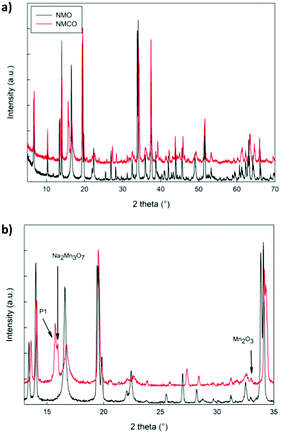 | ||
| Fig. 3 The XRD patterns in the whole angular range (a) and in a limited zone (b) of NMO and NMCO samples. The main peaks of the secondary phases are indicated. | ||
| Sample | Lattice parameters/Å (tunnel phase) | Lattice volume/Å3 | Crystallite size/nm | Secondary phases’ amount/wt% | R wp/%/GoF |
|---|---|---|---|---|---|
| NMO | 9.0902(3) | 680.11 | 115(1) | Mn2O3 0.4 | 16.3/2.2 |
| 26.4705(8) | |||||
| 2.8265(1) | |||||
| NMCO | 9.0981(4) | 672.4 | 99(1) | P1 3.1 | 11.6/1.8 |
| 26.1015(12) | Na2Mn3O7 2.9 | ||||
| 2.8315(1) | Mn2O3 0.3 | ||||
| NMCO-post | 9.1122(11) | 678.4 | 67(2) | P1 15 | 11.1/1.4 |
| 26.2453(26) | Na2Mn3O7 3.8 | ||||
| 2.8365(5) |
The lattice parameters of NMO are in good agreement with those reported in the literature39 and the crystallite sizes suggest a well crystalline sample. A small amount of Mn2O3 was detected, as commonly verified for analogous materials.39 For NMCO a slight contraction of cell volume was found, mainly due to the b axis reduction, while the crystallite sizes remained practically unchanged. Small amounts of secondary phases are present, together with the main tunnel phase, in particular traces of Mn2O3, Na2Mn3O7 and the layered P1 phase of general composition NaxMnO2. As an example, in Fig. S1 (ESI†) the comparison between the calculated and experimental XRD patterns of NMCO sample is shown. The good graphical comparison suggests the reliability of the structural refinements, as well as the agreement indices for both the samples reported in Table 2. The ex situ XRD pattern was also obtained for NMCO, after the galvanostatic cycling (Fig. S2, ESI†) and refined as described (see Table 2). The main peaks are again due to the tunnel phase; the major differences with respect to the as prepared NMCO sample concern the cell volume, slightly expanded and the amount of P1 secondary phase, five times that present in NMCO. This evidence suggests a partial conversion, during cycling, of the tunnel phase into the layered one, which could be beneficial to the capacity increase and the long-term stability of the sample.
The Rietveld refinement of NMO based on the neutron diffraction data was also carried out using the orthorhombic Pbam structure model. The refinement gave a good quality fit with good reliability factors, Rwp = 2.80% and RB = 2.63% (Fig. S3 in ESI†). Therefore, there is no phase transition for NMO from ambient temperature to 1073 K. This is consistent with the results of MD calculations as described later.
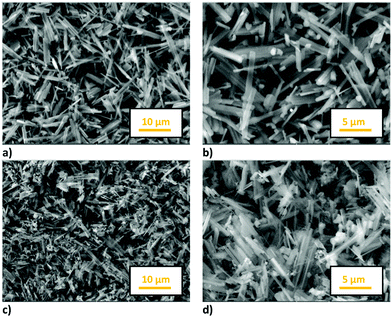
The morphology of the samples was analysed by SEM measurements: Fig. 4 shows the images of both the samples at different magnifications. The NMO and NMCO samples consist of hexagonal sticks, the prevailing morphology for this class of materials.39 In the NMO sample sticks with dimensions of about 5 μm long and 1 μm wide were found, while thinner and shorter sticks were obtained in NMCO (4 μm long and 0.4 μm wide). For this sample, some spherical particles clanged on sticks and/or as separated aggregates can be also observed.
EDS microanalysis was performed to verify sample stoichiometry (see Table S3, ESI†). The chemical compositions of NMO and NMCO are in good agreement with the expected ones. However, some inhomogeneity in NMCO can be evidenced by performing a punctual EDS analysis. In fact, the spherical aggregates (Fig. 4d) mainly consist of Cu and O, suggesting the segregation of small amounts of CuO, not detected by XRD due to its low percentage amount, below the sensitivity limit of the technique.
Electrochemical characterization
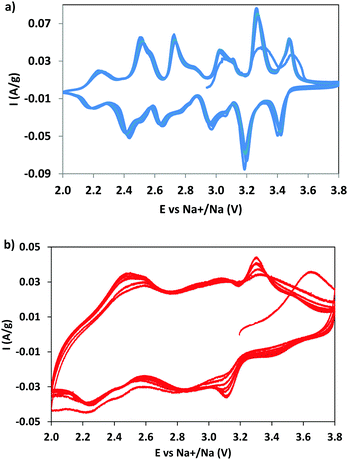
CV measurements were performed to identify the redox phenomena and to evidence the possible effect of dopant (Fig. 5). For NMO the CV curves (Fig. 5a) show six pairs of redox peaks, in good agreement with the data reported in the literature,7,28,40 due to the multistep process of sodium (de)insertion, involving several steps. The oxidation peaks at 2.73 and 3.10 V correspond to the (de)insertion of Na+ from the Na1 site; the peaks at 2.52, 3.03, 3.27, and 3.48 V to the Na2 site and those at 2.24 and 2.85 V to the Na3 site. This attribution, well accepted in the literature, was proposed on the basis of a study combining first principles calculations and experiments.7 The current is well maintained with cycling, suggesting an excellent reversibility and kinetics of the sodium intercalation/deintercalation process, thanks to the positive structural features.The NMCO curves are different (Fig. 5b): broad peaks overlapping one to another, reminiscent of those observed in NMO, are evident. The reason of the broadening could be due to the presence of copper, causing a structural disorder, and/or to the effect of secondary phases. The other curious evidence is the increase in peak intensity during cycling, differently from NMO. This effect is probably due to the conversion of the tunnel phase into a layered one during cycling (as demonstrated by ex situ XRD, see Table 2 and Fig. S2, ESI†), more efficient towards the sodium intercalation/deintercalation processes. In addition, we should remember that the NMCO sample contains, together with the main tunnel phase, two other electrochemically active phases that can also contribute to the redox phenomena (Table 2). In fact, the CV curves of NMCO also resemble those typical of layered materials,40,41 in which the peak at 2.5 V is attributed to the Mn3+/Mn4+ oxidation process and the others to the rearrangement of the octahedral layers during intercalation/deintercalation of sodium.42
Fig. 6 describes the galvanostatic cycling of NMO and NMCO at increasing C rates (up to 5C), followed by 10 cycles returning at C/2 to evaluate the structural stability of the materials. The electrochemical performances of the two samples are similar up to 1C, with analogous capacity values. At higher C rates, the NMCO capacity overcame that of NMO of about 20 mA h g−1, maintaining values of about 40 mA h g−1 at 5C. In addition, the capacity by returning to C/2 goes back to about 95 mA h g−1, slightly better than in the previous cycles, different from NMO.
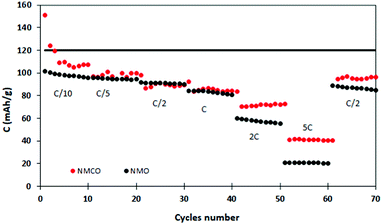 | ||
| Fig. 6 Discharge capacity at different C rates of the NMO and NMCO samples. The black horizontal line represents the theoretical capacity of NMO. | ||
For evaluating the long-term cyclic stability, the electrodes were galvanostatically charged/discharged at the C/2 rate for 200 cycles after pre-activation at C/10 for five cycles, with a return to C/2 for other five cycles. It is well evident from Fig. 7 that NMCO maintains a stable capacity of about 80 mA h g−1 during cycling (Fig. 7b), while the capacity of NMO is stable for only 80 cycles, then rapidly decreases to zero (Fig. 7a). The coulombic efficiency approaches 100% during the prolonged cycling, suggesting that the Cu doped Na0.44MnO2 sample can effectively delay the collapse or aggregation upon repetitive sodium insertion/extraction, leading to higher reversibility.
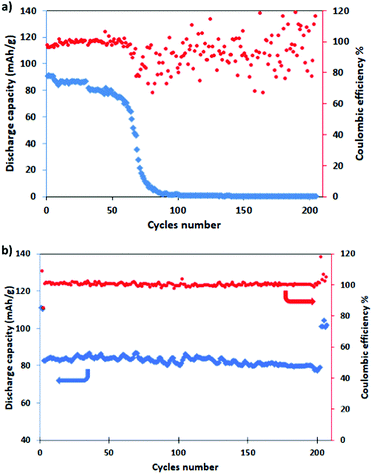 | ||
| Fig. 7 Long term cycling (blue) and coulombic efficiency (red) of (a) NMO and (b) NMCO for 200 cycles at C/2 (after a pre-conditioning for 5 cycles at C/10). | ||
Computational investigation
The tunnel-type structure was modelled through static lattice simulations. The list of potential parameters used in this study is provided in Table S1 (ESI†). The agreement between the calculated and experimental structure is good, with differences in cell parameters and volumes lower than 1% (Table S4, ESI†). Based on this model, the energetics of point defect formation in the tunnel-type NMO structure were investigated, with particular regard to the possible substitution of Cu ions on the Mn sites. To this aim, numerous substitution mechanisms were investigated, taking into account different scenarios, i.e. the preferential Mn sites for substitution (Mn3+ or Mn4+) and the preferential compensation mechanism (either oxygen vacancies or Na interstitial). The relevant quasi-chemical defect equations, written according to the Kröger–Vink notation, are reported in Table 3, together with the corresponding solution energies obtained by combining the appropriate energetics terms. Incorporation energies of Na ions in different interstitial positions were compared: the most favourable interstitial position is found in the large S-shaped tunnel, in agreement with the experimental reports on Na over-stoichiometric samples.43As shown in Table 3, the energetics of Cu2+ incorporation have been tested on both the Mn3+ and Mn4+ sites. In general, the results show a preference for the substitution of Cu2+ on the Mn3+ sites (eqn (1) and (2) in Table 3). Moreover, a preference has been found for the substitution on the crystallographic site with the square pyramid coordination compared to the octahedral coordination. This position has therefore always been considered for the calculations reported in Table 3. With regard to the ionic compensation mechanisms, the incorporation of interstitial Na+ ions (eqn (2)) is the most favourable mechanism compared to the formation of oxygen vacancies. Electronic compensation of Cu2+ substitution considered the localization of the hole on a Mn3+ ion, to give rise to a Mn4+ ion. In this case, a strong preference for Mn in the octahedral coordination is found (eqn (5)). The substitution energy value thus calculated turns out to be slightly lower than 0 eV, as if to indicate a sort of instability of the Mn3+ ion in this position. However, it is necessary to take into consideration the fact that this value was calculated by taking into account the value of the IV ionization energy for Mn, as reported in the NIST database. This value was obtained by extrapolation of other data and is therefore subject to uncertainties (declared in the order of 0.12 eV). Therefore, it is considered appropriate to point out that, while the trend found for the values reported in Table 3 is reliable, the absolute values may not be certain. Furthermore, an effect of the distribution of Na+ ions between the various crystallographic sites of this structure on the incorporation energies is expected.
Summarizing the results presented in Table 3, the calculation suggests a trend towards electronic compensation of Cu2+ substitution, in agreement with the experimental data on hybrid tunnel/layered systems of composition Na0.6Mn1−xCuxO2.19 For this MD study, Cu-substituted models containing Na+ interstitial or electronic holes localized on the Mn octahedral sites were tested and compared. From the experimental point of view, the synthesis of this compound is often (as in this study) carried out with excess of the reagent that is used as a source for Na8,28 which could also favour, at some level, the compensation mechanism provided in eqn (2) in Table 3, depending on the synthesis conditions.
The effect of several factors on the structural and diffusion properties of the material was taken into account. In particular, temperature, composition and distribution of Na+ ions among the crystallographic sites are factors that influence the trends in unit cell volume and lattice parameters. Results will be presented in the following text separately, with selected examples.
First of all, the effect of substitution and composition on structural parameters was evaluated; selected trends are reported in Fig. S4 (ESI†).
The results can be summarized as follows:
– the cell volume trends always show an increase along with the increase in the average occupation of the Na1 sites for different compositions.
– the cell volume increases almost linearly as a function of temperature, as expected, indicating no phase transition over the temperature range investigated.
– the calculations identify, for each model having the same partial occupation of the Na1 sites, a slightly larger volume for the substituted systems where ionic defect compensation is considered and a slightly lower volume for the model with electronic compensation compared to that of the undoped system.
This last finding is in agreement with the experimental data on tunnel structures containing Cu2+.22 On the contrary, for the partial replacement of Mn3+ with Co3+ in the NMO tunnel structure, an expansion of the structure is foreseen,23 and this is considered to be the reason why the calculated energy barrier for Na+ ion diffusion is lower in Co-doped material compared to undoped NMO.
Based on these results, it is here interesting to note that the electronic compensation model, in which the partial substitution of Cu for Mn in the structure is accompanied by a change in the average oxidation state of Mn, predicts a decrease in the average cell volume compared to the undoped system. In particular, calculations show a decrease in volume of approximately 1.1% compared to 1.03% that is experimentally derived from the Rietveld analysis of the pure and Cu-doped samples (Table 2), showing a very good agreement between calculations and experiments and supporting the choice of the electronic compensation model as the most likely for the samples investigated in this study.
In order to gain insights into the diffusion mechanism in the tunnel structure, trajectories from MD simulations were graphically analysed for various models, to separately highlight the effect of temperature, composition and Na ion distribution among the tunnels.
Fig. 8 graphically shows the effect of temperature on the diffusion mechanism in undoped NMO; by way of example, the results related to a sample of Na0.44MnO2 composition, with 71% of Na1 sites occupied are reported. For the sake of clarity, only the positions occupied by the Na ions over the simulation time are shown, while the Mn–O polyhedra are omitted. In the following figures, ions originally placed on Na1 are in cyan, Na2 are in purple and Na3 are in blue, respectively. As can be observed from the graphical analysis of the results, at room temperature (300 K), the diffused pathways already discussed in the literature are represented.4 In particular, we note the vibration of the ions contained in the smaller channels (Na1, cyan) and their diffusion along the channels in the c direction (Fig. S5, ESI†). With regard to the Na+ ions contained in the large channels, a clear overlap of colours (Na2 and Na3, purple and blue) is highlighted, supporting the fact that the Na2–Na3 path, recently predicted for the first time on the basis of DFT calculations,4 is indeed active in the long range diffusion of Na+ in this structure. In this model, there is no overlap between the cyan and blue/purple, indicating that ions initially positioned in the 1D channels (Na1, cyan) and those initially positioned in the 2D channels (Na2 and Na3, purple and blue) remain in their respective channels, implying that at room temperature there is no active hopping between the small 1D and large 2D channels.
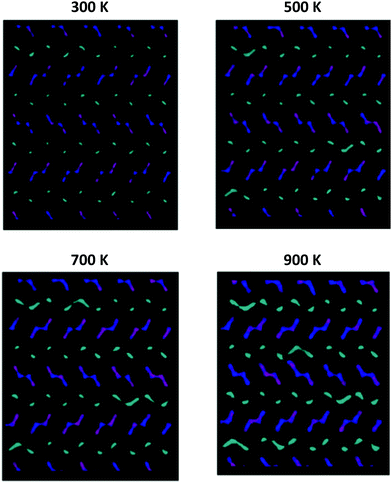 | ||
| Fig. 8 Comparison among the Na+ ion trajectories of Na0.44MnO2 sample, with 71% of Na1 sites occupied, as the temperature changes: view along the c axis (see Fig. S4, ESI† – for a view along the a axis). For the sake of clarity, only the positions occupied by the Na+ ions are reported; each point represents a position occupied by Na+ along the simulation time. Legend: Na1 – cyan; Na2 – purple; Na3 – blue. | ||
As the temperature increases, the diffusion of all species increases, as expected. It is important to point out how the present computational study highlights the possibility that, at high temperatures, new diffusion paths, until now not considered in the prediction of ionic transport properties in this material, open up. In particular, starting from 500 K and up to 900 K (Fig. 8), the diffusion of the Na+ ions initially positioned in Na1 (cyan) increases in the plane perpendicular to the c axis. This indicates that the present study suggests the possibility that at high temperatures, for the undoped system, Na1–Na1 inter-channel paths, not computationally analysed up to now, are possible. Since these inter-channel paths cannot be viewed at low temperatures, it is reasonable to suggest that they are characterized by higher energy barriers and can be thermally activated within the range of temperature explored in this study.
For a given composition, the occurrence of this phenomenon depends on the relative distribution of Na+ among the available crystallographic sites. In particular, in addition to being temperature dependent, the inter-channels crossing of Na1 is more pronounced at the same temperature for models in which the partial occupation of the Na1 site is higher (Fig. 9).
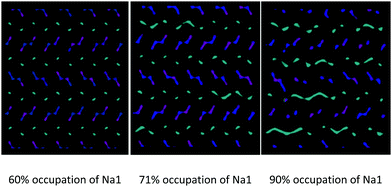 | ||
| Fig. 9 Comparison among the Na+ ion trajectories at 700 K for a given composition (Na0.44MnO2) as the average occupation of the Na1 site increases: view along the c axis. | ||
Graphical analysis of Na+ trajectories for Cu2+-doped systems (Fig. 10) suggests that the main characteristics of the diffusive model of Na+ ions in the structure do not vary significantly upon substitution. It is possible to appreciate how, under the conditions of equal temperature and partial occupation of the Na1 site, in this case the possibility of inter-channel passages tends to emerge not only between Na1 and Na1 sites but also between 1D and 2D channels. This phenomenon, thermally activated, is more evident as the temperature increases and may be partly related to the local disorder due to Cu2+/Mn3+ substitution, which causes a relaxation of the structure in the proximity of the defect. From the mechanistic point of view, there are no substantial differences between the two models tested to compensate for the substitutional defect (i.e. ionic or electronic compensation).
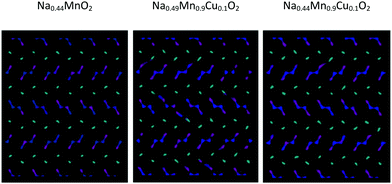 | ||
| Fig. 10 Comparison among the Na+ ion trajectories at 700 K for a given occupation of the Na1 crystallographic sites (60%) as the composition changes: view along the c axis. | ||
To rationalize the considerations made on the basis of the graphical analysis of the molecular dynamics data, the mean square displacements (MSD) of the particles as a function of the simulation time were calculated and plotted to extract the diffusion coefficients shown in the following figures.
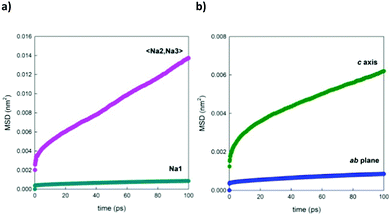
Fig. 11a shows, as a selected example, the comparison between the MSDs of Na+ ions positioned in the two different channels of the structure. This graph underlines the fact that the ions contained in the larger channel (Na2 and Na3) diffuse more rapidly than the ions contained in the smaller channels (Na1), in line with what is expected on the basis of the calculated energy barriers reported in the literature.4,21Fig. 11b, on the other end, separates the contributions for the displacement of Na+ ions (averaged over the three crystallographic sites) in the direction of the channels, along the c crystallographic axis of the structure, and in the ab plane, highlighting how the diffusion component along the channels is predominant. This trend is reproduced at each temperature investigated.
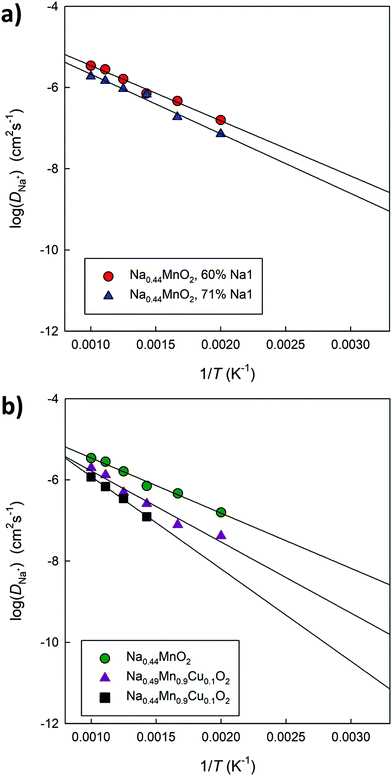
Fig. 12a compares the Arrhenius graphs relating to two undoped models, in which a different distribution of Na ions between small and large channels has been established. The results show that the relative occupation of these sites influences the average diffusion coefficient value in the structure. The calculated energy barriers (around 0.3 eV) are in good agreement with the data calculated on the basis of DFT simulations for this composition4 as well as with the experimentally derived values.44Fig. 12b compares the Arrhenius graphs relating to three models in which the relative distribution of Na ions between small and large channels has been fixed; the models differ in composition: Na0.44MnO2, Na0.44MnO2 doped at 10% mol with Cu2+ with ionic (Na interstitial) or electronic (Mn4+/Mn3+) compensation. The results show that doped systems in general have lower diffusivity and higher calculated energy barriers, which could be the combined result of a reduced calculated volume compared to that of the pure material (Fig. S5, ESI†) and inter-channel diffusion pathways that require higher energy (Fig. 10), in addition to local distortions around the defects and small changes in the partial occupation of Na crystallographic sites. The calculated diffusion coefficients for Na+ ions, once extrapolated at room temperature, vary between 10−9 cm2 s−1 and 10−12 cm2 s−1, depending on compositions and distribution of the Na+ ions over the available crystallographic sites, with generally lower values for Cu2+ doped systems and higher occupation of the Na sites in the small 1D channels. For comparison, experimentally derived apparent Na+ ion diffusion coefficients in Na0.44MnO2 were determined to vary between 1.08 × 10⁻¹³ to 9.15 × 10⁻¹² cm2 s−1 (aqueous system) and 5.75 × 10⁻¹⁶–2.14 × 10⁻¹⁴ cm2 s−1 (non-aqueous system).45 The higher calculated values compared to the experimental ones are expected to be due to the absence, in the calculations, of several experimental limitations as well as a slightly higher calculated volume compared to the experimental data at room temperature. We recall, however, that although the absolute values may not be exactly the same, the trends are considered reliable.
Discussion and conclusions
Na0.44MnO2 with a tunnel type structure is a highly promising and investigated cathode material for Na-ion batteries. Among the various approaches proposed for its optimisation, chemical substitution on the transition metal site and particle size engineering are the most investigated. In this work we combine structural, electrochemical and computational studies to get insights into the structural and electrochemical properties of this widely-used cathode, with the main intention to elucidate the effect of Cu2+ substitution. In addition, since the Na+ diffusion mechanisms within the tunnel structure still present open questions, part of the work is devoted to the clarification of the defect and transport features of the material, relevant to its optimization.The computational part of this work has indeed made it possible to visualize the Na+ diffusion paths in tunnel-type Na0.44MnO2 through molecular dynamics techniques. In agreement with the literature, Na+ diffusion in the structure involves all the crystallographic Na sites and it appears to be, at low temperatures, of 1D type in the small channels and 2D type in the large ones. In fact, connections between the Na2 and Na3 crystallographic sites within the large channels of the structure are also well visualized in MD. Since conduction occurs mainly along the c crystallographic axis, samples prepared with a particular morphology (short elongation of the particles along this axis) could have better electrochemical responses related to the ease of intercalation of the Na ion.
A high ionic diffusion is the basis for a good functioning of the material as an intercalation cathode, which is indirectly reflected on the capacity of the device that contains it, in particular in its value at a high cycling speed.
In this study we have shown that, for the same composition and temperature, the diffusion of the Na ion is dependent upon the Na distribution among the available crystallographic sites. This result may derive from the synergistic effect of various factors, including the structural modifications induced by the distribution of ions and the diffusion paths available. Indeed, the calculated cell volume increases with the occupation of the Na1 site (and the consequent increase in vacant sites in Na2 and Na3), which should favour the diffusion of ions in the 2D channels. However, it was highlighted how the increase in the average occupation of Na1 sites can promote the opening of the inter-channel diffusive passages characterized by energy barriers on average higher than the diffusion barriers along the channels themselves. On the whole, the energy barrier calculated in this study increases slightly (0.29 vs. 0.33 eV) when changing the Na ion occupation in the small 1D channels.
The opening of inter-tunnel diffusion paths is to be considered of little relevance during the operation of the material at room temperature and, from this point of view, the results of this study are in line with what is currently discussed in the literature regarding the most probable diffusion mechanism in the tunnel structure (i.e., intra-tunnel diffusion involving all the three crystallographic sites, with preference for the 2D tunnels). However, being thermally activated and, on the basis of the present model, accessible at temperatures typical of the synthesis of these compounds, inter-tunnel diffusion paths can affect the relative distribution of Na between the three crystallographic sites. Consequently, they can partially affect the experimental diffusion coefficients and the electrochemical performances of the material, providing an interpretative starting point for the differences found in the literature between very different experimental values in the samples prepared according to different methodologies. In this context, the cooling phase of the material at the end of the synthesis and the synthesis temperature itself could affect this distribution. The models analysed can also be considered representative of local situations that occur during the cycling of the material and be useful for separating the structural/electrochemical contributions in the interpretation of the complex charge/discharge profile of this material.
The experimental part of the work has highlighted the possibility to partially substitute Cu2+ for Mn3+ within the tunnel structure. This substitution is prone to promote the segregation of spurious but electrochemically active phases; furthermore, Cu-substitution partially activates the conversion of the tunnel structure into a layered one upon cycling. The combined effect of a different composition, a slightly different morphology and the presence of additional electrochemically active phases in the doped sample results in a better cycling stability and higher capacities at fast charging rates compared to the undoped system.
From an experimental and thermodynamic point of view, there seems to be a tendency of Cu2+ substitution to promote the formation of layered phases, with the formation of multi-phase systems in which it is experimentally unfeasible to separate the various contributions. In this study, computational investigation was used to clarify the effect of substitution with Cu on the structural, defect and transport properties of the tunnel structure. The data suggest that Cu2+ has a tendency to replace Mn3+ in pyramidal coordination and that the most likely compensation mechanism is the change in the average oxidation state of Mn, with a corresponding increase in Mn4+, preferentially incorporated in octahedral coordination. It is expected that the compensation of the substitutional defect through the incorporation of Na+ in the interstitial position is in any case to be considered as relatively favourable, especially considering the fact that the synthesis of this compound is almost always carried out in the presence of an excess of Na reagent. In both cases, however, a decrease in the Na+ diffusion coefficient in the substituted structure is expected with respect to the pure compound, which becomes more pronounced at lower temperatures. For example, the energy barriers calculated for the model that considers an occupancy equal to 60% for Na1 vary from 0.29 to 0.45 eV moving from the undoped to the doped system. This variation probably reflects the combination of several factors, including the trend of the cell volume with substitution, the greater disorder of the structure, and the opening of inter-channel diffusion paths characterized by high energy barriers.
As previously pointed out, the experimental data are derived from the combination of many factors, of which Na ion diffusion coefficient is only one aspect. The expected greater stability of the substituted compound compared to that of the pure one with regard to Mn dissolution in the electrolyte, the possible effect of the substitution on the modulation of the morphology of the particles, the expected increase in the working potential as the composition changes, and the synergy due to the presence of several polymorphs in the experimental system can have beneficial effects on the overall functioning of the device that overcome the disadvantage linked to the expected decrease in the Na+ diffusion coefficient in the tunnel structure of materials doped with Cu2+. We also point out that the difference in the Na diffusion coefficient between pure and substituted material, predicted on the basis of this work and extrapolated at room temperature, falls within the variability range of the experimental values measured for the pure composition alone.
Conflicts of interest
There are no conflicts to declare.Acknowledgements
This work was financed by the Research Fund for the Italian Electrical System under the Contract Agreement between RSE S.p.A. and the Ministry of Economic Development – General Directorate for the Electricity Market, Renewable Energy and Energy Efficiency, Nuclear Energy in compliance with the Decree of April 16th, 2018.References
- G. L. Xu, R. Amine, A. Abouimrane, H. Che, M. Dahbi, Z. F. Ma, I. Saadoune, J. Alami, W. L. Mattis, F. Pan, Z. Chen and K. Amine, Challenges in Developing Electrodes, Electrolytes, and Diagnostics Tools to Understand and Advance Sodium-Ion Batteries, Adv. Energy Mater., 2018, 8, 170240 Search PubMed.
- H. Li, M. Xu, Z. Zhang, Y. Lai and J. Ma, Engineering of Polyanion Type Cathode Materials for Sodium-Ion Batteries: Toward Higher Energy/Power Density, Adv. Funct. Mater., 2020, 30, 1–29 Search PubMed.
- A. Mauger and C. M. Julien, State-of-the-Art Electrode Materials for Sodium-Ion Batteries, Materials, 2020, 13, 3453 CrossRef CAS PubMed.
- M. S. Chae, H. J. Kim, H. Bu, J. Lyoo, R. Attias, B. Dlugatch, M. Oliel, Y. Gofer, S. T. Hong and D. Aurbach, The Sodium Storage Mechanism in Tunnel-Type Na0.44MnO2 Cathodes and the Way to Ensure Their Durable Operation, Adv. Energy Mater., 2020, 10, 2000564 CrossRef CAS.
- X. Zhou, A. Zhao, Z. Chen and Y. Cao, Research progress of tunnel-structural Na0.44MnO2 cathode for sodium-ion batteries: A mini review, Electrochem. Commun., 2021, 122, 106897 CrossRef CAS.
- W. G. Mumme, Na4Mn4Ti5O18, Acta Crystallogr., Sect. B: Struct. Sci., Cryst. Eng. Mater., 1968, 24, 1114 CrossRef CAS.
- H. Kim, D. J. Kim, D. H. Seo, M. S. Yeom, K. Kang, D. K. Kim and Y. Jung, Ab initio study of the sodium intercalation and intermediate phases in Na0.44MnO2 for sodium-ion battery, Chem. Mater., 2012, 24, 1205 CrossRef CAS.
- F. Sauvage, L. Laffont, J. M. Tarascon and E. Baudrin, Study of the insertion/deinsertion mechanism of sodium into Na0.44MnO2, Inorg. Chem., 2007, 46, 3289 CrossRef CAS PubMed.
- X. Xiang, K. Zhang and J. Chen, Recent advances and prospects of cathode materials for sodium-ion batteries, Adv. Mater., 2015, 27, 5343 CrossRef CAS PubMed.
- X. He, J. Wang, B. Qiu, E. Paillard, C. Ma, X. Cao, H. Liu, M. C. Stan, H. Liu, T. Gallash, Y. S. Meng and J. Li, Durable high-rate capability Na0.44MnO2 cathode material for sodium-ion batteries, Nano Energy, 2016, 27, 602 CrossRef CAS.
- Y. Wang, R. Xiao, Y.-S. Hu, M. Avdeev and L. Chen, P2-Na0.6[Cr0.6Ti0.4]O2 cation-disordered electrode for high-rate symmetric rechargeable sodium-ion batteries, Nat. Commun., 2015, 6, 6954 CrossRef CAS PubMed.
- K. Kubota, S. Kumakura, Y. Yoda, K. Kuroki and S. Komaba, Electrochemistry and Solid-State Chemistry of NaMeO2 (Me = 3d Transition Metals), Adv. Energy Mater., 2018, 8, 1703415 CrossRef.
- A. Kitajou, Y. Ishado, T. Yamashita, H. Momida, T. Oguchi and S. Okada, Title: Cathode Properties of Perovskite-type NaMF3 (M = Fe, Mn, and Co) Prepared by Mechanical Ball Milling for Sodium-ion Battery, Electrochim. Acta, 2017, 245, 424 CrossRef CAS.
- N. Tolganbek, Y. Yerkinbekova, S. Kalybekkyzy, Z. Bakenov and A. Mentbayeva, Current state of high voltage olivine structured LiMPO4 cathode materials for energy storage applications: A review, J. Alloys Compd., 2021, 882, 160774 CrossRef CAS.
- S. Patoux, L. Daniel, C. Bourbon, H. Lignier, C. Pagano, F. Le Cras, S. Jouanneau and S. Martinet, High voltage spinel oxides for Li-ion batteries: From the material research to the application, J. Power Sources, 2009, 189, 344 CrossRef CAS.
- N. Furuta, S.-i. Nishimura, P. Barpanda and A. Yamada, Fe3+/Fe2+ Redox Couple Approaching 4 V in Li2−x(Fe1−yMny)P2O7 Pyrophosphate Cathodes, Chem. Mater., 2012, 24, 1055 CrossRef CAS.
- P.-F. Wang, Y. You, Y.-X. Yin and Y.-G. Guo, Layered Oxide Cathodes for Sodium-Ion Batteries: Phase Transition, Air Stability, and Performance, Adv. Energy Mater., 2018, 8, 1701912 CrossRef.
- M.-Y. Wang, J.-Z. Guo, Z.-W. Wang, Z.-Y. Gu, X.-J. Nie, X. Yang and X.-L. Wu, Isostructural and Multivalent Anion Substitution toward Improved Phosphate Cathode Materials for Sodium-Ion Batteries, Small, 2020, 16, 1907645 CrossRef CAS PubMed.
- Z.-Y. Gu, J.-Z. Guo, X.-X. Zhao, X.-T. Wang, D. Xie, Z.-H. Sun, C. De Zhao, H.-J. Liang, W.-H. Li and X.-L. Wu, High-ionicity fluorophosphate lattice via aliovalent substitution as advanced cathode materials in sodium-ion batteries, InfoMat, 2021, 3, 694–704 CrossRef CAS.
- Y. Shao, Y. Zhou, M. Deng, Z. Tang, J. Liao and H. J. M. Bouwmeester, Performance of Na0.44Mn1−xMxO2 (M = Ni, Mg; 0 ≤ x ≤ 0.44) as a cathode for rechargeable sodium ion batteries, J. Solid State Electrochem., 2019, 23, 2979 CrossRef CAS.
- W. Zhong, Q. Huang, F. Zheng, Q. Deng, Q. Pan, Y. Liu, Y. Li, Y. Li, J. Hu, C. Yang and M. Liu, Structural Insight into the Abnormal Capacity of a Co-Substituted Tunnel-Type Na0.44MnO2 Cathode for Sodium-Ion Batteries, ACS Appl. Mater. Interfaces, 2020, 12, 47548 CrossRef CAS PubMed.
- T. R. Chen, T. Sheng, Z. G. Wu, J. T. Li, E. H. Wang, C. J. Wu, H. T. Li, X. D. Guo, B. H. Zhong, L. Huang and S. G. Sun, Cu2+ Dual-Doped Layer-Tunnel Hybrid Na0.6Mn1−xCuxO2 as a Cathode of Sodium-Ion Battery with Enhanced Structure Stability, Electrochemical Property, and Air Stability, ACS Appl. Mater. Interfaces, 2018, 10, 10147 CrossRef CAS PubMed.
- Y. T. Zhou, X. Sun, B. K. Zou, J. Y. Liao, Z. Y. Wen and C. H. Chen, Cobalt-substituted Na0.44Mn1-xCoxO2: phase evolution and a high capacity positive electrode for sodium-ion batteries, Electrochim. Acta, 2016, 213, 496 CrossRef CAS.
- L. Xue, X. Shi, B. Lin, Q. Guo, Y. Zhao and H. Xia, Self-standing P2/P3 heterostructured Na0.7CoO2 nanosheet arrays as 3D cathodes for flexible sodium-ion batteries, J. Power Sources, 2020, 457, 228059 CrossRef CAS.
- F. Zan, Y. Yao, S. V. Savilov, E. Suslova and H. Xia, Layered-tunnel structured cathode for high performance sodium-ion batteries, Funct. Mater. Lett., 2020, 13, 2051016 CrossRef CAS.
- Y. Xiao, Y.-F. Zhu, W. Xiang, Z.-G. Wu, Y.-C. Li, J. Lai, S. Li, E. Wang, Z.-G. Yang, C.-L. Xu, B.-H. Zhong and X.-D. Guo, Deciphering an Abnormal Layered-Tunnel Heterostructure Induced by Chemical Substitution for the Sodium Oxide Cathode, Angew. Chem., Int. Ed., 2020, 59, 1491–1495 CrossRef CAS PubMed.
- C. Ferrara, C. Tealdi, V. Dall’asta, D. Buchholz, L. G. Chagas, E. Quartarone, V. Berbenni and S. Passerini, High-performance Na0.44MnO2 slabs for sodium-ion batteries obtained through urea-based solution combustion synthesis, Batteries, 2018, 4, 8 CrossRef.
- V. Dall’Asta, D. Buchholz, L. G. Chagas, X. Dou, C. Ferrara, E. Quartarone, C. Tealdi and S. Passerini, Aqueous Processing of Na0.44MnO2 Cathode Material for the Development of Greener Na-Ion Batteries, ACS Appl. Mater. Interfaces, 2017, 9, 34891 CrossRef PubMed.
- F. Izumi and K. Momma, Three-Dimensional Visualization in Powder Diffraction, Solid State Phenom., 2007, 130, 15 CAS.
- J. D. Gale and A. L. Rohl, The General Utility Lattice Program (GULP), Mol. Simulations, 2003, 29, 291 CrossRef CAS.
- N. F. Mott and M. J. Littleton, Conduction in polar crystal solid. I. Electrolytic conduction in salts, Trans. Faraday Soc., 1938, 34, 485 RSC.
- J. C. Treacher, S. M. Wood, M. S. Islam and E. Kendrick, Na2CoSiO4 as a cathode material for sodium-ion batteries: structure, electrochemistry and diffusion pathways, Phys. Chem. Chem. Phys., 2016, 18, 32744 RSC.
- N. Kuganathan and A. Chroneos, Defects, Dopants and Sodium Mobility in Na2MnSiO4, Sci. Rep., 2018, 8, 14669 CrossRef PubMed.
- C. Tealdi, J. Heath and M. Saiful Islam, Feeling the strain: enhancing ionic transport in olivine phosphate cathodes for Li- and Na-ion batteries through strain effects, J. Mater. Chem. A, 2016, 4, 6998 RSC.
- J. M. Clark, S. Nishimura, A. Yamada and M. S. Islam, High-Voltage Pyrophosphate Cathode: Insights into Local Structure and Lithium-Diffusion Pathways, Angew. Chem., 2012, 124, 13326 CrossRef.
- W. Smith and T. Forester, DL_POLY_2.0: A general-purpose parallel molecular dynamics simulation package, J. Mol. Graphics, 1996, 14, 136 CrossRef CAS PubMed.
- W. Humphrey, A. Dalke and K. Schulten, VMD: Visual molecular dynamics, J. Mol. Graphics, 1996, 14, 33 CrossRef CAS PubMed.
- T. Róg, K. Murzyn, K. Binsen and G. R. Kneller, nMoldyn: A program package for a neutron scattering oriented analysis of Molecular Dynamics simulations, J. Comput. Chem., 2003, 24, 657 CrossRef PubMed.
- D. Zhang, W. Jing Shi, Y. Wang Yan, S. Dong Xu, L. Chen, X. Min Wang and S. Bin Liu, Fast and scalable synthesis of durable Na0.44MnO2 cathode material via an oxalate precursor method for Na-ion batteries, Electrochim. Acta, 2017, 258, 1035 CrossRef CAS.
- M. Nuti, D. Spada, I. Quinzeni, S. Capelli, B. Albini, P. Galinetto and M. Bini, From tunnel NMO to layered polymorphs oxides for sodium ion batteries, SN Appl. Sci., 2020, 2, 1893 CrossRef CAS.
- B. Peng, Z. Sun, S. Jiao, G. Wang and G. Zhang, Electrochemical Performance Optimization of Layered P2-Type Na0.67MnO2 through Simultaneous Mn-Site Doping and Nanostructure Engineering, Batteries Supercaps, 2020, 3, 147 CrossRef CAS.
- K. Hemalatha, M. Jayakumar and A. S. Prakash, Influence of the manganese and cobalt content on the electrochemical performance of P2-Na0.67MnxCo1−xO2 cathodes for sodium-ion batteries, Dalton Trans., 2018, 47, 1223 RSC.
- Q. Chu, X. Wang, Q. Li and X. Liu, The tunnel manganese oxide Na4.32Mn9O18: A new Na+ site discovered by single-crystal X-ray diffraction, Acta Crystallogr., Sect. C: Cryst. Struct. Commun., 2011, 67, 10 CrossRef PubMed.
- R. Ruffo, R. Fathi, D. J. Kim, Y. H. Jung, C. M. Mari and D. K. Kim, Impedance analysis of Na0.44MnO2 positive electrode for reversible sodium batteries in organic electrolyte, Electrochim. Acta, 2013, 108, 575 CrossRef CAS.
- D. J. Kim, R. Ponraj, A. G. Kannan, H. W. Lee, R. Fathi, R. Ruffo, C. M. Mari and D. K. Kim, Diffusion behavior of sodium ions in Na0.44MnO2 in aqueous and non-aqueous electrolytes, J. Power Sources, 2013, 244, 758 CrossRef CAS.
Footnote |
| † Electronic supplementary information (ESI) available. See DOI: 10.1039/d1ma00901j |
| This journal is © The Royal Society of Chemistry 2022 |

