Single-particle spectroelectrochemistry: electrochemical tuning of plasmonic properties via mercury amalgamation in mesoporous silica coated gold nanorods without structural deformation†
Yola Yolanda
Alizar
a and
Ji Won
Ha
 *ab
*ab
aAdvanced Nano-Bio-Imaging and Spectroscopy Laboratory, Department of Chemistry, University of Ulsan, 93 Daehak-ro, Nam-gu, Ulsan 44610, Republic of Korea
bEnergy Harvest-Storage Research Center (EHSRC), University of Ulsan, 93 Daehak-ro, Nam-gu, Ulsan, South Korea. E-mail: jwha77@ulsan.ac.kr; Fax: +82 52 712 8002; Tel: +82 52 712 8012
First published on 2nd May 2022
Abstract
This paper elucidates the mercury (Hg) amalgamation induced by electrochemical reduction on gold nanorods coated with mesoporous silica shell (AuNRs@mSiO2) using single-particle spectroelectrochemistry. First, the silica shell significantly enhanced the structural stability of AuNR cores after Hg amalgamation with the application of linear sweep voltages (LSVs). Thus, we were able to focus on the spectral changes of AuNRs@mSiO2 induced by the deposition of Hg without the disturbance of structural deformation, which also strongly affects localized surface plasmon resonance (LSPR) properties. Second, following the application of LSVs in the presence of Hg2+, a remarkable blueshift of the LSPR peak was observed, caused by the lowering of the work function due to the Hg adsorption, donating electron density to Au. Furthermore, the LSPR linewidth also dramatically increased after the Hg deposition with LSV. Lastly, the evolution of the Hg amalgamation process was directly observed by monitoring real-time LSPR peaks and LSPR linewidth shifts of a single AuNRs@mSiO2 in the Hg solution according to the application of the electrochemical potential. Moreover, the results showed the possibility of the in situ tuning of the LSPR properties of AuNRs@mSiO2 by Hg deposition via electrochemical potential manipulations without the disturbance of the structural variations of AuNR cores.
Mercury (Hg) is considered a toxic metal because it can easily accumulate in the body and damage organs such as the lungs, kidneys, liver, and brain even at small concentrations.1 To date, extensive studies on reducing Hg concentrations in the environment have been conducted. Among these is the use of the amalgamation process, where plasmonic gold nanoparticles (AuNPs) are reacted with Hg with strong affinity. The formation of Au–Hg amalgams has been used for the accurate sensing of Hg with high toxicity2–7 and water purification by removing Hg ions from polluted water.8–10
The direct observation of chemical reactions in AuNPs is of great importance to better understanding the processes for catalytic reaction and sensing applications.11 So far, dark-field (DF) microscopy has been effectively used to directly observe and elucidate the reaction mechanisms of the chemical processes occurring on single AuNPs.11–13 Recently, the DF setup was further combined with electrochemical cells to achieve the spectroscopic measurement of electrochemical processes on AuNP surfaces.11,14–17 In this spectroelectrochemical approach, electrodes comprised of low-density AuNPs deposited on indium tin oxide (ITO) substrates were used to inject electrons into nanoparticles whose optical responses were then detected by DF microscopy and spectroscopy.11 For example, the injected electrochemical charges enabled the modulation of the optical properties of anisotropic gold nanorods (AuNRs) at the single-particle level.14,15
Recently, several groups demonstrated the structural and spectral alterations according to the Hg deposition in the amalgamation process of bare AuNRs.11,13,18 The AuNRs exposed to Hg were reshaped (from elongated to spherical nanoparticles) with the formation of Au–Hg amalgams, followed by a remarkable blueshift in the localized surface plasmon resonance (LSPR) peak. Thus, both the Hg deposition on the AuNRs and the shape deformation simultaneously affected the spectral variations. However, we recently presented Hg amalgamation via chemical reductions in AuNRs coated with mesoporous silica shell (AuNRs@mSiO2).19 The mesoporous silica shell suppressed the structural deformation of the AuNR cores caused by the Au–Hg amalgamation. This enabled the monitoring of spectral responses according to the Hg deposition on the AuNR cores without the disturbance of shape deformations in single AuNRs@mSiO2. However, no studies have yet elucidated the structural and spectral variations of AuNRs@mSiO2 induced by the electrochemical reduction of Hg in the amalgamation process with the application of the electrochemical potential.
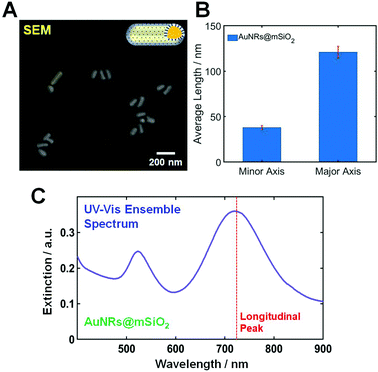
The AuNRs@mSiO2 used in this study were purchased from Nanopartz (CO, Loveland, USA). The morphologies of AuNRs@mSiO2 were characterized using scanning electron microscopy (SEM). Fig. 1A shows a SEM image of AuNRs@mSiO2, and the size of the AuNR cores inside the mesoporous silica shell was determined to be 40(±2.4) nm × 121(±6.6) nm, as shown in Fig. 1B. An additional SEM image showing many AuNRs@mSiO2 is provided in Fig. S1.† Moreover, the thickness of the mesoporous silica shell was about 22 nm (Fig. S2†). Fig. 1C shows an ultraviolet-visible (UV-Vis) extinction spectrum of AuNRs@mSiO2 in distilled water, and two transverse and longitudinal LSPR peaks of the AuNR cores are seen at approximately 530 and 723 nm, respectively.
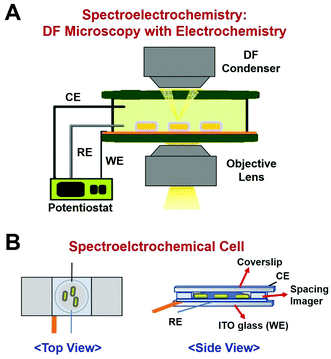
In this study, we employed a single-particle spectroelectrochemistry approach to investigate the Hg amalgamation in single AuNRs@mSiO2 deposited on an ITO glass. Spectroelectrochemistry is a powerful technique based on DF microscopy and spectroscopy coupled to an electrochemical workstation.11,15–17 DF microscopy and spectroscopy are used to detect changes in the optical properties of single nanoparticles, whereas the electrochemical potential is applied to nanoparticles on an ITO glass. An experimental setup for DF microscopy-based spectroelectrochemistry is shown in Fig. 2A. A spectroelectrochemical cell (SEC, Fig. 2B) was built with the ITO coverslip as the working electrode (WE), platinum (Pt) wire with 0.076 mm diameter as the counter electrode (CE), and an insulated Pt wire (AM Systems) as the quasi-reference electrode (RE).
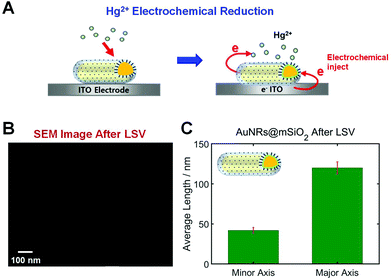
In this study, AuNRs@mSiO2 were deposited on an ITO WE that can inject electrons to nanoparticles through electrochemical potential manipulation (Fig. 3A). Thus, this study used the reduction of Hg2+ through electrochemical injection in the absence of any chemical reductant (e.g., NaBH4), and the direct Hg amalgamation of AuNRs@mSiO2 was studied through a spectroelectrochemistry approach (Fig. 3A). Recently, morphological changes were reported according to the Hg amalgamation of anisotropic AuNRs.13,18 Bare AuNRs exposed to Hg were reshaped from elongated nanoparticles to spherical nanoparticles, which can affect their LSPR properties. Furthermore, we recently reported that the mesoporous silica shell in AuNRs@mSiO2 enhanced the structural stability of the AuNR cores against shape deformation induced by Hg amalgamation.19 However, no studies have yet reported the structural stability of AuNRs@mSiO2 according to electrochemical Hg amalgamation with the application of the electrochemical potential to nanoparticles.
We first checked the structural variations of the AuNRs@mSiO2 after applying LSVs in the presence of HgCl2. SEM images of AuNRs@mSiO2 were obtained 1 h after their exposure to a Hg solution with LSVs. As shown in Fig. 3B and S3†, the aspect ratio (AR) of the AuNRs@mSiO2 was not decreased after the Hg amalgamation with LSVs. This result is clearly different from that of bare AuNRs, which display major structural deformations after amalgamation.11,13,18 Before the Hg amalgamation, the average AR of the AuNRs@mSiO2 was 3.02(±1.21), corresponding to 40(±2.4) nm in width and 121(±6.6) nm in length, respectively (Fig. 1B). After the electrochemical Hg amalgamation in the presence of 0.1 M potassium chloride (KCl) as the supporting electrolyte and 10 μM HgCl2 for 1 h, the average AR was approximately 2.93, corresponding to 41(±3.5) nm in width and 120(±7.5) nm in length, respectively (Fig. 3C). Therefore, we confirmed that the silica shell significantly enhanced the structural stability of AuNRs despite the electrochemical Hg amalgamation, which induces significant structural deformation. This result is consistent with our recent study on chemical reduction in the Hg amalgamation of AuNRs@mSiO2.19
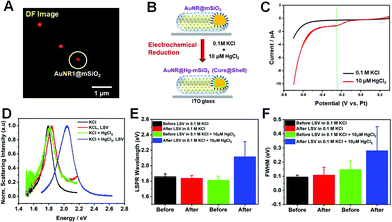
Next, we investigated the LSPR spectral changes of AuNRs@mSiO2 before and after Hg amalgamation via electrochemical reduction under the DF microscopy combined with an electrochemical workstation (Fig. 2 and S4†). DF images were obtained before and after the application of cathodic linear potential sweeps, and they were correlated with the overall current profiles acquired in the applied potential range of 0.3 to −0.7 V (vs. Pt). Fig. 4A shows a DF scattering image of single AuNRs@mSiO2 on the ITO glass before applying LSV in absence of Hg2+. Afterward, SECs with AuNRs@mSiO2 on the ITO were filled with 0.1 M KCl as the supporting electrolyte and 10 μM HgCl2. With the application of LSV in the presence of 0.1 M KCl and 10 μM HgCl2, Hg2+ was electrochemically reduced, and Hg atoms were deposited on the AuNR surfaces to form AuNRs@Hg–mSiO2 (core@shell) (Fig. 4B). A major advantage of using AuNRs@mSiO2 in this study is that we can directly reveal their LSPR spectral changes by focusing on the effect of Hg deposition without considering the effects of structural variations driven by Hg deposition that can also strongly affect the LSPR properties.
We first obtained linear sweep voltammograms to confirm the electrochemical reduction of Hg2+, as shown in Fig. 4C. The electrochemical potential varied from 0.3 to −0.7 V (vs. Pt) during LSV. The current–voltage profile acquired without Hg2+ is shown in the black curve, indicating the absence of faradaic currents. The red curve was recorded after the introduction of 10 μM Hg2+. A peak was observed at approximately −0.25 V (green dotted line in Fig. 4C), attributed to the electrochemical reduction of Hg2+ to Hg0. We further confirmed that the reduction peak weakened when the concentration of Hg2+ was decreased to 5 μM, as demonstrated in Fig. S5A and B.† Therefore, we ensured that the electrochemical reduction occurred in SEC with the application of LSV in this study.
DF scattering spectra were then recorded for single AuNRs@mSiO2 before and after the application of the electrochemical potential. Fig. 4D shows the single-particle scattering spectra of a AuNR1@mSiO2 indicated by a white circle in Fig. 4A. The initial LSPR spectrum of the circled AuNR1@mSiO2, characterized by an LSPR wavelength of 1.75 eV and an FWHM of 109 meV, exhibited no drastic optical variations after LSV in the pure electrolyte (red curve) and after the introduction of Hg2+ to the SEC (green curve). However, following the application of LSV in the presence of Hg2+, dramatic variations were observed in the scattering spectrum (blue curve). As shown in Fig. 4D, after the Hg amalgamation with LSV, the LSPR wavelength blueshifted from 1.75 to 2.13 eV. This result is further supported by the ensemble spectra of AuNRs@mSiO2 obtained before and after Hg amalgamation (Fig. 1C and S5†). Because AuNRs@mSiO2 are stable against the structural deformation induced by the Hg amalgamation (Fig. 3), the blueshift shown for AuNRs@mSiO2 after Hg amalgamation can be attributed mainly to the lowering of the work function due to the Hg adsorption, donating electron density to Au.20 Furthermore, the LSPR linewidth (or FWHM) can also provide important information on plasmon damping in single AuNRs.21–25 The LSPR linewidth of AuNR1@mSiO2 showed a dramatic increase to 246 meV after the Hg deposition with LSV (Fig. 4D). The strong plasmon damping observed for single AuNRs@mSiO2 in this study was caused by the Hg deposition on the AuNR surface.19
Additionally, we measured 30 more single AuNRs@mSiO2 under the same experimental conditions to verify the tendency shown in Fig. 4D. We observed significant optical changes after applying LSV in the presence of Hg2+ (blue bar, Fig. 4E), consistent with the result for AuNR1@mSiO2 in Fig. 4D. A dramatic blueshift of the LSPR wavelength from 1.798 eV (green bar) to 2.167 eV (blue bar) was observed when LSV was applied in the presence of 10 μM Hg2+ caused, as shown in Fig. 4E. Similarly, the same result (or tendency) was obtained for AuNRs@mSiO2 in a small concentration of 5 μM Hg2+ (Fig. S6†). We also confirmed that, in addition to the LSPR wavelength, the FWHM was remarkably increased after the Hg deposition on the AuNR cores via the application of LSV in AuNRs@mSiO2. The LSV application in the presence of 10 μM Hg2+ remarkably broadened the LSPR linewidth from 145 meV (green bar) to 279 meV (blue bar), as shown in Fig. 4E. Therefore, the results provide deeper insight into the effect of Hg deposition by electrochemical reduction on spectral changes in single AuNRs@mSiO2 without structural deformation and disturbance.
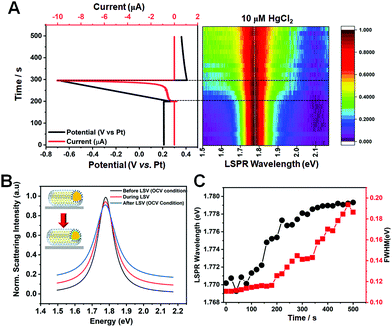
Single-particle spectroscopy enables gaining insight into the time-dependent adsorption kinetics of Hg ions on AuNR cores. Thus, the evolution of the Hg amalgamation process was directly observed by acquiring the real-time scattering spectra of single AuNRs@mSiO2 in the presence of 10 μM Hg2+ to better understand LSPR spectral changes caused by Hg amalgamation. Initially, the applied potential was kept constant, and then linear cathodic potential sweeps and open-cell voltage (OCV) conditions were applied. Representative potential vs. time and current vs. time curves subjected to electrochemical measurements (linear sweep voltammetry) are shown for a single AuNR@mSiO2 in the solution of 0.1 M KCl and 10 μM HgCl2 (Fig. 5A). In addition, the curves are correlated with a two-dimensional (2D) plot obtained from 500 scattering spectra acquired in situ for 500 s (1 spectrum per s). In the real-time analysis of the Hg amalgamation process, the LSPR wavelength remained constant during the first 190 s when the potential of 0.2 V (vs. Pt) was applied constantly. Afterwards, a slight increase of the LSPR wavelength was observed between 190 s and 200 s when the applied potential was remained constant at 0.3 V (vs. Pt). Finally, the LSPR wavelength slightly blueshifted between 200 and 300 s when the linear potential scan was applied from 0.3 to −0.7 V (vs. Pt, LSV), followed by the use of the OCV condition. In addition, the FWHM increased concomitantly with the recorded blueshift arising from the application of a cathodic potential scan. LSPR peak changes before, during, and after LSV are clearly observed in single-particle scattering spectra of the nanoparticle (Fig. 5B). The LSPR peak slightly blueshifted with the LSPR linewidth broadening during the application of LSV (Fig. 5C). The spectral changes are related to the deposition of Hg on the AuNR surface with the formation of a core–shell structure. Therefore, we monitored the in situ time-dependent spectral changes (LSPR wavelength and FWHM) caused by the formation of Hg-coated core–shell AuNRs (AuNRs@Hg–mSiO2) through single-particle measurements.
Two important points must be further discussed in Fig. 5. First, Schopf et al. reported morphological and spectral changes according to the Hg concentration in the amalgamation of bare AuNRs.11,13 AuNRs exposed to Hg were reshaped to spherical nanoparticles with the formation of Au–Hg amalgams, accompanied by a remarkable blueshift in the LSPR peak. In contrast, the AuNRs@mSiO2 used in this study were stable against structural deformations caused by the Hg amalgamation and LSV because of the silica shell. Therefore, we investigated the spectral changes of AuNRs@mSiO2 induced by the deposition of Hg without the disturbance of morphological variation, which also strongly affects the LSPR properties. Second, so far, various attempts have been made to tune the LSPR properties of metal nanostructures using the electrochemical method.26–30 A feature of the electrochemical potential control method is its ability to change the absolute potential of the electrons in metal nanostructures, which can cause a resonance energy shift. For instance, Oikawa et al. reported the control of electrochemical copper deposition or dissolution reactions at the surface of Au nanostructures.27,30 Similarly, the present study showed the possibility of in situ tuning of the LSPR properties (resonance energy and LSPR linewidth) of AuNRs@mSiO2 through Hg deposition via electrochemical potential manipulation without the disturbance of spectral variation caused by Hg-induced structural deformations (Fig. 5).
In summary, we investigated the Hg amalgamation induced by electrochemical reduction on AuNRs@mSiO2 using single-particle spectroelectrochemistry. First, the silica shell significantly enhanced the structural stability of the AuNR cores after LSV for the Hg amalgamation. Thus, we were able to focus on the spectral changes of AuNRs@mSiO2 induced by the deposition of Hg without the disturbance of structural changes, which can also strongly affect the LSPR properties. Second, following the application of LSV in the presence of Hg2+, dramatic changes occurred in the scattering spectrum. After the Hg amalgamation with LSV, a dramatic blueshift of LSPR peak was observed, caused by the lowering of the work function due to the Hg adsorption, donating electron density to Au. Furthermore, the LSPR linewidth also dramatically increased after the Hg deposition with LSV. Lastly, we directly observed the evolution of the Hg amalgamation process by monitoring real-time LSPR peaks and FWHM shifts of single AuNRs@mSiO2 in the Hg solution during LSV. In addition, the present study showed the possibility of the in situ tuning of LSPR spectral properties (characteristic resonance energy and LSPR linewidth) of AuNRs@mSiO2 through Hg deposition via electrochemical potential manipulation without the disturbance of spectral variations caused by Hg-induced structural deformations.
Author contributions
Y. Y. Alizar performed all the experiments. Y. Y. Alizar and J. W. Ha analyzed the data. Y. Y. Alizar and J. W. Ha wrote the manuscript.Conflicts of interest
There are no conflicts to declare.Acknowledgements
This work was supported by two National Research Foundation of Korea (NRF) grants funded by the Korean government (MSIP) (No. 2018R1C1B3001154 and No. 2019R1A6A1A11053838).Notes and references
- C. T. Driscoll, R. P. Mason, H. M. Chan, D. J. Jacob and N. Pirrone, Environ. Sci. Technol., 2013, 47, 4967–4983 CrossRef CAS PubMed.
- M. Rex, F. E. Hernandez and A. D. Campiglia, Anal. Chem., 2006, 78, 445–451 CrossRef CAS PubMed.
- H. Huang, C. Qu, X. Liu, S. Huang, Z. Xu, Y. Zhu and P. K. Chu, Chem. Commun., 2011, 47, 6897–6899 RSC.
- A. Singh, R. Pasricha and M. Sastry, Analyst, 2012, 137, 3083–3090 RSC.
- J. Z. James, D. Lucas and C. P. Koshland, Environ. Sci. Technol., 2012, 46, 9557–9562 CrossRef CAS PubMed.
- L. Deng, X. Ouyang, J. Jin, C. Ma, Y. Jiang, J. Zheng, J. Li, Y. Li, W. Tan and R. Yang, Anal. Chem., 2013, 85, 8594–8600 CrossRef CAS PubMed.
- J. R. Crockett, H. Win-Piazza, J. E. Doebler, T. Luan and Y. Bao, ACS Appl. Nano Mater., 2021, 4, 1654–1663 CrossRef CAS.
- I. Ojea-Jiménez, X. López, J. Arbiol and V. Puntes, ACS Nano, 2012, 6, 2253–2260 CrossRef PubMed.
- S.-I. Lo, P.-C. Chen, C.-C. Huang and H.-T. Chang, Environ. Sci. Technol., 2012, 46, 2724–2730 CrossRef CAS PubMed.
- S. Pacheco, M. Medina, F. Valencia and J. Tapia, J. Environ. Eng., 2006, 132, 342–349 CrossRef CAS.
- C. Schopf, A. Wahl, A. Martín, A. O'Riordan and D. Iacopino, J. Phys. Chem. C, 2016, 120, 19295–19301 CrossRef CAS.
- C. Novo, A. M. Funston and P. Mulvaney, Nat. Nanotechnol., 2008, 3, 598–602 CrossRef CAS PubMed.
- C. Schopf, A. Martín, M. Schmidt and D. Iacopino, J. Mater. Chem. C, 2015, 3, 8865–8872 RSC.
- C. Novo, A. M. Funston, A. K. Gooding and P. Mulvaney, J. Am. Chem. Soc., 2009, 131, 14664–14666 CrossRef CAS PubMed.
- B. S. Hoener, H. Zhang, T. S. Heiderscheit, S. R. Kirchner, A. S. De Silva Indrasekara, R. Baiyasi, Y. Cai, P. Nordlander, S. Link, C. F. Landes and W.-S. Chang, J. Phys. Chem. Lett., 2017, 8, 2681–2688 CrossRef CAS PubMed.
- B. S. Hoener, C. P. Byers, T. S. Heiderscheit, A. S. De Silva Indrasekara, A. Hoggard, W.-S. Chang, S. Link and C. F. Landes, J. Phys. Chem. C, 2016, 120, 20604–20612 CrossRef CAS.
- J.-G. Wang, J. S. Fossey, M. Li, T. Xie and Y.-T. Long, ACS Appl. Mater. Interfaces, 2016, 8, 8305–8314 CrossRef CAS PubMed.
- J. Lee, G. W. Kim and J. W. Ha, Analyst, 2022, 147, 1066–1070 RSC.
- G. W. Kim and J. W. Ha, J. Phys. Chem. Lett., 2022, 13, 2607–2613 CrossRef CAS PubMed.
- T. Morris, K. Kloepper, S. Wilson and G. Szulczewski, J. Colloid Interface Sci., 2002, 254, 49–55 CrossRef CAS PubMed.
- H. B. Jeon, S. Park, K. R. Ryu, S. K. Ghosh, J. Jung, K. M. Park and J. W. Ha, Chem. Sci., 2021, 12, 7115–7124 RSC.
- S. Y. Lee, P. V. Tsalu, G. W. Kim, M. J. Seo, J. W. Hong and J. W. Ha, Nano Lett., 2019, 19, 2568–2574 CrossRef CAS PubMed.
- S. W. Moon, P. V. Tsalu and J. W. Ha, Phys. Chem. Chem. Phys., 2018, 20, 22197–22202 RSC.
- K. R. Ryu, D. H. Nam, S. Lee and J. W. Ha, J. Phys. Chem. C, 2020, 124, 14818–14825 CrossRef CAS.
- C. Novo, D. Gomez, J. Perez-Juste, Z. Zhang, H. Petrova, M. Reismann, P. Mulvaney and G. V. Hartland, Phys. Chem. Chem. Phys., 2006, 8, 3540–3546 RSC.
- A. M. Brown, M. T. Sheldon and H. A. Atwater, ACS Photonics, 2015, 2, 459–464 CrossRef CAS.
- S. Oikawa, H. Minamimoto, X. Li and K. Murakoshi, Nanotechnology, 2017, 29, 045702 CrossRef PubMed.
- H. Minamimoto, S. Oikawa, T. Hayashi, A. Shibazaki, X. Li and K. Murakoshi, J. Phys. Chem. C, 2018, 122, 14162–14167 CrossRef CAS.
- A. Henkel, A. Jakab, G. Brunklaus and C. Sönnichsen, J. Phys. Chem. C, 2009, 113, 2200–2204 CrossRef CAS.
- S. Oikawa, H. Minamimoto and K. Murakoshi, Chem. Lett., 2017, 46, 1148–1150 CrossRef CAS.
Footnote |
| † Electronic supplementary information (ESI) available. See DOI: https://doi.org/10.1039/d2an00559j |
| This journal is © The Royal Society of Chemistry 2022 |

