 Open Access Article
Creative Commons Attribution 3.0 Unported Licence
Tailoring morphology of hierarchical catalysts for tuning pore diffusion behaviour: a rational guideline exploiting bench-top pulsed-field gradient (PFG) nuclear magnetic resonance (NMR)†
Luke
Forster
 a,
Michal
Lutecki
b,
Henrik
Fordsmand
b,
Le
Yu
a and
Carmine
D'Agostino
 *a
*a
aDepartment of Chemical Engineering and Analytical Science, The University of Manchester, Oxford Road, Manchester, M13 9PL, UK. E-mail: carmine.dagostino@manchester.ac.uk
bHaldor Topsøe A/S, Haldor Topsøes Allé 1, DK-2800, Kongens Lyngby, Denmark
First published on 28th May 2020
Abstract
The aim of this work is to develop and quantify the tuning of transport properties in porous catalytic materials by tailoring their textural properties. In order to do this, alumina catalyst carriers were prepared from boehmite by varying preparation conditions to produce carriers with different pore sizes and macropore content. Pore size and macropore content decreased with boehmite mixing time and increased with calcination temperature due to alumina phase transformations occurring. Mass transport within the different materials was studied by pulsed-field gradient NMR diffusion techniques, with a low-field, bench-top NMR instrument, using n-octane as the probe molecule. The diffusion results revealed that mass transport occurs more readily in carriers with greater pore size and macropore content, by providing a comprehensive and quantitative description of this behaviour. In particular, up to a pore size of 17.0 nm diffusion increases very rapidly with pore size; at pore sizes greater than 17.0 nm and macropore content greater than 27% the major geometrical restrictions imposed by the pore structure on the probe molecule were removed and the diffusivity of guest molecules reaches a constant plateau, suggesting that a pore size greater than 17.0 nm and a macropore content greater than 27% do not lead to significant further improvements in mass transport properties. Diffusion studies using water, methanol and ethanol, as probe molecules with functional hydroxyl groups able to interact with the surface, showed that in samples with small pores and no amount of macropores, surface interactions of these guest molecules with the pore surface have a significant effect on determining the diffusive motion, in addition to the effect of the physical pore structure. For larger pores and larger macropore content, the surface chemistry of the pore walls has a much smaller impact on the diffusive motion inside the porous matrix. This work gives a comprehensive and quantitative overview on how to tailor carrier preparation procedures in order to tune mass transport, providing a rational guideline with important implications in design, preparation and applications of porous materials.
Design, System, ApplicationDesign of pore structures with tuned molecular transport properties for specific applications is key in many fields of science and technology, in particular heterogeneous catalysis, whereby diffusion of molecular species involved in the reaction may significantly affect the overall reaction rate and catalyst performances. Despite the importance of this aspect, relatively few studies on the topic exist and a systematic study able to achieve tailoring of pore structure with tuned diffusion properties has not been reported. In this work, we provide a systematic study that provides a rational guideline for preparing solid catalytic materials with tuned molecular diffusion properties and we show how pore size and macropore content affect molecular diffusion of probe molecules inside the pore space. We show that up to a certain pore size a significant increase of molecular diffusion is observed; after this cut-off pore size, further increase of pore size only leads to a very small increase in molecular diffusion. This finding is important as for achieving larger pore sizes more energy intensive preparation procedures are needed, hence an important implication of this study is on improving sustainability in catalyst manufacturing by using less energy-intensive processes. We believe this work will serve as an important tool for the design of porous materials and catalysts with tuned molecular diffusion. |
Introduction
The development of catalytic materials with suitable textural properties is essential to achieving high activity,1 selectivity2 and reusability3 in catalytic processes. One example of where control of the textural properties of the catalyst is required can be seen in hydrotreating desulfurization processes, that is, the removal of sulphur from natural gas or refined petroleum products.4 For example, in upstream hydrotreating of diesel, when alumina is used as a catalyst, a high surface area and relatively small pores (ca. 4 nm) are desired for high activity.5 For analogous downstream processes, such as heavy vacuum gas oil or resid hydrotreating, larger pores (ca. 7–13 nm)6,7 are required to allow diffusion and access of larger molecules to the catalyst active sites. Conversely, certain highly selective processes such as the partial epoxidation of ethylene to ethylene oxide8,9 and the selective oxidation or selective hydrogenation of acetylene10 require catalysts with large pores and low surface areas. This acts to limit the residence time of substrate on the catalyst, thereby boosting selectivity to the desired products by limiting further reactions on the catalyst surface.11,12 The importance of controlling the textural properties of a catalyst can also be seen in the design of hierarchical zeolites. In such materials, an additional pore system is introduced to the zeolite crystal, aiming at alleviating mass transport limitations imposed by the zeolite micropores.13 Many studies have investigated the tuning of textural properties of both catalysts and catalyst supports, including carbon materials,14–16 zeolites,17,18 silicas,19,20 titanias21 and aluminas,22–24 which are all commonly used as supports for catalytic materials.Mass transport and textural properties are widely known to be highly inter-related; in particular, tailoring pore structures in order to modify diffusion properties is an aspect of high relevance in the field of heterogeneous catalysis. For example, the importance of such a relationship has been reported to play a role in zeolite catalysis during acetalization reaction. In this process, the observed increase in catalytic activity of hierarchically structured Y zeolites with introduced mesoporosity was attributed to the enhanced diffusion of guest molecules within the pore matrix relative to the purely microporous parent Y zeolite.25 Such a conclusion was solely based on observations on catalytic conversion measurements as no attempt to quantify diffusion rate inside the pore matrix was made. It is indeed the case that whilst the relationship between textural properties and mass transport is often discussed on qualitative basis, relatively little work has been carried out to systematically investigate the effect of tailoring textural properties of porous catalytic particles on intra-particle diffusion. Previous work has detailed the relationship between pore structure and the overall diffusivity of molecules throughout the respective porous space and how this can then, in turn, affect the catalytic activity of reactions using such catalytic materials.26–28 Therefore, it is clear that a rational overview aimed towards the design of materials with tailored textural properties, and therefore molecular diffusivity through their porous network, is desirable.
A powerful tool to probe diffusion inside porous materials is the pulsed-field gradient (PFG) NMR technique.29–35 Amongst notable work done in the area of zeolites, Kortunov et al.36 have investigated the effect of introducing mesopores in microporous zeolites showing that if the introduced pores form as isolated cavities, little or no increase in diffusion coefficient is observed. Conversely, the formation of a newly formed interconnected pore network is expected to lead to significant changes in diffusion coefficients. Indeed, in a recent work on hierarchical macroporous–mesoporous silica (SBA-15) sulfonic acid catalysts with interconnected macropores of tuneable diameter, it was shown that pore size and connectivity are not mutually exclusive and that enhanced mass transport can be achieved through tailoring the macropore size to the reactant size.37
Whilst this previous work suggests that the introduction of macropores to mesoporous structures enhances mass transport by diffusion, a systematic study looking at the effect of catalyst manufacturing procedures for tailoring textural properties, by introducing macropores, and tuning diffusion properties, has not yet been reported. However, a comprehensive analysis of this would lead to a more rational and guided design of pore structures with certain desirable transport properties. In this work, we carried out a comprehensive and systematic study on how tailoring textural properties of industrial catalytic materials, through various preparation procedures, affects mass transport by diffusion. In particular, we assess the effect of operating conditions in the preparation of hierarchical alumina carriers on the final textural properties of the materials. Low-field, bench-top PFG NMR experiments with different guest probe molecules are then used to quantify how the final textural properties of the materials affect mass transport by diffusion. The advantage of using bench-top NMR instruments is significant as such instruments are much more affordable, compact and easier to operate compared to more traditional high-field instruments. This broadens significantly the application of the methodology both in academia and industry, including catalyst research and development.
Experimental
Materials and chemicals
Methanol and ethanol were supplied by Alfa Aesar, n-octane was supplied by Merck. All chemicals were used as received. Deionised water was obtained from a laboratory water purification system.Carrier preparation
The alumina carriers were supplied by Haldor Topsøe. For their preparation, pseudoboehmite is peptized with nitric acid in water to form a uniform paste that is later extruded and calcined. Upon calcination pseudoboehmite undergoes thermal transformation according to the following chain of reactions:| AlO(OH) → γ-Al2O3 → δ-Al2O3 → θ-Al2O3 → α-Al2O3 |
A number of 8 different samples were investigated denoted as Al2O3 (1)–Al2O3 (8). Carriers were prepared by mixing boehmite powder with water in the presence of nitric acid to obtain 600 g of uniform paste. The amount of nitric acid was set to 10 mmol per 1 mol of alumina on calcined basis for all samples. The amount of water expressed as water-to-boehmite ratio (g/g) varied between samples and was set to 1 for Al2O3 (1)–Al2O3 (4) and 1.18 for Al2O3 (5)–Al2O3 (8). Additionally, Al2O3 (1)–Al2O3 (4) were mixed for 25 minutes, while samples Al2O3 (5)–Al2O3 (8) only for 6 minutes (Table 1). Subsequently, the resulting paste was extruded, dried and calcined at various temperatures and conditions (Table 1). The structural properties of all carriers were studied by Haldor Topsøe using mercury (Hg)-intrusion porosimetry. Samples were dried at 250 °C prior to analysis. Hg-Intrusion measurements were performed on an Autopore IV instrument from Micromeritics.
| Sample | Water-to-boehmite ratio (−) | Mass of nitric acid (g) | Mixing time (min) | Calcination temperature (°C) |
|---|---|---|---|---|
| a Calcined in the furnace on the net (1 cm layer). b Calcined in the furnace in a closed container (5 cm layer). | ||||
| Al2O3 (1) | 1.00 | 2.40 | 25 | 550a (dry) |
| Al2O3 (2) | 1.00 | 2.40 | 25 | 550b (wet) |
| Al2O3 (3) | 1.00 | 2.40 | 25 | 700 (dry) |
| Al2O3 (4) | 1.00 | 2.40 | 25 | 700 (wet) |
| Al2O3 (5) | 1.18 | 1.00 | 6 | 800 (wet) |
| Al2O3 (6) | 1.18 | 1.00 | 6 | 900 |
| Al2O3 (7) | 1.18 | 1.00 | 6 | 1100 |
| Al2O3 (8) | 1.18 | 1.00 | 6 | 1200 |
X-ray diffraction (XRD) measurements
The materials were analyzed by X-ray diffraction using a Panalytical XPert Pro instrument system in Bragg–Brentano geometry working in reflectance mode using CuKα radiation (λ = 1.541 Å). The instrument is equipped with a monochromator, soller-, divergence- and anti-scatter slits with a scan range of 5–70 degrees. Rietveld analysis was carried out using the Topas software.PFG NMR diffusion measurements
The samples for PFG NMR measurements were prepared by soaking the porous solid under investigation in the liquid of choice for over 24 h prior to the measurements in order to ensure full saturation of the intra-particle pore space; different guest molecules (n-octane, water, methanol or ethanol) were used for the study. The liquid-saturated solid samples were then dried on a pre-soaked filter paper to remove any excess liquid from the external surface and transferred to 5 mm NMR tubes. To ensure a saturated atmosphere in the NMR tube, hence minimising errors due to evaporation of volatile liquids, a small amount of the respective pure liquid was absorbed onto filter paper, which was then placed under the cap of the NMR tube. The tube sample was finally placed into the magnet and left for approximately 15 min before starting the measurements, in order to achieve thermal equilibrium. NMR experiments were performed in a Magritek SpinSolve benchtop NMR spectrometer operating at a 1H frequency of 43 MHz. The PFG NMR experiments were carried out using a diffusion probe capable of producing magnetic field gradient pulses up to 163 mT m−1. Diffusion measurements were performed using the pulsed-field gradient stimulated echo (PGSTE) sequence.38 The sequence is made by combining a series of radiofrequency pulses (RF) with magnetic field gradients (g), according to Fig. 1.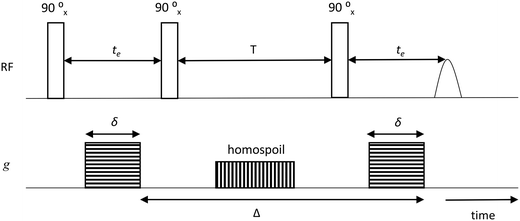 | ||
| Fig. 1 PGSTE pulse sequence showing gradient pulse duration δ, echo time te, storage interval T, homospoil gradient and diffusion time, Δ. | ||
The NMR signal attenuation of a PFG NMR experiment as a function of the gradient strength, E(g), is related to the experimental variables and the diffusion coefficient (D) by:39
 | (1) |
 is often referred to as the b-factor. Eqn (1) assumes a Gaussian distribution of the diffusing spins and it generally applies to free diffusion, such as the case of bulk liquids. However, this equation can also be applied for diffusion in porous materials with a quasi-homogeneous behaviour, that is, with a macroscopically homogeneous pore structure,40 which shows a linear behaviour of the PFG log plot of the signal attenuation.
The measurements were performed by fixing Δ = 50 ms and using values of δ = 4–12 ms depending on the sample. The magnitude of g was varied linearly with sixteen spaced increments. In order to achieve full signal attenuation, maximum values of g of up to 163 mT m−1 were necessary. All the measurements were performed at atmospheric pressure and 25 °C. The diffusion coefficients D were calculated by fitting eqn (1) to the experimental data.
Results and discussion
Effect of alumina preparation conditions upon the carrier textural properties
The alumina samples were prepared as detailed in the experimental section using varying preparation conditions and their impact upon the porous structure of the final alumina sample was determined. The parameters varied in the preparation of the alumina samples can be seen in Table 1.The alumina carriers prepared according to the conditions reported in Table 1 were characterized by mercury porosimetry. The mean pore diameter (dpore), percentage of macropores of varying size within the carrier studied and surface area-to-volume ratio (S/V) were determined and are listed in Table 2.
| Sample | d pore (nm) | Macropores >50 nm (%) | Macropores >200 nm (%) | S/V (m−1 × 10⁻⁷) |
|---|---|---|---|---|
| Al2O3 (1) | 8.0 ± 0.2 | 2 | 1 | 49.7 |
| Al2O3 (2) | 9.2 ± 0.3 | 2 | 1 | 43.7 |
| Al2O3 (3) | 10.4 ± 0.3 | 2 | 1 | 38.4 |
| Al2O3 (4) | 11.8 ± 0.4 | 2 | 1 | 34.0 |
| Al2O3 (5) | 17.0 ± 0.5 | 25 | 21 | 23.6 |
| Al2O3 (6) | 22.4 ± 0.7 | 27 | 23 | 17.8 |
| Al2O3 (7) | 53.6 ± 1.6 | 67 | 32 | 7.5 |
| Al2O3 (8) | 201.6 ± 6.0 | 99 | 62 | 2.0 |
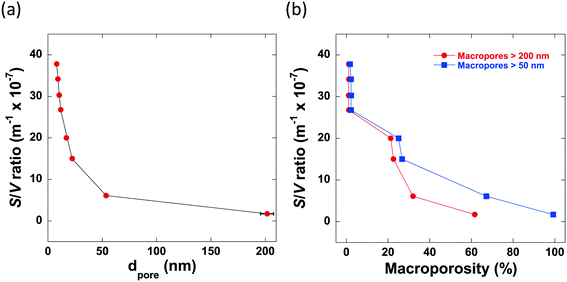
From the mercury porosimetry analysis, it can be seen that the samples studied contain a wide variety of average pore sizes, degrees of macroporosity and surface area-to-volume ratios. From the results obtained, it is clear to see that there are 2 main factors which significantly influence the pore structure of the alumina produced: the mixing time, tmix, and the calcination temperature. It can be seen that those samples with a significantly longer tmix contain no macropores within their pore structures, for example, Al2O3 (4) and Al2O3 (5) are both calcined at 700 °C but mixed for differing lengths of time. Al2O3 (4) is mixed for 25 minutes and only 2% of macropores with a mean pore diameter >50 nm whereas Al2O3 (5) is mixed for only 6 minutes resulting in a final alumina carrier containing 25% macropores with a mean pore diameter >50 nm. In general, the average pore size increases as macroporosity increases and in turn, these factors reduce the overall surface area-to-volume ratio, as shown in Fig. 2.
It must be considered that the surface area-to-volume ratio (S/V) of a porous particle is complex in nature and is dependent upon many factors including the porosity, shape, size and roughness of a specific particle in addition to the pore size distribution. However, the results of the mercury porosimetry analysis show that, for the samples being studied, S/V is significantly influenced by both the presence of macroporosity and the average pore size. In particular, both a low average pore size and degree of macroporosity is essential for preparing high surface area-to-volume ratio alumina carriers.
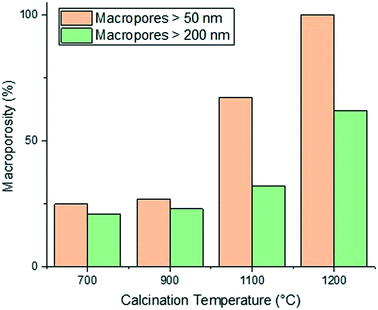
The calcination temperature is also seen to significantly affect the final pore structure of the alumina carriers. Al2O3 (5)–Al2O3 (8) were all prepared by mixing for a relatively short mixing time of 6 minutes resulting in the formation of macropores. Each of these alumina carriers containing macroporosity were then subject to calcination at varying temperatures. The effect of varying calcination temperature upon the final macropore content within the aluminas mixed for 6 minutes only can be seen in Fig. 3.
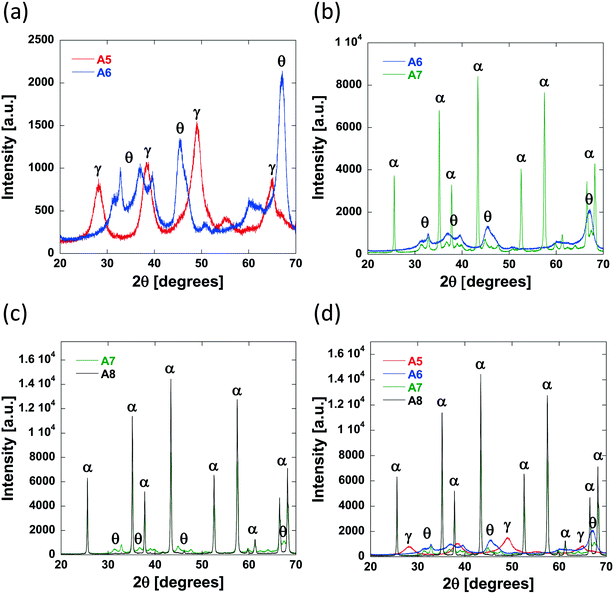
As the calcination temperature is increased, the alumina particles will begin to sinter, forming bigger alumina particles and eventually inducing phase transformations causing the collapse of small pores and resulting in the formation of large mesopores and macropores.41 At temperatures below 900 °C, phase transformations do not occur and the carriers are composed of γ-Al2O3 only. At 900 °C, γ-Al2O3 particles begin to sinter and transition partly to θ-Al2O3 and above 900 °C, the carriers are composed solely of θ-Al2O3 and α-Al2O3. The phase transformations that occur result in changes to the textural properties of the resultant carriers, specifically dpore and the percentage of macropores within the samples increases whilst the surface area decreases. As such, the samples prepared using a calcination temperature less than 900 °C (Al2O3 (1)–Al2O3 (5)) will be composed of γ-Al2O3 only. This is confirmed from the XRD analysis of Al2O3 (5) (Fig. 4a) showing peaks characteristic of γ-Al2O3.42,43
As the preparation calcination temperature is increased from 800 °C to 900 °C (Al2O3 (5) to Al2O3 (6), Fig. 4a) peaks indicative of the presence of θ-Al2O3![[thin space (1/6-em)]](https://www.rsc.org/images/entities/char_2009.gif) 44 appear confirming that phase transformations are taking place and are therefore responsible for the change in textural properties seen. As the calcination temperature is increased further, from 900 °C for Al2O3 (6) to 1100 °C and 1200 °C in Al2O3 (7) and Al2O3 (8), respectively, it can be seen that the θ-Al2O3 peaks disappear and sharper more intense peaks appear in their place, which are indicative of the presence of α-Al2O3,45 the most thermally stable of the alumina phases.
44 appear confirming that phase transformations are taking place and are therefore responsible for the change in textural properties seen. As the calcination temperature is increased further, from 900 °C for Al2O3 (6) to 1100 °C and 1200 °C in Al2O3 (7) and Al2O3 (8), respectively, it can be seen that the θ-Al2O3 peaks disappear and sharper more intense peaks appear in their place, which are indicative of the presence of α-Al2O3,45 the most thermally stable of the alumina phases.
PFG NMR studies: effect of pore network connectivity on self-diffusion
We now turn our attention to how the textural properties of the final carrier, determined by the different operating conditions in the preparation methods, influence mass transport within the pore structure. One important parameter to assess is the tortuosity, which is a structural property of the porous matrix defining the pore connectivity; knowledge of this parameter is important as values of tortuosity are highly desirable as input parameters for modelling and molecular simulations of mass transport within porous materials.46 The tortuosity is, in theory, a function of the pore structure only and can be calculated using PFG NMR. Taking the ratio of the free bulk liquid diffusivity, D0, to the effective diffusivity of the liquid within the porous material, Deff, gives a dimensionless “PFG interaction parameter”, ξ.47 This relation is shown in eqn (2): | (2) |
 | (3) |
| τ ≡ ξAlkanes | (4) |
To probe the tortuosity of the samples studied here we have used n-octane. Previous studies have demonstrated that short chain liquid alkanes, namely n-octane, n-decane and cyclohexane, give reliable values of τ regardless of molecular dimension size.40 A typical PFG NMR decay plot using n-octane imbibed within an alumina pellet used in this study can be seen below in Fig. 5.
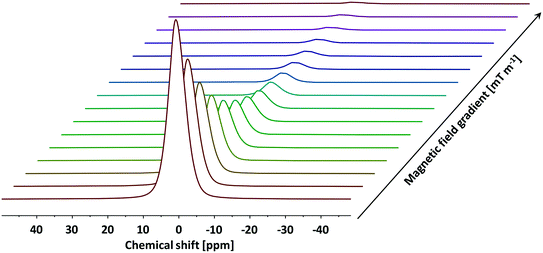 | ||
| Fig. 5 A typical PFG NMR decay plot of n-octane imbibed within Al2O3 (1) obtained using the PGSTE pulse sequence. Self-diffusion coefficients were obtained by fitting the log attenuations to eqn (1). Data collected at atmospheric pressure and 25 °C. | ||
The log attenuation plots of n-octane imbibed within pellets of the alumina carriers under study can be seen in Fig. 6. The experimental data were fitted using eqn (1), giving a straight line when plotted on a logarithmic scale. Diffusion coefficients were determined by taking the negative value of the respective slopes.
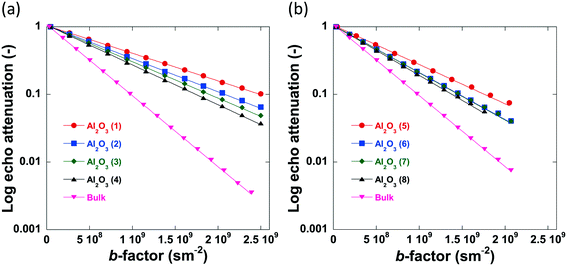 | ||
| Fig. 6 Log attenuation plots of n-octane imbibed within (a) Al2O3 (1)–Al2O3 (4) and (b) Al2O3 (5)–Al2O3 (8). Solid lines are fitting to eqn (1). Data collected at atmospheric pressure and 25 °C. | ||
No evident curvature is seen in the log attenuation plots indicating that the behaviour is quasi-homogeneous.50 This behaviour is usually observed for porous materials with a macroscopically homogeneous pore structure when the root mean squared displacement (RMSD) of the diffusing species is much larger than the average pore size of the sample, i.e., the probe molecule will collide with the pore walls many times. As a result, Deff will be representative of the liquid confined within the porous medium and reduced by the tortuosity factor relative to the free bulk liquid.50 The RMSD of molecules diffusing for a given observation time, t, is defined by:
 | (5) |
The smallest RMSD for the measurements with n-octane (see Table S1 in ESI†) was probed when investigating the tortuosity of Al2O3 (1) and this was equal to 9.7 μm, much larger than the largest average pore size of the samples studied (201.6 nm), confirming our hypothesis. The quasi-homogeneous diffusion behaviour reported for our samples have important implications in terms of industrial scale-up of carrier preparation as it indicates that the preparation method reported here gives carrier particles with a uniform pore structure.
The numerical values of the self-diffusion coefficients obtained from the PFG NMR data depicted in Fig. 6 are shown in Table 3.
| Sample | D eff (m2 s−1 × 10¹⁰) | τ (—) |
|---|---|---|
| Al2O3 (1) | 9.41 ± 0.28 | 2.57 ± 0.08 |
| Al2O3 (2) | 11.13 ± 0.33 | 2.17 ± 0.07 |
| Al2O3 (3) | 12.42 ± 0.37 | 1.95 ± 0.06 |
| Al2O3 (4) | 13.56 ± 0.41 | 1.78 ± 0.05 |
| Al2O3 (5) | 13.40 ± 0.40 | 1.81 ± 0.05 |
| Al2O3 (6) | 16.03 ± 0.48 | 1.51 ± 0.05 |
| Al2O3 (7) | 16.13 ± 0.48 | 1.50 ± 0.05 |
| Al2O3 (8) | 17.00 ± 0.51 | 1.42 ± 0.04 |
| Bulk | 24.14 ± 0.72 | — |
As the tortuosity is a measure of the pore connectivity and is therefore a function of the pore structure of the porous materials under study, it seems appropriate to evaluate this parameter as a function of the average pore size of the alumina carriers; despite tortuosity, which measures pore connectivity, and pore size are in theory independent of each other, previous work has reported that these two parameters can be inter-related51 and that larger pores tend to enhance pore network connectivity, hence enhance the rate of diffusion of the probe molecule within the porous structure.
Fig. 7 reports the values of self-diffusivity of n-octane and corresponding tortuosity values for the alumina samples studied here as a function of the average pore diameter.
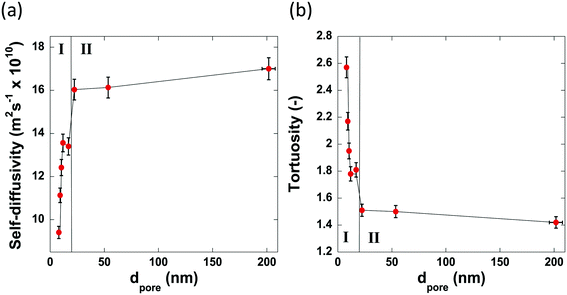 | ||
| Fig. 7 The pore size dependence of (a) the self-diffusivity of n-octane imbibed within the pores of the alumina carriers and (b) the calculated tortuosity values. | ||
The values of tortuosity reported in this work were found to be of a similar value to those reported in the literature for the same guest molecules within similar porous materials.52,53 Both the self-diffusivity and tortuosity values show a strong dependence upon the average pore diameter at low values of pore size. The self-diffusivity of n-octane increases drastically upon increasing the pore size from 8.0 nm to 17.0 nm. At average pore sizes higher than 17.0 nm the self-diffusivity no longer increases with increasing pore size and becomes constant, within error, at roughly 1.65 × 10⁻⁹ m2 s−1 when pore sizes are greater than 17.0 nm. Clearly, it is reasonable to group the samples studied in this work into 2 groups based on these results. Those with small (up to 17.0 nm) average pore sizes and those with relatively ‘large’ pore sizes, that is, those with pore sizes greater than 17.0 nm. These groupings are indicated in Fig. 7 by the regions I and II representing the small and relatively large pore size samples, respectively. These results can be explained as a molecular confinement effect due to the small size of the pores. At the low pore size of 8.0 nm, the n-octane molecules are highly confined and will be subject to many collisions with the pore walls. As the pore size is increased, some of this restriction is lifted; hence, molecules are relatively freer to move and as such collide with the pore walls less and therefore exhibiting a larger RMSD, hence faster diffusion. When the pore size is large (dpore > 17.0 nm), the level of confinement is further decreased, which further increases the RMSD and hence the average self-diffusivity. As the tortuosity is effectively proportional to the inverse of the self-diffusivity the same trend is seen but with the tortuosity decreasing as pore size increases, as would be expected. In summary, the results reported in Fig. 7 clearly demonstrate that larger pores ensure a better pore network connectivity, hence a lower tortuosity.
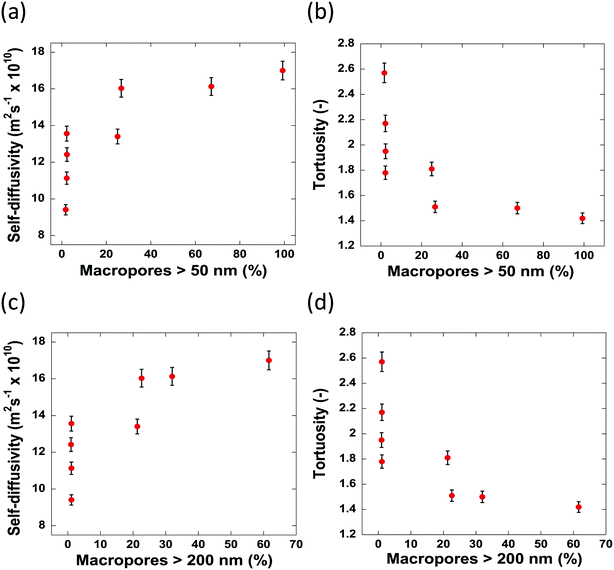
Due to the pore size dependence of both the diffusivity and tortuosity of the samples studied in this work, it is important to consider also the contribution of the relative proportions of macropores present within the samples in determining the average pore size. Fig. 8 reports the values of self-diffusivity as a function of the macropore percentage. It can be seen that in general, a greater percentage of macropores present within a sample aids mass transport and decrease tortuosity, hence improving pore network connectivity, possibly by providing wider, less restricted pathways through which molecules can diffuse. Wider pores will inevitably result in less collisions with the pore walls and therefore molecules will diffuse faster within the porous structure.
The samples possessing no macropores with a radius greater than 50 nm, show differing values of diffusivity and tortuosity. As there are little to no macropores present in these samples, the value of diffusivity measured is influenced solely by the average pore sizes. Indeed, this is evidenced as, of the samples containing no macropores, the slowest self-diffusivity value of 9.41 × 10⁻¹⁰ m2 s−1 is observed in Al2O3 (1) with an average pore size of 8.0 nm. Al2O3 (2)–Al2O3 (4) also possess no macropores but show faster self-diffusivity values owing to their larger pore sizes. Therefore, it is reasonable to conclude that, for samples containing a similar macropore content, the diffusivity is determined by the restrictions imposed upon the guest molecules due to the average size of the pores.
When the carriers contain between 0–27% of macropores with a radius greater than 50 nm, the diffusivity increases/tortuosity decreases as the contribution of the macropore diffusivity to the overall mass transport processes taking place becomes significant. Carrier samples containing more than 27% of macropores with a radius greater than 50 nm show no significant increase in diffusivity indicating that at 27% macroporosity the main transport route is through the macropores.
When the percentage of macropores with a radius greater than 200 nm are considered, a similar trend is observed. Therefore, it is reasonable to conclude that, for the samples studied here, a macropore radius of 50 nm is sufficient to alleviate any restriction upon guest molecules, allowing n-octane to diffuse faster with less geometrical restrictions imposed by the porous network. Despite the obvious interlinked relationship between the percentage of large macropores and the average pore diameter seen within the samples, it is important to consider how both factors impact the mass transport of guest molecules throughout the entire porous network.
PFG NMR studies: effect of pore surface chemistry on self-diffusion
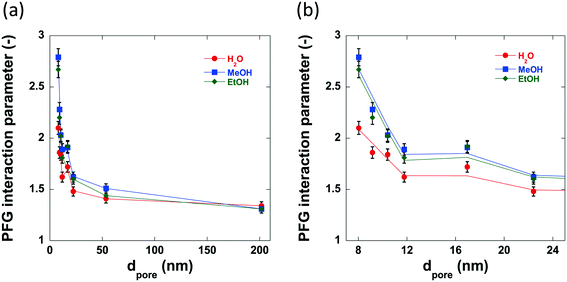
The previously discussed ‘PFG interaction parameter’ ξ, can be used to determine the effect of the surface chemistry and subsequent surface interactions upon the self-diffusivity of guest molecules imbibed within the pores of a given porous material.47,49 The PFG interaction parameters determined using water, methanol and ethanol are shown in Table 4 and the variation in these values with increasing pore size can be seen in Fig. 9. The log attenuation plots of water, methanol and ethanol imbibed within pellets of the alumina carriers under study can be seen in Fig. S1–S3 in ESI.† Hydrogen bonding between molecules with appropriate functional groups and surface hydroxyl groups on a catalyst surface are thought to be significant interactions in adsorption and desorption in catalytic processes54 and can contribute to solvent effects55,56 resulting in changes in catalytic activity.| Sample | ξ Water (—) | ξ Methanol (—) | ξ Ethanol (—) | τ (—) |
|---|---|---|---|---|
| Al2O3 (1) | 2.10 ± 0.06 | 2.79 ± 0.08 | 2.67 ± 0.08 | 2.57 ± 0.08 |
| Al2O3 (2) | 1.86 ± 0.06 | 2.28 ± 0.07 | 2.20 ± 0.07 | 2.17 ± 0.07 |
| Al2O3 (3) | 1.84 ± 0.06 | 2.03 ± 0.06 | 2.02 ± 0.06 | 1.95 ± 0.06 |
| Al2O3 (4) | 1.62 ± 0.05 | 1.89 ± 0.06 | 1.81 ± 0.05 | 1.78 ± 0.05 |
| Al2O3 (5) | 1.72 ± 0.05 | 1.91 ± 0.06 | 1.92 ± 0.06 | 1.81 ± 0.05 |
| Al2O3 (6) | 1.48 ± 0.04 | 1.62 ± 0.05 | 1.60 ± 0.05 | 1.51 ± 0.05 |
| Al2O3 (7) | 1.41 ± 0.04 | 1.51 ± 0.05 | 1.44 ± 0.04 | 1.50 ± 0.05 |
| Al2O3 (8) | 1.64 ± 0.04 | 1.31 ± 0.04 | 1.31 ± 0.04 | 1.42 ± 0.04 |
The PFG interaction parameter, ξ, generally decreases for all three molecules imbibed within the alumina carriers. This effect can be attributed to changes in structural properties, in particular it is due to the reduced restriction of the guest molecules within the carrier pores resulting in less collisions with the pore walls and therefore a faster diffusivity. However, there are significant differences between the values of ξ for water, methanol and ethanol diffusing within the small pore size samples; conversely, the medium to large pore size samples (dpore > 17.0 nm) show very similar values of ξ (between 1.3–1.6) regardless of probe molecule used. Within the structure of the small pore size samples there is a relatively high concentration of guest molecules close to the pore wall and thereby the diffusivity will be significantly affected by interactions of the guest molecules with the pore surface, meaning that those molecules interacting more strongly with the surface will diffuse more slowly. This is consistent with recently reported results on alcohol diffusion in mesoporous silica.57 In the larger pore size samples, there is a much higher concentration of bulk liquid diffusing in the pore volume as opposed to that at the surface, and therefore, surface interactions will have a lower impact on the diffusivity. Intriguingly, water confined within the pores of Al2O3 (1)–Al2O3 (7) show lower values of interaction parameter than the respective tortuosity values obtained using n-octane indicating an ‘enhanced’ diffusivity of water relative to n-octane confined within the same network of pores, a property that has been previously detailed for various polyols confined within TiO2, SiO2 and γ-Al2O3 carriers.49,58 This property is attributed to the disruption of the extensive hydrogen bonding networks between polyol molecules by the porous medium and recent work has confirmed this as well as demonstrating the importance of pore saturation to measuring accurate values of diffusivity in similar systems.58 However, further discussion of this phenomenon is beyond the scope of this work.
Conclusions
In this paper, alumina carriers with differing textural properties were prepared under different operating conditions. Among the conditions varied during the preparation, two main parameters, specifically, mixing time and calcination temperature, were changed. Mercury porosimetry analysis confirmed that longer mixing times resulted in smaller average pore sizes and a lower percentage of macropores present in the aluminas produced. Higher calcination temperatures were found to trigger phase transitions of the alumina thereby resulting in the alumina samples produced to have larger average pore sizes and to contain a higher percentage of macropores. It is clear that the textural properties of the alumina carriers can be easily controlled and effectively tailored to form structures with optimal pore characteristics required for specific applications by simply varying the preparation conditions.A comprehensive set of PFG NMR studies using n-octane to probe the effect of textural properties of the prepared carriers confirmed that, up to an average pore size of 17.0 nm, the diffusivity of n-octane increases rapidly with the average pore size. When alumina samples with larger pore sizes were analysed, diffusivity was only slightly higher, reaching a plateau with increasing pore size suggesting that a pore size greater than 17.0 nm is sufficient to alleviate the major restrictions on the probe molecules motion. When alumina samples containing no macroporosity were analysed, the probe molecule diffusivity was determined only by the average pore size of the sample. However, probe molecule diffusivity was found to increase as the percentage of macropores within the sample increased. When the samples contained approximately 27% macroporosity or above, the probe molecule diffusivity remained constant suggesting that 27% macroporosity is sufficient to alleviate any mass transport limitations due to geometrical restriction of the probe molecule within the pore structure of the carriers.
In order to study the effect of the pore surface chemistry on diffusion, PFG NMR studies using water, methanol and ethanol were conducted. The results revealed that, for the samples with low average pore size and low macropore content, surface interactions between the probe molecules and the pore surface are significant in determining the diffusivity through the pore structure; conversely, for samples with much larger pore size and macropore content, surface interactions have little effect on determining the diffusive motion of guest molecules.
In summary, the study reported here highlights in a very comprehensive and quantitative manner the role of pore size and macropore content on mass transport by diffusion in macroporous–mesoporous catalytic materials. The reported methodology and results, obtained with a bench-top NMR instrument, which is recently increasing accessibility to NMR techniques for the wider scientific academic and industrial communities, may serve as a guideline for tailoring textural properties of porous materials through adopting suitable operating conditions in the preparation procedure, which can lead to pore structures with tuned diffusion properties. We believe that this work will provide a useful tool for those working in the area of catalyst preparation, physical chemistry of porous materials and their applications.
Conflicts of interest
There are no conflicts to declare.Acknowledgements
Carmine D'Agostino would like to acknowledge the EPSRC New Investigator Award (EP/S019138/1) for supporting his research activities.References
- J. Aguado, D. P. Serrano, J. M. Escola and A. Peral, J. Anal. Appl. Pyrolysis, 2009, 85, 352–358 CrossRef CAS.
- E. Ghedini, F. Menegazzo, M. Signoretto, M. Manzoli, F. Pinna and G. Strukul, J. Catal., 2010, 273, 266–273 CrossRef CAS.
- D. P. Serrano, J. Aguado, J. M. Rodriguez and A. Peral, J. Anal. Appl. Pyrolysis, 2007, 79, 456–464 CrossRef CAS.
- I. V. Babich and J. A. Moulijn, Fuel, 2003, 82, 607–631 CrossRef CAS.
- H. Wang, Q. Fan, Z. D. Yang, S. Y. Tang, J. Y. Chen and Y. Wu, Mol. Catal., 2019, 468, 1–8 CrossRef CAS.
- S. Badoga, A. Ganesan, A. K. Dalai and S. Chand, Catal. Today, 2017, 291, 160–171 CrossRef CAS.
- P. P. Minaev, M. S. Nikulshina, L. A. Gulyaeva, O. L. Ovsienko, V. A. Khavkin, O. I. Shmel'kova and P. A. Nikulshin, Pet. Chem., 2017, 57, 1161–1164 CrossRef CAS.
- D. M. Minahan, G. B. Hoflund, W. S. Epling and D. W. Schoenfeld, J. Catal., 1997, 168, 393–399 CrossRef CAS.
- S. Adhami, M. N. Esfahany, K. Eranen, M. Peurla, E. Makila, D. Y. Murzin and T. Salmi, J. Chem. Technol. Biotechnol., 2019, 94(12), 3839–3849 CrossRef CAS.
- M. T. Ravanchi, S. Fadaeerayeni and M. R. Fard, Res. Chem. Intermed., 2016, 42, 4797–4811 CrossRef.
- C. F. Mao and M. A. Vannice, Appl. Catal., A, 1995, 122, 61–76 CrossRef CAS.
- H. Kanoh, T. Nishimura and A. Ayame, J. Catal., 1979, 57, 372–379 CrossRef CAS.
- L. H. Chen, X. Y. Li, J. C. Rooke, Y. H. Zhang, X. Y. Yang, Y. Tang, F. S. Xiao and B. L. Su, J. Mater. Chem., 2012, 22, 17381–17403 RSC.
- S. Mezzavilla, C. Baldizzone, K. J. J. Mayrhofer and F. Schuth, ACS Appl. Mater. Interfaces, 2015, 7, 12914–12922 CrossRef CAS PubMed.
- Y. W. Shi, X. W. Zhang and G. Z. Liu, Fuel, 2015, 158, 565–571 CrossRef CAS.
- J. Du, L. Liu, B. B. Liu, Y. F. Yu, H. J. Lv and A. B. Chen, Carbon, 2019, 143, 467–474 CrossRef CAS.
- S. S. Zhuang, Z. J. Hu, L. Huang, F. Qin, Z. Huang, C. Sun, W. Shen and H. L. Xu, Catal. Commun., 2018, 114, 28–32 CrossRef CAS.
- Q. Gao, Y. Zhang, K. D. Zhou, H. D. Wu, J. Guo, L. F. Zhang, A. J. Duan, Z. Zhao, F. Q. Zhang and Y. X. Zhou, RSC Adv., 2018, 8, 28879–28890 RSC.
- R. P. Liu and C. A. Wang, Ceram. Int., 2015, 41, 1101–1106 CrossRef CAS.
- L. Y. Jaramillo, K. Arango-Benitez, W. Henao, E. Vargas, G. Recio-Sanchez and M. Romero-Saez, Mater. Lett., 2019, 257, 126749 CrossRef CAS.
- R. P. Liu, F. Ren, W. M. Su, P. He, C. Shen, L. Zhang and C. A. Wang, Ceram. Int., 2015, 41, 14615–14620 CrossRef CAS.
- R. Feng, X. Y. Hu, X. L. Yan, Z. F. Yan and M. J. Rood, Microporous Mesoporous Mater., 2017, 241, 89–97 CrossRef CAS.
- B. Gu, S. B. He, X. Rong, Y. Shi and C. L. Sun, Catal. Lett., 2016, 146, 1415–1422 CrossRef CAS.
- Y. F. Li, J. J. Su, J. H. Ma, F. Yu and R. F. Li, Mater. Lett., 2015, 153, 165–167 CrossRef CAS.
- W. Q. Jiao, W. H. Fu, X. M. Liang, Y. M. Wang and M.-Y. He, RSC Adv., 2014, 4, 58596–58607 RSC.
- Z. Liu, X. Yi, G. Wang, X. Tang, G. Li, L. Huang and A. Zheng, J. Catal., 2019, 369, 335–344 CrossRef CAS.
- S. Gao, Z. Liu, S. Xu, A. Zheng, P. Wu, B. Li, X. Yuan, Y. Wei and Z. Liu, J. Catal., 2019, 377, 51–62 CrossRef CAS.
- Z. Liu, Y. Chu, X. Tang, L. Huang, G. Li, X. Yi and A. Zheng, J. Phys. Chem. C, 2017, 121, 22872–22882 CrossRef CAS.
- S. Kolitcheff, E. Jolimaitre, A. Hugon, J. Verstraete, M. Rivallan, P. L. Carrette, F. Couenne and M. Tayakout-Fayolle, Catal. Sci. Technol., 2018, 8, 4537–4549 RSC.
- A. Galarneau, F. Guenneau, A. Gedeon, D. Mereib, J. Rodriguez, F. Fajula and B. Coasne, J. Phys. Chem. C, 2016, 120, 1562–1569 CrossRef CAS.
- J. Kärger, R. Valiullin, D. Enke and R. Glaser, Mesoporous Zeolites, 2015, 385–423 Search PubMed.
- M. Goepel, H. Kabir, C. Kuster, E. Saraci, P. Zeigermann, R. Valiullin, C. Chmelik, D. Enke, J. Kärger and R. Glaser, Catal. Sci. Technol., 2015, 5, 3137–3146 RSC.
- D. H. Tang, C. Kern and A. Jess, Appl. Catal., A, 2004, 272, 187–199 CrossRef CAS.
- G. Di Carmine, D. Ragno, A. Massi and C. D'Agostino, Org. Lett., 2020 DOI:10.1021/acs.orglett.0c01188.
- Y. Jiao, L. Forster, S. Xu, H. Chen, J. Han, X. Liu, Y. Zhou, J. Liu, J. Zhang, J. Yu, C. D'Agostino and X. Fan, Angew. Chem., Int. Ed. DOI:10.1002/anie.202002416.
- P. Kortunov, S. Vasenkov, J. Kärger, R. Valiullin, P. Gottschalk, M. F. Elia, M. Perez, M. Stocker, B. Drescher, G. McElhiney, C. Berger, R. Glaser and J. Weitkamp, J. Am. Chem. Soc., 2005, 127, 13055–13059 CrossRef CAS PubMed.
- M. A. Isaacs, N. Robinson, B. Barbero, L. J. Durndell, J. C. Manayil, C. M. A. Parlett, C. D'Agostino, K. Wilson and A. F. Lee, J. Mater. Chem. A, 2019, 7, 11814–11825 RSC.
- E. O. Stejskal and J. E. Tanner, J. Chem. Phys., 1965, 42, 288–292 CrossRef CAS.
- E. O. Stejskal, J. Chem. Phys., 1965, 43, 3597–3606 CrossRef.
- C. D'Agostino, J. Mitchell, L. F. Gladden and M. D. Mantle, J. Phys. Chem. C, 2012, 116, 8975–8982 CrossRef.
- H. Schaper, E. B. M. Doesburg, P. H. M. Dekorte and L. L. Vanreijen, Solid State Ionics, 1985, 16, 261–265 CrossRef CAS.
- M. S. Djosic, V. B. Miskovic-Stankovic, D. T. Janackovic, Z. M. Kacarevic-Popovic and R. D. Petrovic, Colloids Surf., A, 2006, 274, 185–191 CrossRef CAS.
- X. Krokidis, P. Raybaud, A. E. Gobichon, B. Rebours, P. Euzen and H. Toulhoat, J. Phys. Chem. B, 2001, 105, 5121–5130 CrossRef CAS.
- J. S. Lee, H. S. Kim, N. K. Park, T. J. Lee and M. Kang, Chem. Eng. J., 2013, 230, 351–360 CrossRef CAS.
- A. Boumaza, L. Favaro, J. Ledion, G. Sattonnay, J. B. Brubach, P. Berthet, A. M. Huntz, P. Roy and R. Tetot, J. Solid State Chem., 2009, 182, 1171–1176 CrossRef CAS.
- S. Ferreira, J. J. Verstraete, E. Jolimaitre, D. Leinekugel-le-Cocq and C. Jallut, Comput.-Aided Chem. Eng., 2017, 40a, 91–96 Search PubMed.
- M. D. Mantle, D. I. Enache, E. Nowicka, S. P. Davies, J. K. Edwards, C. D'Agostino, D. P. Mascarenhas, L. Durham, M. Sankar, D. W. Knight, L. F. Gladden, S. H. Taylor and G. J. Hutchings, J. Phys. Chem. C, 2011, 115, 1073–1079 CrossRef CAS.
- P. J. Barrie, Annu. Rep. NMR Spectrosc., 2000, 41, 265–316 CrossRef CAS.
- C. D'Agostino, J. Mitchell, L. F. Gladden and M. D. Mantle, J. Phys. Chem. C, 2012, 116, 8975–8982 CrossRef.
- M. Dvoyashkin, R. Valiullin and J. Kärger, Phys. Rev. E: Stat., Nonlinear, Soft Matter Phys., 2007, 75, 041202 CrossRef PubMed.
- C. D'Agostino, J. Mitchell, M. D. Mantle and L. F. Gladden, Chem. – Eur. J., 2014, 20, 13009–13015 CrossRef PubMed.
- J. Wood and L. F. Gladden, Appl. Catal., A, 2003, 249, 241–253 CrossRef CAS.
- S. Kolitcheff, E. Jolimaitre, A. Hugon, J. Verstraete, P. L. Carrette and M. Tayakout-Fayolle, Microporous Mesoporous Mater., 2017, 248, 91–98 CrossRef CAS.
- S. Fujita, H. Kawamori, D. Honda, H. Yoshida and M. Arai, Appl. Catal., B, 2016, 181, 818–824 CrossRef CAS.
- C. D'Agostino, G. L. Brett, P. J. Miedziak, D. W. Knight, G. J. Hutchings, L. F. Gladden and M. D. Mantle, Chem. – Eur. J., 2012, 18, 14426–14433 CrossRef PubMed.
- C. D'Agostino, T. Kotionova, J. Mitchell, P. J. Miedziak, D. W. Knight, S. H. Taylor, G. J. Hutchings, L. F. Gladden and M. D. Mantle, Chem. – Eur. J., 2013, 19, 11725–11732 CrossRef PubMed.
- N. Robinson and C. D'Agostino, Top. Catal., 2019, 19, 11725–11732 Search PubMed.
- G. Campos-Villalobos, F. R. Siperstein, C. D'Agostino, L. Forster and A. Patti, Appl. Surf. Sci., 2020, 516, 146089 CrossRef CAS.
Footnote |
| † Electronic supplementary information (ESI) available. See DOI: 10.1039/d0me00036a |
| This journal is © The Royal Society of Chemistry 2020 |

