
Modeling diffusion of nanocars on a Cu (110) surface†
Kutay B.
Sezginel
 a and
Christopher E.
Wilmer
*ab
a and
Christopher E.
Wilmer
*ab
aDepartment of Chemical and Petroleum Engineering, University of Pittsburgh, 3700 O'Hara St, Pittsburgh, Pennsylvania 15261, USA. E-mail: wilmer@pitt.edu
bDepartment of Electrical and Computer Engineering, University of Pittsburgh, 3700 O'Hara St, Pittsburgh, Pennsylvania 15261, USA
First published on 24th February 2020
Abstract
Nanoscale devices and machines that can be externally controlled or programmed promise revolutionary technological improvements. One example of such machines are nanocars, which are organic supramolecular structures (typically between 200–2000 Da) designed to achieve controlled molecular motion on atomically smooth surfaces. Spurred by a recent global competition where such nanocars had to race each other, interest in this nascent area has recently increased. However, the design space of nanocars is large, and a thorough understanding of how their structure affects their motion on surfaces is lacking. In this work, we investigated the diffusion of nine large organic molecules on a Cu (110) surface using classical simulation methods and transition state theory (TST). We find that, as expected, these molecules tended to diffuse more slowly as their molecular weight and attraction to the surface increases. However, these two parameters do not give a complete picture of surface diffusion. Thus we defined a structural parameter, elevation weighted density, based on the geometry of the molecule that interacts with the surface. We show that this parameter is a good predictor of surface diffusion, as demonstrated by its high rank correlation with TST free energy barriers and with diffusion coefficients calculated using classical simulations. We further discuss design strategies to tune the diffusion performance of nanocars.
| Chris acquired a B.A.Sc. degree from the University of Toronto in Engineering Science and then came to the United States to pursue a Ph.D. in Chemical Engineering at Northwestern under the mentorship of Prof. Randall Q. Snurr. While a grad student, he co-founded, NuMat Technologies, which develops commercial technologies using MOFs, for which he was named to the Forbes Top 30-Under-30 in Energy. At the University of Pittsburgh, he directs the Hypothetical Materials Lab, whose research focuses modeling and discovery of novel molecules and materials. His lab recently spun-out Aeronics, which helps make oxygen portable for people and pets. |
Design, System, ApplicationThe ability of a nanocar to move on a surface is determined by its molecular design. Therefore, understanding the underlying design parameters is crucial to building nanocars with controlled motion. Currently, the key features in nanocar design are determined empirically with tedious experiments including lengthy organic syntheses and scanning tunneling microscopy (STM) measurements. In this study, we investigate different computational strategies for quickly predicting the diffusion of nanocars on surfaces. We highlight two different methods to estimate diffusion behaviors and timescales. We hope these methods will be helpful to test different molecular designs, highlight promising candidates, and understand the key features for nanocar design. |
Introduction
Understanding and controlling molecular motion on surfaces is essential for the bottom-up construction of nanoscale machines.1–4 Such machines are commonly utilized in cells to transport molecular cargo: enzyme molecules are moved along protein filament tracks converting chemical energy into mechanical work.5 A class of artificial molecular machines, nanocars, have been studied to understand and control molecular motion on metal surfaces. From the initial design with fullerene wheels in 2005 (ref. 6) to more advanced designs with rotatable molecular wheels,7 various strategies have been employed to achieve better control over the diffusion process.8–10 More recently in 2017, the world's first ever nanocar race was organized where six teams raced their molecular machines on a 100 nm track.11 As highlighted by the contestants, molecular design played a crucial role in controlling the motion of the nanocar.12–14 Although, substantial effort has been put into understanding key features that affect nanocar diffusion, only a limited number of molecular designs have been tried so far and a thorough understanding of the relevant design parameters is still lacking. As discussed by the competitors as well as the organizers of the nanocar race, a better understanding of the key features that affect nanocar motion is required and computational methods can be helpful for this purpose.12,13 A key question, also asked when designing “macrocars,” is how to add weight while maintaining or increasing speed (i.e., the diffusion coefficient)?In the broadest definition, nanocars are simply large molecules designed to have fast surface diffusion (with or without external stimuli). Previously, several experimental studies were employed to study the diffusion of large molecules on metal surfaces. From those studies a few strategies have been shown to greatly influence diffusion, such as molecular functionalization3,15 and manually adjusting the orientation of the molecule with respect to the substrate lattice with a scanning tunneling microscope (STM) tip.2 Schunack et al. studied the diffusion of decacyclene (DC) and hexa-tert-butyldecacyclene (HtBDC) using time-resolved STM images and found out that long jumps spanning multiple lattice spacings were the dominant type of diffusion as opposed to conventional surface diffusion described by random jumps between nearest neighbor sites. Moreover, they demonstrated that the molecular diffusion rate can be tailored by raising the molecule from the surface by tert-butyl spacer groups resulting in a diffusion constant higher by 4 orders of magnitude. Similarly Sun et al. studied the influence of tert-butyl spacer groups on the mobility of organic molecules on a Cu (110) surface.15 Conversely, they found that adding tert-butyl groups lowered the mobility of the molecule even compared to a higher molecular weight molecule. In their case tert-butyl group changed the adsorption geometry and locked the molecule to the surface highlighting the importance of the relation between the molecular 3D shape and surface geometry. Otero et al. investigated the diffusion of Violet Lander (VL, C108H104) on Cu (110) and showed that they can change the diffusion coefficient by two orders of magnitude by switching between different surface orientations.2 They achieved this by manipulating the molecular orientation with respect to the substrate lattice using STM. In the immobile configuration the VL molecule locks to the surface and it is kinetically stabilized at low temperature, which emphasizes the importance of considering the complementarity between the molecular and surface geometry.
Although these strategies discovered by trial-and-error, such as inserting tert-butyl spacers, are useful, a more systematic investigation of surface diffusion as a function of structure is needed to improve future nanocar designs. Akimov and co-workers have performed several studies to understand the motion of nanocars on metal surfaces using rigid body molecular dynamics.16–19 They employed a simplified nanocar design and divided the molecule into rigid fragments as four wheels and a chassis. They showed that, in agreement with experimental results, nanocar mobility was initiated at temperatures higher than 400 K and they observed rotational motion of the wheels at 500 K. In a later study they investigated the effect of an electric field (e.g. created by the STM tip) on the diffusion of the same structure.19 In order to mimic the electric field, they employed a custom charge transfer method (developed in a previous study18) and performed a series of rigid-body molecular dynamics simulations. They found that external electric fields can be used to drive nonpolar nanocars unidirectionally and that the rolling mechanism of the wheels is the dominant factor in the nanocar surface diffusion as opposed to a simple hopping and sliding mechanism. Ganji et al. studied the motion of a carborane-wheeled nanocar on graphene/graphyne surfaces using density functional theory.20 They calculated the activation energy for the motion of the four wheeled nanocar as 17.06 and 4.38 kcal mol−1 for graphene and graphyne surfaces, respectively. While these studies provide important qualitative insights about the motion of nanocars, they fall short of quantifying it by estimating a diffusion coefficient. We focused on identifying a simple model that could accurately predict the experimentally observed timescale of diffusion. Furthermore, we studied a diverse range of molecules to understand the key structural factors that affect diffusion, whereas previous studies focused on only a few molecules at a time. This broader investigation allowed us to discover a structural parameter, elevation-weighted-density, which shows good correlation with diffusion and can be used to quickly rank molecular designs.
In this work, we investigated the diffusion of 9 large organic molecules on a Cu (110) surface (see Fig. 1). We chose these molecules to represent a wide variety of molecular geometries and to be able to compare our findings with available experimental studies of their motion (references for the studies are provided in the Methods section). We used classical molecular dynamics (MD) simulations and estimated self-diffusion coefficients by calculating mean squared displacements. We found that even though the correct timescales of diffusion cannot be achieved with typical MD simulations (i.e., without rare-event sampling techniques), we can still obtain certain useful information, such as the preferential crystallographic directions for diffusion on the surface. To obtain diffusion coefficients within the same orders of magnitude as experimental measurements, we then employed umbrella sampling and the weighted histogram analysis method (WHAM)21 to estimate free energy barriers for diffusion. Using the free energy profiles, we estimated hopping rates and self-diffusion coefficients using a transition state theory (TST) approach. We found that by tuning the surface-molecule interaction energetics and employing the TST method we can obtain activation energies and self-diffusion coefficients that are in good agreement with experimentally observed values. Both methods predict the fastest and slowest molecules to be the same and even though the individual rankings varied slightly between different methods, the diffusion coefficients were found be highly correlated. We calculated a Spearman's rank correlation coefficient of 0.93 and 0.90 between MD and TST diffusion coefficients for [001] and [1![[1 with combining macron]](https://www.rsc.org/images/entities/char_0031_0304.gif) 0] directions, respectively. Overall, we find that to optimize speed, for a given molecular weight, minimizing the molecule–surface interaction by elevating the body of the molecule with spacer functional groups is a good strategy, which is supported by empirical observations from past nanocar racers. To quantify this we proposed a metric, named elevation-weighted-density, to quickly rank molecular designs. We found that elevation weighted density is linearly correlated with the free energy barrier of diffusion calculated with the TST method. Furthermore, we reiterate that the complementarity between the molecular design and surface geometry is crucial.
0] directions, respectively. Overall, we find that to optimize speed, for a given molecular weight, minimizing the molecule–surface interaction by elevating the body of the molecule with spacer functional groups is a good strategy, which is supported by empirical observations from past nanocar racers. To quantify this we proposed a metric, named elevation-weighted-density, to quickly rank molecular designs. We found that elevation weighted density is linearly correlated with the free energy barrier of diffusion calculated with the TST method. Furthermore, we reiterate that the complementarity between the molecular design and surface geometry is crucial.
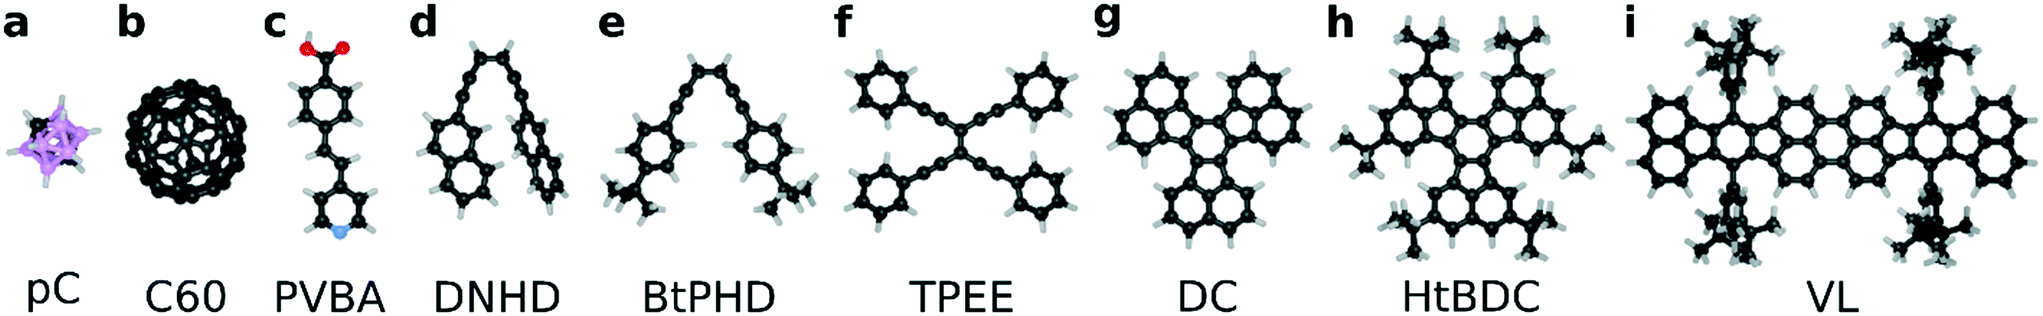 | ||
| Fig. 1 Molecular structures used in this study with chemical names where abbreviations and chemical formulae are given in brackets: (a) p-carborane [pC, C2H12B10]; (b) fullerene [C60, C60] (c) 4-trans-2-(pyrid-4-yl-vinyl) benzoic acid [PVBA, C14H11O2N]; (d) (Z)-1,6-di(napthalen-2-yl)hexa-3-en-1,5-diyne [DNHD, C26H16]; (e) (Z)-1,6-bis-(4-(tert-butyl)phenyl)hexa-3-en-1,5-diyne [BtPHD, C26H28]; (f) tetrakis(phenylethynyl)ethane [TPEE, C34H20]; (g) decacyclene [DC, C36H18]; (h) hexa tert-butyl decacyclene [HtBDC, C60H66]; and (i) violet lander [VL, C108H104]. Color scheme is as follows: C (black), N (blue), O (red), B (pink), H (light gray). | ||
Computational methods
Structure generation
We selected a total of 9 molecules, namely: p-carborane;22 C60;23 PVBA;24 DNHD;15 BtPHD;15 TPEE;15 decacylene;3 hexa tert-butyl decacylene;3 and violet lander2 (see Fig. 1) to represent a wide variety of molecular geometries and to compare our findings with available experimental studies of their motion. Molecular geometries were optimized using Kohn–Sham density functional theory at BP86-D3/ Def2-SVP25–27 level of theory as implemented in ORCA.28 The Cu (110) surface was generated using ASE29 slab builder tool to a size of 39.1 × 41.5 × 5.5 Å consisting of 1400 atoms (see Fig. 2a). Molecular geometries and simulation configuration files are provided in the ESI.†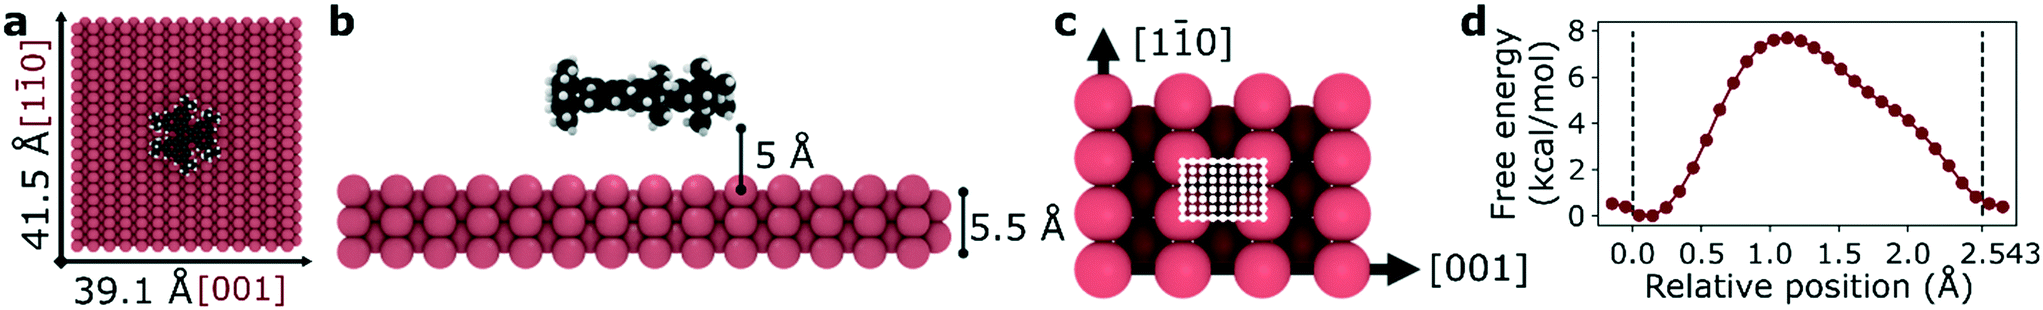 | ||
| Fig. 2 Representative simulation setup for HtBDC. (a) Top view – molecules are placed in the center of a 39.1 × 41.5 Å Cu (110) surface. (b) Side view – each molecule is placed 5 Å above the surface. (c) For TST calculations the unit cell of a Cu (110) surface is divided into 936 grid points (26 points in [10] and 36 points in [001] directions) with a step size of 0.1 Å. The unit cell has a size of 3.597 × 2.543 Å and it is shown with white lines. (d) Representative free energy barrier for the diffusion of HtBDC molecule in [10] direction obtained from WHAM analysis (more simulation details in ESI†). | ||
Molecular dynamics
Molecular dynamics (MD) simulations in the NVT ensemble at 300 K were performed with a timestep of 1 fs for a total of 10 ns using LAMMPS.30 20 sets of simulations were performed with different initial velocity distributions to improve statistical sampling. For each molecule, the center of mass was calculated at every 1 ps which was used to calculate the mean squared displacement (MSD) in both [10] and [001] directions to estimate 1D self-diffusion coefficients. A periodic simulation box of 39.1 × 41.5 × 40 Å was used for all simulations. The Cu (110) surface was placed at the bottom of the simulation box and the molecule was placed in the middle and 5 Å above the surface making sure the largest surface of the molecule is parallel to the metal surface (see Fig. 2). The surface atom positions were fixed during the simulations and nonbonded interactions between Cu atoms were neglected. All molecules were modelled as rigid bodies and a Lennard-Jones potential was used to model vdW interactions with a cut-off radius of 12.5 Å. The force field parameters were adopted from universal force field (UFF)31 and the Cu atom epsilon value was changed to 0.125 kcal mol−1 (instead of the original 0.05 kcal mol−1) to increase surface adsorption energy. More information about the calculation of the self-diffusion coefficients and force field parameters are given in the ESI.†
Transition state theory
As the diffusion of large molecules are quite slow and time scales cannot be achieved with traditional MD simulations, we employed umbrella sampling and weighted histogram analysis method (WHAM)21 to calculate periodic free energy barriers for diffusion. We divided the orthogonal unit cell of a Cu (110) surface using 0.1 Å grid spacing for both [10] and [001] directions (see Fig. 2c). For each point on the surface (936 total), we placed the molecule at that point and constrained its motion in [10] and [001] directions in separate simulations using a spring with a constant of 200 kcal mol−1. The motion in the direction perpendicular to the surface was not constrained. We then let the molecule sample different configurations using the same simulation setup described above for the MD simulations with rigid molecules and a fixed surface. However, this time we scaled the mixed LJ epsilon parameter between the surface and the molecule atoms by 10 to further increase the adsorption energy in order to better approximate the experimentally observed activation energy of diffusion. Using WHAM analysis and Boltzmann averaging we finally obtained a free energy barrier for diffusion in both [10] and [001] directions. A representative energy barrier is provided in Fig. 2d. After obtaining periodic free energy barriers we used dynamically corrected transition state theory method by Dubbeldam et al.32 to calculate the hopping rate (kA→B) and estimate 1D self-diffusion coefficient (DS). More details are given in ESI.†
We aimed to keep our modelling approach as simple as possible while capturing essential features of diffusion observed in the experiments. As the amount of detail that needed to be included in our model was not clear a priori, we started by employing a rigid body approximation. As shown later in this work, this simple model was able to capture several important experimentally observed trends in the diffusion of nanocars. Additionally, we increased the vdW interaction energy between the molecule and the surface to better approximate the experimentally observed activation energies and diffusion coefficients. We achieved this by changing the Lennard-Jones epsilon parameter with the rigid body approximation. For flexible force fields more parameters would need to be modified, hence increasing the complexity of the model (potentially hindering reproducibility). Finally, the computational cost is significantly reduced with this approach making it possible to quickly screen candidate molecular geometries. Consequently, configurational changes within the molecule due to surface adhesion were neglected. The effects of this simplifying assumption are further discussed in the results and discussion section.
Results and discussion
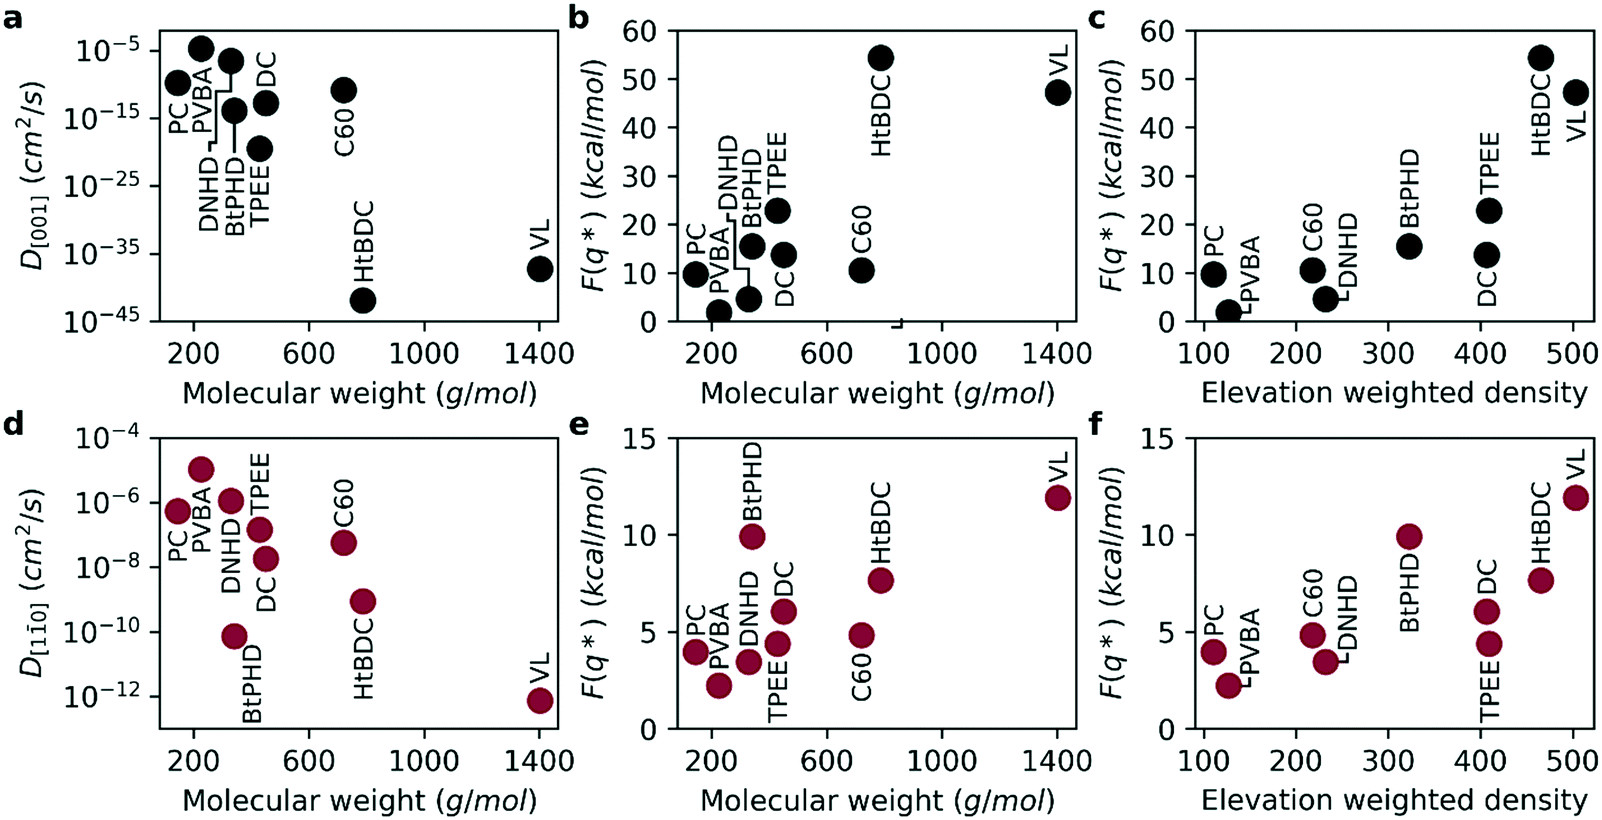
We first investigated the diffusion of the molecules using classical MD simulations for the two primary directions of the Cu (110) surface namely, [001] and [10] (see Fig. 2c). Per the surface geometry it is energetically more favorable to diffuse along the [10] direction compared to [001] as highlighted by experimental studies.2,3,15,23,24 In Fig. 3, self-diffusion coefficients calculated from MD simulations are given for both directions. For all molecules the diffusion coefficient in [10] direction was higher than [001] direction in good agreement with experimental observations.2,3,15,23,24 Overall, the diffusion coefficient gets smaller with larger molecular weight and higher surface adhesion for both primary directions investigated (Fig. 3a–d). However, it is also evident that not all molecules follow this relation directly, such as the PVBA molecule suggesting that the molecular geometry plays an important role in the diffusion. For the BtPHD molecule the addition of tert-butyl groups resulted in a slower diffusion compared to TPEE, and DNHD molecules and TPEE molecule was found to be slower than DNHD in agreement with Sun et al.15 However, addition of tert-butyl groups in HtBDC molecule didn't results in a faster diffusion compared to the DC molecule as reported by Schunack et al.3 Even though, in agreement with the experiments, we observed strong anisotropic diffusion for both of these molecules, our calculations did not rank these molecules the same way: DC molecule was found to be faster in our calculations than HtBDC molecule as opposed to Schunack et al. This difference in ranking might be caused by the assumed rigid geometry in our simulations, because the tert-butyl spacers in HtBDC are likely to undergo configurational change as they interact with the surface which might increase or decrease the diffusion according to the complementarity of the final geometry with the surface. In the case of BtPHD vs. TPEE adding tert-butyl groups decreased the diffusion whereas in DC vs. HtBDC tert-butyl addition resulted in a faster diffusion according to experimental observations. This suggests that to get a better representation of the adsorption geometry, configurational changes might need to be accounted for. Furthermore, the calculated diffusion coefficients for DC and HtBDC are in the range of 10−5 cm2 s−1 which is approximately eight orders of magnitude higher than the experimentally observed values. This implies that the vdW interaction energy between the molecules and the surface is likely to be severely underestimated in our model. Even though we increased the UFF epsilon parameters five-fold to amplify surface adsorption energy, a further increase is required to approximate experimental energetics. However, estimating diffusion via classical MD simulations with such high interaction energies, without using a rare-event sampling technique, would be computationally infeasible. As the experimentally observed hopping events are very rare, it would require excessive computational time to have statistically significant hopping events during the simulations. However, even though the absolute timescale of the diffusion coefficients does not represent the experimental conditions, the relative ranking of diffusion across the 9 molecules, as well as their diffusion along different crystallographic directions can be usefully investigated.
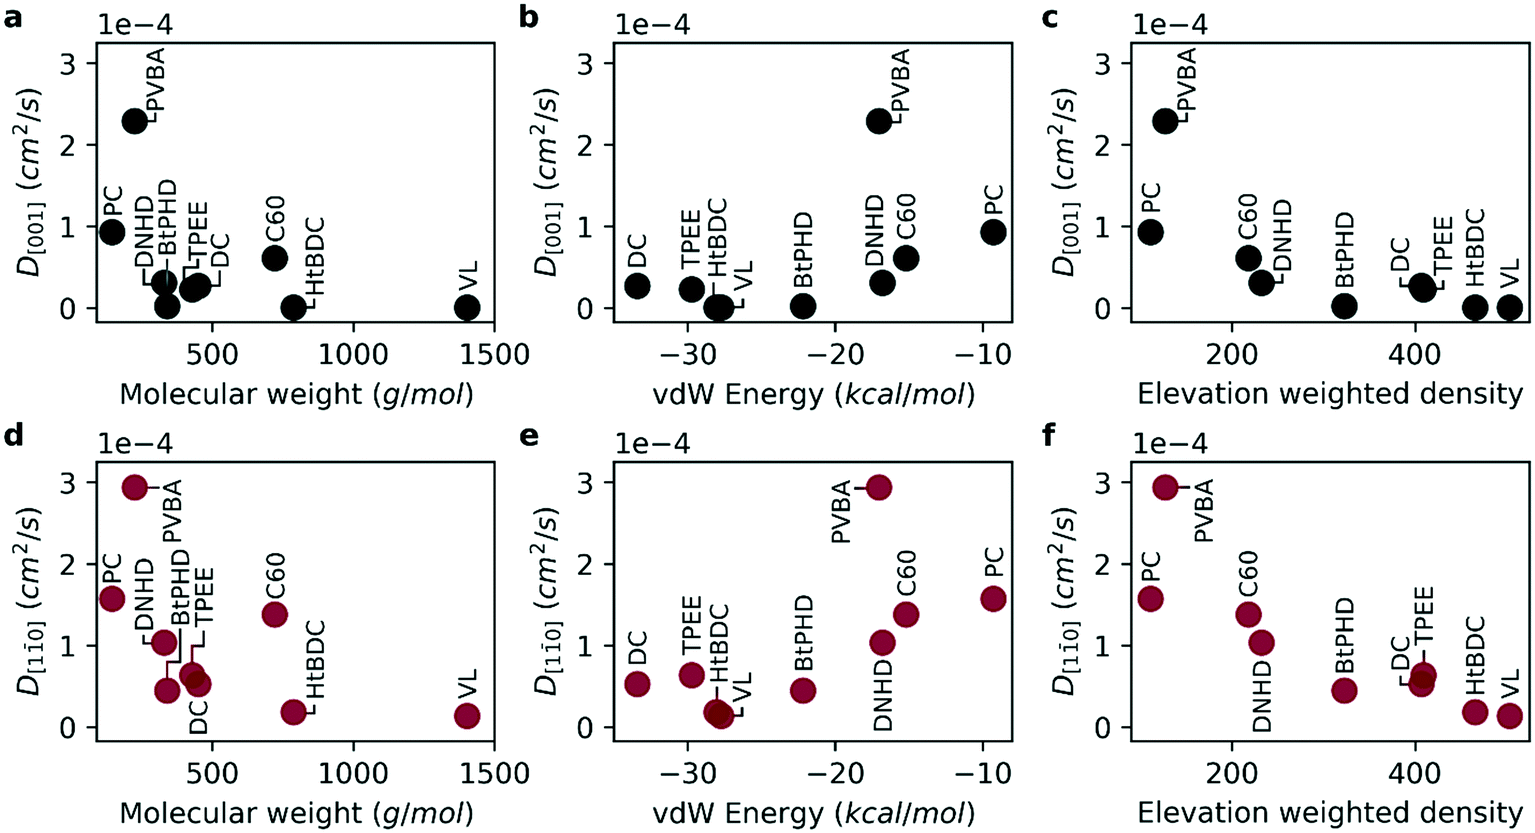 | ||
| Fig. 3 Diffusion coefficient calculated using MD simulations in [001] and [10] directions: (a) molecular weight vs. D[001] (b) vdW energy vs. D[001] (c) elevation weighted density vs. D[001] (d) molecular weight vs. D[10] (e) vdW energy vs. D[10] (f) elevation weighted density vs. D[10]. | ||
As molecular weight and vdW energy do not give a complete picture of diffusion we also propose a structural parameter, named elevation weighted density, based on molecular adsorption geometry (see Fig. 4). The calculation of this parameter is discussed in ESI.† As seen in Fig. 3e and f the self-diffusion coefficients get smaller as the elevation weighted density increases. Moreover, the elevation weighted density shows good correlation with the diffusion coefficients as evident from the Spearman's rank correlation coefficient of −0.917 (p: 0.001) for both D[001] and D[10]. One possible reason for this is that this parameter includes effect of both molecular weight and surface geometry.
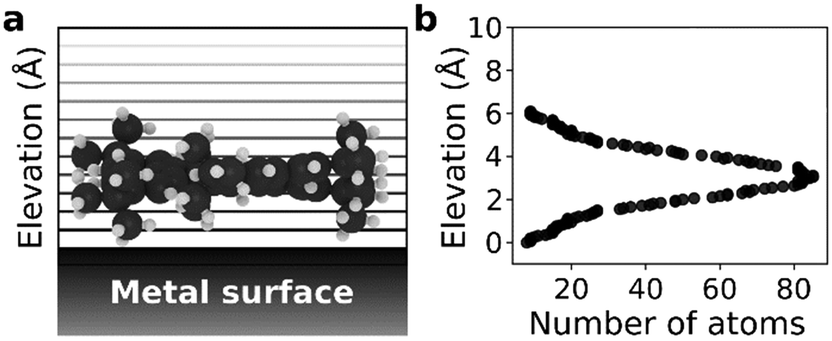 | ||
| Fig. 4 Elevation weighted density calculation for HtBDC: (a) starting from the bottom most part of the molecule, number of atoms are counted with 0.05 Å discrete steps and using a cut-off radius of 1 Å (b) for each step number of atoms in proximity of that elevation are plotted. | ||
With the purpose of capturing the realistic time scale of diffusion, we calculated free energy barriers for the diffusion along the [001] and [10] directions and estimated self-diffusion coefficients (see Fig. 5). The activation energies for the average free energy profiles are given in Fig. 5b and e for [001] and [10] directions, respectively. As seen in the figure, the free energy barrier for diffusion is almost four times higher for the [001] direction compared to the [10] direction supporting experimental observed anisotropic diffusion.2,3,15,23,24 Consequently, this higher energy barrier results in a smaller diffusion coefficient for the [001] direction as seen in Fig. 5a and d. By the definition of TST, the self-diffusion coefficient is exponentially related to the energy barrier, therefore the diffusion coefficients calculated here span across a much higher range (8 orders or magnitude for [10] and 40 orders of magnitude for [001] directions). As a result, the anisotropy of diffusion is much higher compared to results obtained from MD simulations. Overall, similar to MD simulations the diffusion coefficients get smaller and the activation energies get higher with increasing molecular weight. We find that even though the individual rankings of diffusion coefficients were not identical between the two methods, both methods predicted the fastest and slowest molecules to be PVBA, and VL, respectively. Overall, the diffusion coefficients calculated with the two methods were found be highly correlated as evident by Spearman's rank correlation coefficients of 0.93 (p: 0.0002) and 0.90 (p: 0.0009) for [001] and [10] directions, respectively. Furthermore, ranking between DNHD, TPEE, and BtPHD molecules were found to be the same as MD simulations in agreement with the experimental findings meaning addition of tert-butyl groups slowed surface diffusion. This also applied to DC and HtBDC molecules where addition of tert-butyl groups again resulted in slower diffusion for the HtBDC molecule in line with the MD simulations but opposing experimental observations. As rigid body approximation was also employed in TST simulations it is somewhat expected to see the same ranking with this method. We believe more sophisticated methods that account for the intramolecular reconfiguration during surface adhesion should be employed for more sensitive ranking. Alternatively, multi rigid body simulations or coarse graining methods could also be useful for this purpose.
 | ||
| Fig. 5 Transition state theory results: (a) molecular weight vs. D[001] (b) molecular weight vs. free energy barrier in [001] direction (c) elevation weighted density vs. free energy barrier in [001] direction (d) molecular weight vs. D[10] (e) molecular weight vs. free energy barrier in [10] direction (f) elevation weighted density vs. free energy barrier in [10] direction. | ||
As the team with the fastest molecule in the nanocar race, Simpson et al. highlighted several key features to improve velocity, maneuverability and functionality of nanocars: 1) using low molecular weight nanocars to decrease surface adhesion and make it easier to deposit under vacuum, 2) using large enough wheels to lift the chassis off the surface and using as few wheels as possible to minimize surface attraction, 3) having rigid chassis and short axles to prevent the chassis from sagging towards the surface to again minimize surface-chassis attraction.13 Overall, the key factor for improving diffusion of a given molecular weight is to minimize surface attraction by rational molecular design. We believe elevation weighted density is a good quick estimate of nanocar performance as it takes into account the key features highlighted by these nanocar racers. By definition, it takes both molecular weight and molecular geometry into account. Moreover, as the calculation is performed on the surface adsorption geometry the configurational changes of the molecule is also introduced. This is supported by a Spearman's rank correlation coefficient of 0.883 (p: 0.002) and 0.733 (p: 0.025) between elevation weighted density and the free energy barrier of diffusion for the [001] and [10] directions, respectively (see Fig. 5c and e).
Conclusion
In summary, we employed classical MD simulations and TST calculations to predict surface diffusion of large organic molecules. We found that using a relatively simple and computationally inexpensive calculation i.e. rigid body MD simulations, it is possible to estimate the relative diffusion between different molecules. Moreover, we showed that the diffusion gets slower with higher molecular weight and stronger molecule–surface interaction energy. We suggested a geometric parameter, i.e. elevation weighted density, which can be easily calculated using the surface adsorption geometry of the molecules. We show that this parameter could be used to quickly rank diffusion of different molecular designs. Furthermore, we show that it is possible to employ a more computationally expensive transition state theory (TST) approach to estimate the timescale of diffusion. This includes increasing vdW interactions between the molecule and the surface and calculating free energy barrier for diffusion with umbrella sampling of rigid MD simulations. Overall, as highlighted by nanocar racers we suggest minimizing the surface adhesion energy is a good strategy to improve diffusion for a given molecular weight. One way to achieve this is to elevate the bulk of the molecule from the surface by using various molecular components (e.g. wheels).Careful design of the molecular structure and selection of the appropriate surface can enable precise manipulation of the molecular diffusion. We believe these tools can be used to advance design of molecular structures to control their motion and play an important role in the design of nanocars. Large screening studies can be employed and molecular designs can be ranked quickly using elevation weighted density or quick rigid MD simulations. After identifying promising designs, more rigorous calculations can be performed to rank different molecular designs more accurately.
Conflicts of interest
There are no conflicts to declare.Acknowledgements
The authors would like to acknowledge the Swanson School of Engineering and the Center for Research Computing (CRC) at the University of Pittsburgh for offering early financial support and providing computational resources for this study. We also gratefully acknowledge support by a fellowship from The Molecular Sciences Software Institute under NSF grant ACI-1547580.References
- F. Rosei, M. Schunack, P. Jiang, A. Gourdon, E. Lægsgaard, I. Stensgaard, C. Joachim and F. Besenbacher, Science, 2002, 296, 328–331 CrossRef CAS PubMed.
- R. Otero, F. Hümmelink, F. Sato, S. B. Legoas, P. Thostrup, E. Lægsgaard, I. Stensgaard, D. S. Galvão and F. Besenbacher, Nat. Mater., 2004, 3, 779–782 CrossRef CAS PubMed.
- M. Schunack, T. R. Linderoth, F. Rosei, E. Laegsgaard, I. Stensgaard and F. Besenbacher, Phys. Rev. Lett., 2002, 88, 156102 CrossRef CAS PubMed.
- F. Rosei, M. Schunack, Y. Naitoh, P. Jiang, A. Gourdon, E. Laegsgaard, I. Stensgaard, C. Joachim and F. Besenbacher, Prog. Surf. Sci., 2003, 71, 95–146 CrossRef CAS.
- N. J. Carter and R. A. Cross, Nature, 2005, 435, 308 CrossRef CAS PubMed.
- Y. Shirai, A. J. Osgood, Y. Zhao, K. F. Kelly and J. M. Tour, Nano Lett., 2005, 5, 2330–2334 CrossRef CAS PubMed.
- T. Kudernac, N. Ruangsupapichat, M. Parschau, B. Maciá, N. Katsonis, S. R. Harutyunyan, K.-H. Ernst and B. L. Feringa, Nature, 2011, 479, 208–211 CrossRef CAS PubMed.
- Y. Shirai, J.-F. Morin, T. Sasaki, J. M. Guerrero and J. M. Tour, Chem. Soc. Rev., 2006, 35, 1043–1055 RSC.
- P.-T. Chiang, J. Mielke, J. Godoy, J. M. Guerrero, L. B. Alemany, C. J. Villagomez, A. Saywell, L. Grill and J. M. Tour, ACS Nano, 2011, 6, 592–597 CrossRef PubMed.
- C. Joachim and G. Rapenne, ACS Nano, 2013, 7, 11–14 CrossRef CAS PubMed.
- D. Castelvecchi, Nature, 2017, 544, 278 CrossRef CAS PubMed.
- G. Rapenne and C. Joachim, Nat. Rev. Mater., 2017, 2, 17040 CrossRef.
- G. J. Simpson, V. García-López, P. Petermeier, L. Grill and J. M. Tour, Nat. Nanotechnol., 2017, 12, 604–606 CrossRef CAS PubMed.
- R. Pawlak and T. Meier, Nat. Nanotechnol., 2017, 12, 712 CrossRef CAS PubMed.
- Q. Sun, C. Zhang, Z. Li, K. Sheng, H. Kong, L. Wang, Y. Pan, Q. Tan, A. Hu and W. Xu, Appl. Phys. Lett., 2013, 103, 013103 CrossRef.
- A. V. Akimov, A. V. Nemukhin, A. A. Moskovsky, A. B. Kolomeisky and J. M. Tour, J. Chem. Theory Comput., 2008, 4, 652–656 CrossRef CAS PubMed.
- S. S. Konyukhov, I. V. Kupchenko, A. A. Moskovsky, A. V. Nemukhin, A. V. Akimov and A. B. Kolomeisky, J. Chem. Theory Comput., 2010, 6, 2581–2590 CrossRef CAS PubMed.
- A. V. Akimov, C. Williams and A. B. Kolomeisky, J. Phys. Chem. C, 2012, 116, 13816–13826 CrossRef CAS.
- A. V. Akimov and A. B. Kolomeisky, J. Phys. Chem. C, 2012, 116, 22595–22601 CrossRef CAS.
- M. D. Ganji, M. G. Ahangari and S. M. Emami, Mater. Chem. Phys., 2014, 148, 435–443 CrossRef.
- S. Kumar, J. M. Rosenberg, D. Bouzida, R. H. Swendsen and P. A. Kollman, J. Comput. Chem., 1992, 13, 1011–1021 CrossRef CAS.
- S. M. Hosseini Lavasani, H. Nejat Pishkenari and A. Meghdari, J. Phys. Chem. C, 2016, 120, 14048–14058 CrossRef CAS.
- J. Weckesser, J. V. Barth and K. Kern, Phys. Rev. B: Condens. Matter Mater. Phys., 2001, 64, 161403 CrossRef.
- J. Weckesser, J. V. Barth and K. Kern, J. Chem. Phys., 1999, 110, 5351–5354 CrossRef CAS.
- J. P. Perdew, Phys. Rev. B: Condens. Matter Mater. Phys., 1986, 33, 8822–8824 CrossRef PubMed.
- S. Grimme, S. Ehrlich and L. Goerigk, J. Comput. Chem., 2011, 32, 1456–1465 CrossRef CAS PubMed.
- F. Weigend and R. Ahlrichs, Phys. Chem. Chem. Phys., 2005, 7, 3297–3305 RSC.
- F. Neese, Wiley Interdiscip. Rev.: Comput. Mol. Sci., 2012, 2, 73–78 CAS.
- A. H. Larsen, J. J. Mortensen, J. Blomqvist, I. E. Castelli, R. Christensen, M. Dułak, J. Friis, M. N. Groves, B. Hammer, C. Hargus, E. D. Hermes, P. C. Jennings, P. B. Jensen, J. Kermode, J. R. Kitchin, E. L. Kolsbjerg, J. Kubal, Kristen Kaasbjerg, S. Lysgaard, J. B. Maronsson, T. Maxson, T. Olsen, L. Pastewka, Andrew Peterson, C. Rostgaard, J. Schiøtz, O. Schütt, M. Strange, K. S. Thygesen, Tejs Vegge, L. Vilhelmsen, M. Walter, Z. Zeng and K. W. Jacobsen, J. Phys.: Condens. Matter, 2017, 29, 273002 CrossRef PubMed.
- S. Plimpton, J. Comput. Phys., 1995, 117, 1–19 CrossRef CAS.
- A. K. Rappe, C. J. Casewit, K. S. Colwell, W. A. Goddard and W. M. Skiff, J. Am. Chem. Soc., 1992, 114, 10024–10035 CrossRef CAS.
- D. Dubbeldam, E. Beerdsen, T. J. H. Vlugt and B. Smit, J. Chem. Phys., 2005, 122, 224712 CrossRef CAS PubMed.
Footnote |
| † Electronic supplementary information (ESI) available. See DOI: 10.1039/c9me00171a |
| This journal is © The Royal Society of Chemistry 2020 |