Amplified electrochemiluminescence signals promoted by the AIE-active moiety of D–A type polymer dots for biosensing†
Ziyu
Wang‡
a,
Ningning
Wang‡
b,
Hang
Gao
a,
Yiwu
Quan
*c,
Huangxian
Ju
 *b and
Yixiang
Cheng
 *a
*a
aKey Lab of Mesoscopic Chemistry of MOE and Jiangsu Key Laboratory of Advanced Organic Materials, School of Chemistry and Chemical Engineering, Nanjing University, Nanjing 210023, China. E-mail: quanyiwu@nju.edu.cn; yxcheng@nju.edu.cn
bState Key Laboratory of Analytical Chemistry for Life Science, School of Chemistry and Chemical Engineering, Nanjing University, Nanjing 210023, P. R. China. E-mail: hxju@nju.edu.cn
cKey Laboratory of High Performance Polymer Material and Technology of Ministry of Education, Department of Polymer Science and Engineering, School of Chemistry and Chemical Engineering, Nanjing University, Nanjing 210023, China
First published on 8th November 2019
Abstract
Three-component conjugated polymers of a strong donor–acceptor (D–A) type could be synthesized by Pd-catalyzed Suzuki coupling polymerization reaction of 1,2-bis(4-bromophenyl)-1,2-diphenylethene (M-1) with 9-octyl-3,6-bis(4,4,5,5-tetramethyl-1,3,2-dioxaborolan-2-yl)-9H-carbazole (M-2) and 4,6-bis((E)-4-bromostyryl)-2,2-difluoro-5-phenyl-2H-1l3,3,2l4-dioxaborinine (M-3). Among them, P-1 and P-2 with high TPE ratios at 0.95 and 0.9 showed obvious aggregation-induced emission (AIE) behavior; in contrast P-3 with a low TPE ratio at 0.8 showed an aggregation-caused quenching (ACQ) phenomenon. In particular, the three resulting polymer dots (P-1 to P-3 Pdots) exhibited a 200 mV lower electrochemiluminescence (ECL) potential due to their strong D–A electronic structure. Most importantly, the ECL signals of Pdots could be enhanced as high as 3 times by increasing their AIE-active TPE moiety ratios from 0.8 (P-3) to 0.95 (P-1) via the band gap emission process. Herein, P-1 Pdots with the strongest ECL signal were successfully used as ECL biosensors for the detection of catechol, epinephrine and dopamine with detection limits of 1, 7 and 3 nM, respectively. This work provides a new strategy for developing highly sensitive ECL biosensors by the smart structure design of the AIE-active Pdots.
Introduction
AIE-active materials have attracted much attention due to their high emission quantum efficiency in aggregate state, which can overcome the notorious aggregation-caused quenching (ACQ) phenomenon observed for most traditional organic chromophores in aqueous solutions.1 To date, much effort has been devoted to developing AIE-active luminogens for different applications, such as ion detection,2 OLEDs,3 circularly polarized luminescent (CPL) materials,4 electrofluorochromic (EFC) materials5 and so on. In particular, AIE-active biosensors have been regarded as one of the most important biosensors in various fields.6 Recently, tetraphenylethene (TPE)-based AIE-active anti-cancer supramolecular coordination complexes as a self-indicating drug carrier were successfully applied for doxorubicin (DOX) to achieve a synergistic anticancer effect.7As is well known, conjugated polymers with donor–acceptor (D–A) type electronic systems exhibit tunable band gaps and long wavelength emission via the intramolecular charge transfer (ICT) process.8 Nowadays, D–A type conjugated polymers with excellent optical and electrochemical properties are being widely used in OLEDs,9 memory devices,10 solar cells,11 electrochromic devices12 and so on. Over the past ten years, organic fluorine–boron complexes have received a considerable amount of attention due to their excellent electron accepting ability, high absorption coefficients, small Stokes shifts, narrow emission bands, desirable chemical and photostability and high fluorescence quantum yields.13 As an important member of organoboron dyes, the 2,2-difluoro-5-phenyl-4,6-di((E)-styryl)-2H-1λ3,3,2λ4-dioxaborinine (DFPDB) group was chosen as the chromophore and electron acceptor to construct a series of D–A type photoelectronic materials using different electron donor terminal groups.14
Electrochemiluminescence (ECL) can be regarded as a kind of luminescence emission process on electrode surfaces via the excited states formed by an exergonic electron transfer reaction.15 Various ECL probes have been developed for their high sensitivity and low detection limits including luminol16 and ruthenium(II) complexes,17 quantum dots (QDs),18 Au nanoclusters (AuNCs)19 and so on. Compared with traditional ECL materials, polymer dots (Pdots) have been regarded as one of the most promising ECL luminogens due to their low toxicity and versatile structural modification at a well-defined molecular level.20 Recently, more and more reports have demonstrated that the ECL response signals of Pdots can be greatly improved, including ECL enhancement, a low ECL potential and highly sensitive biosensing, by incorporating an AIE-active group into the polymer chain backbone and adjusting the D–A electronic structure system.21 In our recent work, we have reported a strategy for designing ECL materials with a low potential and strong ECL emission via the tuning of the D–A structure.22 To the best of our knowledge, there have been no studies on the ECL amplification effect promoted by the AIE-active moieties of Pdots. In this work, we further designed and synthesized three D–A type Pdots for ECL biosensing by changing the AIE-active TPE moiety ratios. Compared with the model polymer Pdots without the D–A system, D–A type Pdots showed a 200 mV lower anodic ECL potential. Most importantly, 3 times ECL amplification could be observed on increasing the AIE-active TPE moiety from P-3 to P-1 Pdots. Furthermore, P-1 Pdots with the strongest ECL were used as biosensors for the detection of three catechol derivatives via the resonance energy transfer (RET) mechanism.
Experimental
Synthesis and characterization of the monomers and polymers
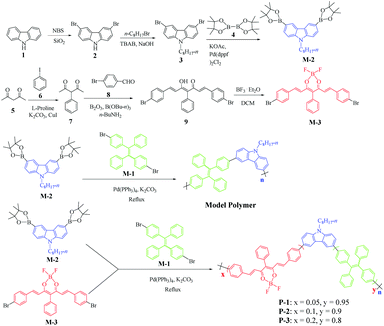
The detailed synthetic routes of P-1 to P-3 and the model polymer are outlined in Scheme 1. The AIE-active 1,2-bis(4-bromophenyl)-1,2-diphenylethene monomer (M-1), the electron donor 9-octyl-3,6-bis(4,4,5,5-tetramethyl-1,3,2-dioxaborolan-2-yl)-9H-carbazole monomer (M-2) and the electron acceptor 4,6-bis((E)-4-bromostyryl)-2,2-difluoro-5-phenyl-2H-1l3,3,2l4-dioxaborinine monomer (M-3) were synthesized according to previous literature studies.14,23 The detailed synthesis procedures of M-3, the model polymer and P-1 to P-3 are described in the ESI.† Three-component polymers P-1 to P-3 and a two-component model polymer were synthesized via the Suzuki coupling polymerization reaction to give 54.3% to 60.7% yields. The GPC data of P-1 to P-3 and the model polymer showed that Mw = 7650 to 13![[thin space (1/6-em)]](https://www.rsc.org/images/entities/char_2009.gif) 040, Mn = 5570 to 8390 and PDI = 1.11 to 1.55 (Table S1†). The relative ratios between TPE and DFPDB moieties were 95
040, Mn = 5570 to 8390 and PDI = 1.11 to 1.55 (Table S1†). The relative ratios between TPE and DFPDB moieties were 95![[thin space (1/6-em)]](https://www.rsc.org/images/entities/char_2009.gif) :
:![[thin space (1/6-em)]](https://www.rsc.org/images/entities/char_2009.gif) 5 for P-1, 90
5 for P-1, 90![[thin space (1/6-em)]](https://www.rsc.org/images/entities/char_2009.gif) :
:![[thin space (1/6-em)]](https://www.rsc.org/images/entities/char_2009.gif) 10 for P-2 and 80
10 for P-2 and 80![[thin space (1/6-em)]](https://www.rsc.org/images/entities/char_2009.gif) :
:![[thin space (1/6-em)]](https://www.rsc.org/images/entities/char_2009.gif) 20 for P-3, respectively (Scheme 1). For P-1 to P-3, the three moieties had different functions: (i) carbazole and DFPDB moieties formed the D–A type electronic structure, with the carbazole moiety acting as the electron donor and linker and the DFPDB moiety acting as the electron acceptor and (ii) the TPE moiety acted as the AIE-active moiety.
20 for P-3, respectively (Scheme 1). For P-1 to P-3, the three moieties had different functions: (i) carbazole and DFPDB moieties formed the D–A type electronic structure, with the carbazole moiety acting as the electron donor and linker and the DFPDB moiety acting as the electron acceptor and (ii) the TPE moiety acted as the AIE-active moiety.
Preparation of conjugated polymer dots (Pdots)
The polymers (100 μg) and poly(styrene-co-maleic anhydride) (PSMA) (10 μg) were dissolved in 2 mL THF. The solution was added into Milli-Q water (10 mL) quickly in a bath sonicator (120 W, 37 kHz) over 4 min. The mixture was concentrated to 2 mL by rotary evaporation under vacuum followed by filtration through a 0.22 μm poly(ether sulfone) (PES) syringe filter (Millex-GP Filter, Millipore) to give a 50 μg mL−1 aqueous solution of Pdots.Electrochemical and ECL measurements
Cyclic voltammetric (CV) measurements were carried out on a CHI 660B electrochemical workstation with a three-electrode system containing a glassy carbon electrode (GCE) as the working electrode, platinum wire as the counter electrode, and an Ag/Ag+ electrode (filled with 0.01 M AgNO3 and 0.1 M Bu4NBF4) as the reference electrode. The CV curves were measured in 50 μg mL−1P-1 to P-3, model polymer and 1 mM corresponding monomers in CH2Cl2 with 0.1 M Bu4NBF4 as the electrolyte, using ferrocene (Fc) as the internal potential standard that had a half-wave potential of 0.12 V versus Ag/Ag+. Before each measurement, the solution was deoxygenated with nitrogen for 20 min, and the GCE electrodes were polished with 0.3–0.05 μm alumina slurry (Gaoss Union, Wuhan) and sonicated in water, ethanol and water, respectively, and then rinsed thoroughly with ultrapure water and dried under nitrogen flow.ECL experiments were performed on an MPI-E multifunctional electrochemical and chemiluminescent analytical system with a Pdot modified glassy carbon electrode (GCE, 5 mm in diameter) as the working electrode, platinum wire as the counter electrode and an Ag/AgCl electrode as the reference electrode. The Pdot modified GCEs were prepared by casting 20 μL of 50 μg mL−1P-1 to P-3 and model polymer Pdot aqueous solution on a clean GCE surface and drying at room temperature, respectively. ECL measurements were performed in 0.1 M PBS, pH 7.4, containing 0.1 M KNO3 and 0.1 M co-reactant. The ECL spectra were acquired by applying a constant potential of +1.424 V for a duration of 10 s for P-1 Pdots in 0.1 M PBS, pH 7.4, containing 0.1 M KNO3 and 0.1 M TPrA.
Results and discussion
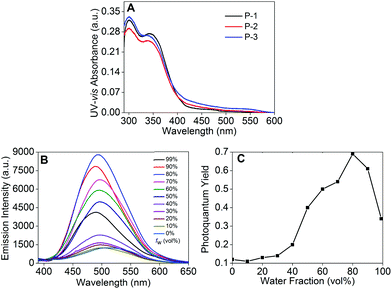
Three P-1 to P-3 Pdots could be prepared according to the method from our previous work using P-1 to P-3 as luminescent precursors and poly(styrene-co-maleic anhydride) (PSMA) as the functional reagent.24 In the preparation process, PSMA could produce carboxyl groups as the hydrophilic group on the surface of the Pdots, which was beneficial for the stability of Pdots in aqueous solution. The TEM images of P-1 to P-3 Pdots indicated that their average diameters are in the range of 20 to 40 nm as shown in Fig. 1.The UV-vis absorption spectra of P-1 to P-3 showed two absorbance peaks situated at 300 and 340 nm (Fig. 2A). The peak at 300 nm could be assigned to the cross-shaped conjugation structure formed by the carbazole moiety,25 and the shoulder peak at 340 nm could be attributed to the carbazole moiety (Fig. 2A).23a,26 Meanwhile, another weak broad absorbance peak appeared in the long wavelength region from 430 to 570 nm, indicating the successfully formed D–A type system between the electron-donating carbazole moiety and the electron-accepting DFPDB group.13c We also observed that these kinds of absorption bands gradually enhanced from P-1 to P-3, which could be attributed to the stronger D–A structure system with the increase of the DFPDB ratio from 0.05 to 0.2. The fluorescence emission spectra of P-1 to P-3 are shown in Fig. 2B, Fig. S1 and S2,† respectively. P-1 exhibited a weak peak centered at 514 nm in THF solution, which could be assigned to the AIE-active TPE chromophore, and it gradually enhanced about 7 times as the water fraction (fw) increased from 0% to 80%. The highest photoquantum yield was found to be 0.69 (using 3.33 mg mL−1 quinine sulfate in a 0.1 M H2SO4 solution as a standard) (Fig. 2B). As was evident from the relationship between the fluorescence photoquantum yields and fw (Fig. 2C), its emission intensity showed an obvious decrease with the further increase of fw from 80% to 99%, which could be attributed to the low effective polymer concentration generated by large-sized aggregates in poor solvents.27 In addition, an approximately 25 nm blue shift was also observed from 514 nm to 489 nm in the aggregate state, indicating restricted conformational relaxation in the aggregate state.28
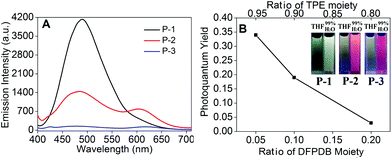
P-2 also showed obvious AIE behavior in THF–H2O mixed solution and a 38 nm blue shift similar to P-1 in the aggregate state (fw = 99%) (Fig. S1†). But the fluorescence emission of P-2 firstly decreased from fw = 0% to 50% due to its enhanced ICT process caused by the increase in the ratio of the DFPDB moiety. The additional fw enhanced the polarity of the microenvironment, which could stabilize the charge separation to reach the equilibrium to the ICT state.29 The increased DFPDB ratio of P-2 also led to a stronger ICT process compared with that of P-1, which showed another weak peak centered at 603 nm when fw = 90% to 99% and a much weaker aggregate emission than that of P-1 (Fig. S1†).29 In contrast, P-3 with the strongest ICT exhibited obvious ACQ behavior and emitted two very weak peaks at 480 nm and 618 nm when fw = 99% (Fig. S2†). From P-1 to P-3, the aggregate emission signals exhibited an obvious decline (Fig. 3A) due to both the reduction of the TPE moiety and the addition of the DFPDB moiety. To clearly demonstrate this mechanism, the relationship between the fluorescence photoquantum yields and the ratios of TPE and DFPDB moieties is outlined in Fig. 3B at fw = 99%. On the other hand, the addition of the electron acceptor DFPDB moiety induced a stronger ICT process, which could also lead to fluorescence emission quenching in the aggregate state.
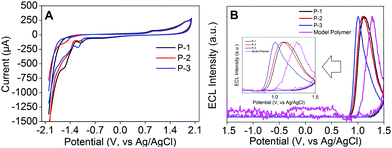
Electrochemical studies of P-1 to P-3, the model polymer and the TPE monomer were performed in CH2Cl2 with a concentration of 10 mg mL−1 and a bare GCE as the working electrode (Fig. 4). The energy levels could be calculated using the cyclic voltammogram (CV) data (Table 1). As shown in Fig. 4, P-1 exhibited two oxidation peaks at +0.814 V and +1.173 V with an onset oxidation potential of +0.657 V, which were similar to P-2 and P-3. Two one-electron oxidation peaks at +1.246 V and +1.549 V could be attributed to the oxidation of the TPE moiety.22,30 Similarly, the model polymer also showed two oxidation peaks at +0.937 V and +1.289 V of the TPE moiety with an onset oxidation potential of +0.801 V (Fig. 4). The oxidation potentials of P-1 to P-3 and the model polymer obviously were lower than those of the TPE monomer, demonstrating that the electron donating ability of the carbazole moiety could be extended to the whole conjugated backbone which led to their easier oxidation than the TPE monomer.
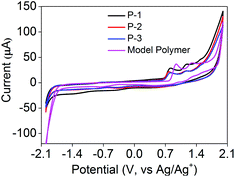 | ||
| Fig. 4 Cyclic voltammograms of P-1 to P-3 and the model polymer measured in 0.1 M Bu4NBF4 CH2Cl2 solution at a concentration of 50 μg mL−1, scan rate: 100 mV s−1. | ||
E
Oxonset![[thin space (1/6-em)]](https://www.rsc.org/images/entities/char_2009.gif) a (V) a (V) |
E
Redonset![[thin space (1/6-em)]](https://www.rsc.org/images/entities/char_2009.gif) a (V) a (V) |
HOMOb (eV) | LUMOb (eV) |
E
g![[thin space (1/6-em)]](https://www.rsc.org/images/entities/char_2009.gif) b (eV) b (eV) |
|
|---|---|---|---|---|---|
| a Potential versus Ag/Ag+ in CH2Cl2. b The energy levels were calculated using the following equations: EHOMO = −(EOxonset − EFc/Fc+ + 4.8) eV, ELUMO = −(ERedonset − EFc/Fc+ + 4.8) eV, and Eg = ELUMO − EHOMO. EFc/Fc+ was reported as +0.12 V vs. Ag/Ag+. | |||||
| P-1 | 0.657 | −1.733 | −5.337 | −2.947 | 2.390 |
| P-2 | 0.646 | −1.734 | −5.326 | −2.946 | 2.380 |
| P-3 | 0.631 | −1.738 | −5.311 | −2.942 | 2.369 |
| Model polymer | 0.803 | −1.678 | −5.483 | −3.002 | 2.481 |
P-1 to P-3 and the model polymer did not exhibit obvious reduction waves until reaching −1.733, −1.734, −1.738 and −1.678 V, respectively (Fig. 4A), which indicated that the electrons began to inject into the conjugated polymers to produce radical anions. The band gaps of P-1 to P-3 and the model polymer could be calculated using the CV data (Table 1) as 2.390, 2.380, 2.369 and 2.481 eV, respectively. Their optical band gaps could be calculated from their fluorescence spectra in THF solution via the formula: Eg = 1239.8/λ (eV) as 2.412 eV for P-1 (λem = 514 nm, Fig. 2B), 2.362 eV for P-2 (λem = 525 nm, Fig. S1†), 2.326 eV for P-3 (λem = 533 nm, Fig. S2†) and 2.450 eV for the model polymer (λem = 506 nm, Fig. S3†). The electrochemical gaps were quite close to their optical band gaps, demonstrating that the energy levels and band gaps calculated from CV data were reliable.31 The electrochemical band gaps of P-1 to P-3 were quite similar but obviously lower than that of the model polymer, which could be attributed to the D–A electronic systems.32
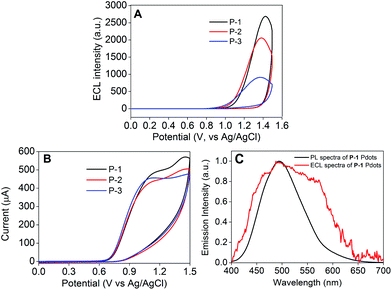
In N2-saturated 0.1 M PBS, pH 7.4, P-1 to P-3 Pdot modified electrodes all exhibited two oxidation peaks at +0.893 V and +1.900 V, which confirmed that all these Pdots could be electrochemically oxidized into radical cations (Fig. 5A). The ECL signals of the three Pdots all appeared in the anodic potential region, demonstrating that the radical anions of Pdots were more stable than the radical cations (Fig. 5B). P-1 to P-3 Pdot modified electrodes showed anodic ECL signals at +1.127, +1.087 and +1.006 V with onset potentials at +0.854, +0.834 and +0.824 V, respectively, while the ECL signal of the model polymer Pdot modified electrode appeared at +1.279 V with the onset potential at +1.036 V. Interestingly, P-1 to P-3 Pdot modified electrodes exhibited quite similar onset ECL potentials but about 200 mV lower than the model polymer Pdots, which could be attributed to the lower band gaps of P-1 to P-3 caused by their D–A type structure. The mechanism of the annihilation ECL emission process was proposed as eqn (1)–(4):
| Pdots + e− → Pdots˙− | (1) |
| Pdots − e− → Pdots˙+ | (2) |
| Pdots˙+ + Pdots˙− → Pdots* | (3) |
| Pdots* → Pdots + hv. | (4) |
In order to explore the effects of different coreactants, the ECL signals of P-1 to P-3 Pdot modified electrodes were measured by using four kinds of coreactants (Fig. 6A, Fig. S4 and S5†). Among these coreactants, we found that only TPrA could greatly enhance their ECL response signals (Fig. 6A). Upon the participation of TPrA, the Pdot modified electrodes exhibited strong ECL signals at +1.434 V for P-1, +1.394 V for P-2 and +1.374 V for P-3 with onset potentials of +0.817, +0.787 and +0.767 V, respectively. The detailed ECL mechanism of the resulting Pdots in the TPrA coreactant system is outlined as the following processes:21b
| TPrA − e− → TPrAH˙+ | (5) |
| TPrAH˙+ − H+ → TPrA˙ | (6) |
| Pdots − e− → Pdots˙+ | (7) |
Pdots˙+ + TPrA˙ → Pdots* + Pr2N+HC![[double bond, length as m-dash]](https://www.rsc.org/images/entities/char_e001.gif) CH2CH3 CH2CH3 | (8) |
| Pdots* → Pdots + hv. | (9) |
The CV waves of P-1 to P-3 Pdot modified and bare electrodes could demonstrate the detailed ECL process with TPrA as the coreactant (Fig. 6B and S6†). Firstly, the coreactant TPrA could be oxidized into TPrAH˙+ between +0.559 and +1.308 V (eqn (5)). After undergoing the deprotonation process, it gave TPrA˙ as a strong reducing substance (eqn (6)). When the potential was >1.20 V, the Pdots could be oxidized as Pdot radical cations (eqn (7)). Then electrons could inject into the LUMO level of Pdot radical cations from TPrA˙ to afford the excited species (eqn (8)). Finally, the excited species decayed back to the ground state and emitted ECL signals (eqn (9)).
As is evident from Fig. 6C, the ECL spectrum of the P-1 Pdot modified electrode showed an emission peak centered at 493 nm, similar to its fluorescence emission, indicating the same excited species in both ECL and fluorescence emission processes. Therefore, the ECL emission mechanism of Pdots could be regarded as the band gap emission process.33 In Fig. 6A, it is clearly observed that the ECL signals could be greatly amplified by increasing the ratio of the AIE-active TPE moiety from P-3 to P-1 Pdots. P-1 Pdots with the highest TPE ratio (0.95) emitted the strongest ECL signal, which was 3 times stronger than that of P-3 Pdots with the lowest TPE ratio (0.80). This kind of change in feature was quite coincident with their fluorescence emission behavior in the aggregate state (Fig. 3B), which could be well demonstrated by their same excited species in the ECL and fluorescence emission processes. Similar to fluorescence signals, the amplification of ECL emission signals from P-3 Pdots to P-1 Pdots could be attributed to two reasons: (i) the increase of the AIE-active TPE moiety and (ii) the weaker ICT effect from the decreased ratio of the electron acceptor DFPDB moiety.
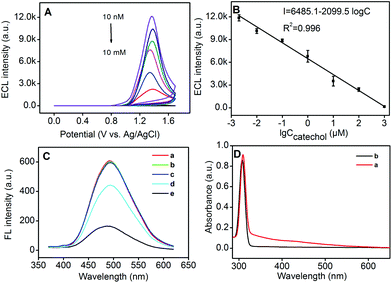
Herein, we further chose P-1 Pdots as the ECL biosensor for the detection of catechol, epinephrine and dopamine. After different concentrations of catechol were mixed with 25 μg mL−1P-1 Pdots, the ECL signals could be nonlinearly quenched with the increase of the catechol concentration (Fig. 7A). Otherwise, a good linear relationship could be observed between the ECL intensity and the logarithmic value of the catechol concentration from 2 nM to 1 mM (Fig. 7B) with the detection limit as 1 nM (S/N = 3). The relative standard deviation (RSD) was 7.5% for five measurements in 1.0 μM catechol, indicating good precision and reproducibility.
As described in previous literature reports, oxidation of catechol and catechol derivatives could produce o-benzoquinone species, which were able to efficiently quench the PL emission of QDs or silole-containing Pdots by the energy transfer process, and not the charge-transfer process.34 This mechanism could be confirmed by increasing the concentration of catechol and oxidized catechol. The PL emission of Pdots could only be quenched by oxidized catechol instead of catechol (Fig. 7C). Thus, during the anodic scan, catechol was oxidized into oxidized catechol as an efficient quencher, which was also demonstrated by its UV-vis absorption spectra (Fig. 7D). The oxidized catechol exhibited a broad absorbance from 330 nm to 590 nm (Fig. 7D, curve a) which significantly overlapped with the fluorescence emission spectrum of Pdots (Fig. 6C), while catechol did not exhibit any absorbance in this region (Fig. 7D, curve b).
As catechol derivatives, epinephrine and dopamine could also efficiently quench the anodic ECL emission of Pdots. The ECL intensity vs. the logarithmic value of the substance concentration showed a linear range of 10 nM to 500 μM and 10 nM to 100 μM with detection limits as 3 nM and 7 nM for epinephrine and dopamine, respectively (Fig. S7A and B†). Their ECL quenching mechanisms could be also assigned to the energy transfer process between the oxidized product and Pdots (Fig. S7C and D†). The specificity of this method was further investigated by adding ascorbic acid (AA) and uric acid (UA) as interferents in the detection solution. A comparison of the quenching efficiency of 84.5% with 50 μM dopamine (Fig. S7B†), AA, and UA as the interferents at the same concentration gave the quenching efficiency of 5.2% and 6.1%, respectively (Fig. S8†), indicating the acceptable practicability of the proposed method for dopamine detection in complex samples.
Conclusions
In summary, D–A type three-component conjugated polymers could show obvious AIE behavior at higher ratios (0.95 and 0.9) of the AIE-active TPE moiety. Most importantly, the ECL response signals of Pdots could be greatly amplified as high as 3 times by increasing the ratio of the AIE-active TPE moiety. The resulting P-1 Pdots with the strongest ECL signal could be chosen as ECL biosensors for the detection of catechol, dopamine and epinephrine with detection limits as 1, 7 and 3 nM, respectively. This work provides a novel strategy for developing highly sensitive ECL biosensors via the smart design of the D–A type AIE-active Pdots.Conflicts of interest
There are no conflicts to declare.Acknowledgements
This work was supported by the National Natural Science Foundation of China (21674046, 51673093, 21635005, and 21361162002), and the State Key Laboratory of Analytical Chemistry for Life Science (SKLACLS1807).Notes and references
- (a) S. Dalapati, C. Gu and D. L. Jiang, Small, 2016, 12, 6513–6527 CrossRef CAS PubMed; (b) J. Mei, N. L. C. Leung, R. T. K. Kwok, J. W. Y. Lam and B. Z. Tang, Chem. Rev., 2015, 115, 11718–11940 CrossRef CAS PubMed.
- C. Y. Chan, Z. Zhao, J. W. Y. Lam, J. Liu, S. Chen, P. Lu, F. Mahtab, X. Chen, H. H. Y. Sung, H. S. Kwok, Y. Ma, I. D. Williams, K. S. Wong and B. Z. Tang, Adv. Funct. Mater., 2012, 22, 378–389 CrossRef CAS.
- M. Y. Wong and E. Zysman-Colman, Adv. Mater., 2017, 29, 1605444 CrossRef PubMed.
- J. Roose, B. Z. Tang and K. S. Wong, Small, 2016, 12, 6495–6512 CrossRef CAS PubMed.
- (a) N. Sun, K. Su, Z. Zhou, X. Tian, J. Zhao, D. Chao, D. Wang, F. Lissel, X. Zhao and C. Chen, Macromolecules, 2019, 52, 5131 CrossRef CAS; (b) N. Sun, K. Su, Z. Zhou, X. Tian, D. Wang, N. Vilbrandt, A. Fery, F. Lissel, X. Zhao and C. Chen, J. Mater. Chem. C, 2019, 7, 9308–9315 RSC; (c) H. T. Lin, C. L. Huang and G. S. Liou, ACS Appl. Mater. Interfaces, 2019, 11, 11684 CrossRef CAS PubMed.
- (a) X. D. Lou, Z. J. Zhao and B. Z. Tang, Small, 2016, 12, 6430–6450 CrossRef CAS PubMed; (b) X. Gu, R. T. K. Kwok, J. W. Y. Lam and B. Z. Tang, Biomater., 2017, 46, 155–135 Search PubMed.
- G. Yu, M. Zhang, M. L. Saha, Z. Mao, J. Chen, Y. Yao, Z. Zhou, Y. Liu, C. Gao, F. Huang, X. Y. Chen and P. J. Stang, J. Am. Chem. Soc., 2017, 139, 15940–15949 CrossRef CAS.
- X. J. Lv, W. J. Li, M. Ouyang, Y. J. Zhang, D. S. Wright and C. Zhang, J. Mater. Chem. C, 2017, 5, 12–28 RSC.
- R. Furue, T. Nishimoto, I. S. Park, J. Lee and T. Yasuda, Angew. Chem., Int. Ed., 2016, 55, 7171–7175 CrossRef CAS PubMed.
- W. Y. Lee, H. C. Wu, C. Lu, B. D. Naab, W. C. Chen and Z. Bao, Adv. Mater., 2017, 29, 1605166 CrossRef PubMed.
- J. S. Wu, S. W. Cheng, Y. J. Cheng and C. S. Hsu, Chem. Soc. Rev., 2015, 44, 1113–1154 RSC.
- T. T. Steckler, P. Henriksson, S. Mollinger, A. Lundin, A. Salleo and M. R. Andersson, J. Am. Chem. Soc., 2014, 136, 1190–1193 CrossRef CAS.
- (a) A. Loudet and K. Burgess, Chem. Rev., 2007, 107, 4891–4932 CrossRef CAS PubMed; (b) I. S. Tamgho, A. Hasheminasab, J. T. Engle, V. N. Nemykin and C. J. Ziegler, J. Am. Chem. Soc., 2014, 136, 5623–5626 CrossRef CAS; (c) R. Yoshii, A. Hirose, K. Tanaka and Y. Chujo, J. Am. Chem. Soc., 2014, 136, 18131–18139 CrossRef CAS PubMed.
- A. Felouat, A. D'Aléo and F. Fages, J. Org. Chem., 2013, 78, 4446–4455 CrossRef CAS.
- L. L. Li, Y. Chen and J. J. Zhu, Anal. Chem., 2017, 89, 358–371 CrossRef CAS.
- J. J. Xu, P. Y. Huang, Y. Qin, D. C. Jiang and H. Y. Chen, Anal. Chem., 2016, 88, 4609–4612 CrossRef CAS PubMed.
- (a) S. Carrara, F. Arcudi, M. Prato and L. De Cola, Angew. Chem., Int. Ed., 2017, 56, 4757–4761 CrossRef CAS; (b) T. Watanabe, A. Fiorani, G. Valenti, F. Paolucci and Y. Einaga, J. Am. Chem. Soc., 2016, 138, 15636–15641 CrossRef.
- S. G. Ge, F. F. Lan, L. L. Liang, N. Ren, L. Li, H. Y. Liu, M. Yan and J. Yu, ACS Appl. Mater. Interfaces, 2017, 9, 6670–6678 CrossRef CAS.
- T. Y. Wang, D. C. Wang, J. W. Padelford, J. Jiang and G. L. Wang, J. Am. Chem. Soc., 2016, 138, 6380–6383 CrossRef CAS PubMed.
- (a) A. B. Nepomnyashchii, M. Bröring, J. Ahrens and A. J. Bard, J. Am. Chem. Soc., 2011, 133, 8633–8645 CrossRef CAS PubMed; (b) H. L. Qi, J. H. Chang, S. H. Abdelwahed, K. Thakur, R. Rathore and A. J. Bard, J. Am. Chem. Soc., 2012, 134, 16265–16274 CrossRef CAS PubMed.
- (a) S. Carrara, A. Aliprandi, C. F. Hogan and L. De Cola, J. Am. Chem. Soc., 2017, 139, 14605–14610 CrossRef CAS; (b) K. M. Omer, S. Y. Ku, J. Z. Cheng, S. H. Chou, K. T. Wong and A. J. Bard, J. Am. Chem. Soc., 2011, 133, 5492–5499 CrossRef CAS.
- Z. Y. Wang, Y. Q. Feng, N. N. Wang, Y. X. Cheng, Y. W. Quan and H. X. Ju, J. Phys. Chem. Lett., 2018, 9, 5296–5302 CrossRef CAS PubMed.
- (a) L. Zhang, S. H. Zeng, L. X. Yin, C. Y. Ji, K. C. Li, Y. Q. Li and Y. Wang, New J. Chem., 2013, 37, 632–639 RSC; (b) S. W. Zhang, Y. Sheng, G. Wei, Y. W. Quan, Y. X. Cheng and C. J. Zhu, Polym. Chem., 2015, 6, 2416–2422 RSC.
- Y. Q. Feng, C. H. Dai, J. P. Lei, H. X. Ju and Y. X. Cheng, Anal. Chem., 2016, 88, 845–850 CrossRef CAS.
- (a) H. H. Sung and H. C. Lin, Macromolecules, 2004, 37, 7945–7954 CrossRef CAS; (b) M. J. Ahrens, L. E. Sinks, B. Rybtchinski, W. Liu, B. A. Jones, J. M. Giaimo, A. V. Gusev, A. J. Goshe, D. M. Tiede and M. R. Wasielewski, J. Am. Chem. Soc., 2004, 126, 8284–8294 CrossRef CAS.
- X. Ma, E. A. Azeem, X. H. Liu, Y. X. Cheng and C. J. Zhu, J. Mater. Chem. C, 2014, 2, 1076–1084 RSC.
- (a) E. Wang, J. W. Y. Lam, R. Hu, C. Zhang, Y. S. Zhao and B. Z. Tang, J. Mater. Chem. C, 2014, 2, 1801–1807 RSC; (b) A. Ekbote, S. M. Mobin and R. Misra, J. Mater. Chem. C, 2018, 6, 10888–10901 RSC.
- (a) Y. Hong, J. W. Y. Lam and B. Z. Tang, Chem. Soc. Rev., 2011, 40, 5361–5388 RSC; (b) H. Liu, L. Wang, H. Gao, H. L. Qi, Q. Gao and C. Zhang, ACS Appl. Mater. Interfaces, 2017, 9, 44324–44331 CrossRef CAS.
- (a) J. Mei, J. Z. Sun, A. Qin and B. Z. Tang, Dyes Pigm., 2017, 141, 366–378 CrossRef CAS; (b) M. Pannipara, A. M. Asiri, K. A. Alamry, M. N. Arshad and S. A. El-Daly, Spectrochim. Acta, Part A, 2015, 136, 1893–1902 CrossRef CAS PubMed.
- A. Schreivogel, J. Maurer, R. Winter, A. Baro and S. Laschat, Eur. J. Org. Chem., 2006, 3395–3404 CrossRef CAS.
- (a) C. M. Cardona, W. Li, A. E. Kaifer, D. Stockdale and G. C. Bazan, Adv. Mater., 2011, 23, 2367–2371 CrossRef CAS PubMed; (b) Y. Li, Y. Cao, J. Gao, D. Wang, G. Yu and A. J. Heeger, Synth. Methods, 1999, 99, 243–248 CrossRef CAS.
- L. Yang, M. Li, J. Song, Y. Zhou, Z. Bo and H. Wang, Adv. Funct. Mater., 2018, 28, 1705927 CrossRef.
- Y. Bae, N. Myung and A. J. Bard, Nano Lett., 2004, 4, 1153–1161 CrossRef CAS.
- (a) R. Gill, R. Freeman, J. P. Xu, I. Willner, S. Winograd, I. Shweky and U. Banin, J. Am. Chem. Soc., 2006, 128, 15376–15377 CrossRef CAS PubMed; (b) X. Liu, H. Jiang, J. P. Lei and H. X. Ju, Anal. Chem., 2007, 79, 8055–8060 CrossRef CAS PubMed.
Footnotes |
| † Electronic supplementary information (ESI) available. See DOI: 10.1039/c9an01992h |
| ‡ These authors contributed equally to this work. |
| This journal is © The Royal Society of Chemistry 2020 |

