 Open Access Article
Near infrared dye loaded copper sulfide-apoferritin for tumor imaging and photothermal therapy
Yuanyuan He†
a,
Yuanzhi Shen†a,
Siqi Zhoub,
Yihui Wuc,
Zhenwei Yuana,
Chen Weia,
Lijuan Guia,
Yisha Chena,
Yueqing Gua and
Haiyan Chen *a
*a
aDepartment of Biomedical Engineering, School of Engineering, State Key Laboratory of Natural Medicines, China Pharmaceutical University, 24 Tongjia Lane, Gulou District, Nanjing 210009, China. E-mail: chenhaiyan@cpu.edu.cn; Fax: +86-25-83271046; Tel: +86-25-83271080
bJSerra Catholic High School, 26351 Junipero Serra Road, San Juan Capistrano, CA 92675
cAnglo-Chinese School International, 61 Jln Hitam Manis, Singapore 278475
First published on 17th April 2018
Abstract
Development of photothermal agents for imaging-guided photothermal therapy (PTT) has been of great interest in the field of nanomedicine. CuS-apoferritin was prepared by a biomimetic synthesis method by using the inside cavity of apoferritin to control the size of CuS nanoparticles. Then, a water-soluble near infrared (NIR) dye (MBA) was bound with CuS-apoferritin, forming a nanocomplex (CuS-apoferritin-MBA) with greatly enhanced photothermal conversion efficiency compared to CuS-apoferritin. The unique optical behavior of CuS-apoferritin-MBA enables fluorescence imaging and photothermal therapy at separated optical wavelengths both, with optimized performances. CuS-apoferritin-MBA was then utilized as a photothermal agent for imaging-guided photothermal therapy in tumor-bearing mouse models. As revealed by in vivo fluorescence imaging, CuS-apoferritin-MBA showed high tumor uptake owing to an enhanced permeability and retention effect and the active targeting of apoferritin. In vivo photothermal therapy experiments indicated that tumors could be ablated by combining CuS-apoferritin-MBA with irradiation of an 808 nm laser. Thus, our work presents a safe, simple photothermal nanocomplex, promising for future clinical translation in cancer treatment.
1. Introduction
Photothermal therapy (PTT) is considered to be a highly selective and minimal invasive method for cancer.1,2 Near-infrared (NIR) light sources are usually used to irradiate photothermal agents accumulated in a tumor, and the heat generated can effectively kill targeted cells without damaging the normal cells. To achieve effectively personalized PTT treatment, the photothermal agents should be provided with good biocompatibility and high tumor targeting ability.3,4In the past decade, a variety of nanomaterials with strong NIR absorbance have been used as PTT agents; examples include indocyanine green (ICG),5 carbon nanomaterials (carbon nanotubes, nanographene),6–8 metal nanoparticle NPs (Ag, Pd, and Ge), gold nanomaterials (nanoshells, nanorods, and nanocages),9–11 semiconductors (Cu2−xSe and CuS) NPs,12,13 and palladium nanosheets.14,15 Although many of the above materials have shown high efficacy for cancer therapy in animal experiments, the nonbiodegradable nature of most of these inorganic PTT agents has significantly hampered their clinical applications due to concerns regarding their potential long-term toxicity. Recently, a number of organic conjugated nanomaterials have also attracted significant attention as PTT agents.16–19
Apoferritin, free iron ions of ferritin, is a four-helix bundle protein of around 200 amino acids that forms a cage of 24 subunits arranged in octahedral 432 symmetry,20 with an outer diameter of roughly 12 nm and an inner diameter of 8 nm. Apoferritin cages can be reversibly disassembled when the pH becomes extremely acidic (pH 2–3) or basic (pH 10–12).21,22 Moreover, the ferritin cage is resistant to denaturants, including heating to high temperatures (>80 °C).23 The hollow cavity of apoferritin is a perfect nanoreactor with a fixed volume for biomimetic synthesis. Last but not least, ferritin itself showed superior tumor targeting capability.24 In addition, apoferritin, can specifically bind to cells expressing transferrin receptor 1 (TfR1), a potential new target in cases of human leukemia and lymphoma.25,26 In addition to its favorable encapsulation capacity, apoferritin can also bind specifically to different cells due to the presence of ferritin receptors on the surfaces of various cells.27,28 In addition to SCARA5,29 only one FRT receptor in human cells, TfR1, has been shown to bind both FRT (via binding with H-subunit of the protein) and transferrin. The internalization of apoferritin is performed by receptor-mediated endocytosis during the acidification of endosome; thus, the cargo is released gradually.
In this paper, water-soluble CuS NPs were selected as an effective photothermal agent due to their strong NIR photothermal conversion efficiency. Apoferritin was used as a biotemplate to control the size and enhance biocompatibility of CuS. Moreover, a NIR dye (MBA) was used to increase photothermal efficiency. Both cells and mouse models were successfully used to evaluate the effectiveness of CuS apoferritin-MBA guided photothermal therapy. This nanocomplex CuS-apoferritin-MBA proved to have a promising potential for clinically transferable imaging based photothermal therapy.
2. Materials and methods
2.1. Materials
Apoferritin and CuCl2·2H2O were purchased from Sigma-Aldrich (MO, USA). Na2S was purchased from Sinopharm Chemical Reagent Co., Ltd. MBA (MW = 768) was synthesized in our laboratory. 1-Ethyl-3-[3-dimethylaminopropyl] carbodiimide hydrochloride (EDC) and N-hydroxysuccinimide (NHS) were purchased from Bide Pharmatech Ltd. (Shanghai, China). 3-(4,5-Dimethylthialzol-2-yl)-2,5-diphenyltetrazolium bromide (MTT), RPMI-1640, fetal bovine serum (FBS), penicillin, streptomycin, and trypsin–EDTA were purchased from Gibco (Life Technologies, Shanghai, China). The reagents in this study were used without further purification.2.2. Synthesis of CuS-apoferritin nanoparticles
CuS-apoferritin NPs were synthesized according to a previous report with some modifications.30 0.25 mL of CuCl2·2H2O (25 mM) solution was added into 0.5 mL of 1.0 mg mL−1 apoferritin with forceful stirring for 1 h, and then the solution was kept at room temperature for another 20 min. Apoferritin-Cu2+ mixture was purified by filtration through a 10 kDa cutoff spin by using 0.1% sodium acetate solution as eluent and redissolved in 0.5 mL of ultrapure water with sonication. Then, 0.25 mL of Na2S (25 mM) aqueous solution was added to the above solution with stirring at 60 °C for 1 h. The mixture then was transferred to an ice bath to stop the reaction. The product was purified with filtration through a 100 kDa cutoff, and then redissolved in ultrapure water with sonication for further use.2.3. Synthesis of CuS-apoferritin-MBA nanocomplex
Synthesis methods and characterization of the 2-((E)-2-((E)-2-((2-carboxyethyl)thio)-3-(2-((E)-3,3-dimethyl-1-(3-sulfopropyl)indolin-2-ylidene) ethylidene)cyclohex-1-en-1-yl)vinyl)-3,3-dimethyl-1-(3-sulfopropyl)-3H-indol-1-ium (MBA), was reported earlier by our research group.31 MBA was immobilized onto CuS-apoferritin using coupling agents (EDC and NHS) to increase the reaction yield. MBA (1.0 mg) in 1.0 mL of PBS was activated with EDC and NHS (molar ratio of MBA![[thin space (1/6-em)]](https://www.rsc.org/images/entities/char_2009.gif) :
:![[thin space (1/6-em)]](https://www.rsc.org/images/entities/char_2009.gif) EDC
EDC![[thin space (1/6-em)]](https://www.rsc.org/images/entities/char_2009.gif) :
:![[thin space (1/6-em)]](https://www.rsc.org/images/entities/char_2009.gif) NHS is 1
NHS is 1![[thin space (1/6-em)]](https://www.rsc.org/images/entities/char_2009.gif) :
:![[thin space (1/6-em)]](https://www.rsc.org/images/entities/char_2009.gif) 1.5
1.5![[thin space (1/6-em)]](https://www.rsc.org/images/entities/char_2009.gif) :
:![[thin space (1/6-em)]](https://www.rsc.org/images/entities/char_2009.gif) 1.5) at room temperature in the dark for 2 h. Then, 200 μL of activated solution of MBA was added into CuS-apoferritin aqueous solution (1 mg mL−1) and stirred in the dark for 12 h. The CuS-apoferritin-MBA nanocomplexes were obtained after dialyzing the solution in a dialysis bag (MWCO 8000–14000).
1.5) at room temperature in the dark for 2 h. Then, 200 μL of activated solution of MBA was added into CuS-apoferritin aqueous solution (1 mg mL−1) and stirred in the dark for 12 h. The CuS-apoferritin-MBA nanocomplexes were obtained after dialyzing the solution in a dialysis bag (MWCO 8000–14000).
2.4. Morphology and optical characterization
The morphology of CuS-apoferritin and CuS-apoferritin-MBA were studied using a FEI Tecnai G2F20 transmission electron microscope (TEM) with a 200 kV field emission gun. The TEM samples were prepared by drop casting an aqueous solution of CuS-apoferritin and CuS-apoferritin-MBA (500 μg mL−1) onto 400-mesh carbon-coated copper grids and the excessive solvent was immediately and fully evaporated before the TEM investigation. The absorption and fluorescence spectra of these samples (apoferritin, CuS-apoferritin, MBA and CuS-apoferritin-MBA) were detected by using a Lambda 25 UV-vis spectrophotometer (PE, US) and fluorescence spectrometer (PE, US), respectively. The Fourier transform infrared (FTIR) spectra of CuS-apoferritin and CuS-apoferritin-MBA were recorded by FTIR spectrometer (Nicolet ECO 2000, USA).2.5. Cellular experiments
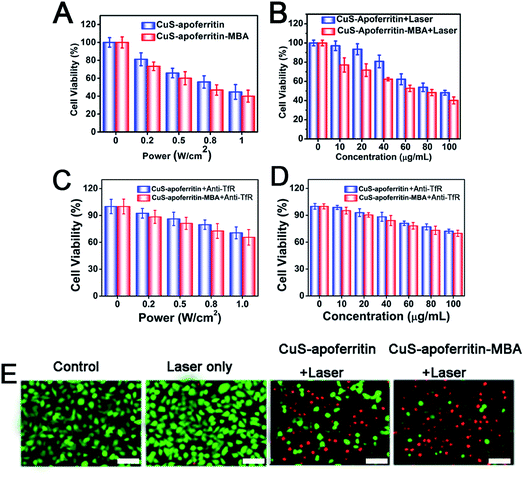
Next, in order to investigate the tumor targeting of CuS-apoferritin and CuS-apoferritin-MBA, U87 MG cells were incubated with 100 μL of anti-TfR for 30 min, followed by incubating with CuS-apoferritin (100 μg mL−1) and CuS-apoferritin-MBA (100 μg mL−1) for 4 h. Then, the cells were irradiated by an 808 nm laser at different power densities (0.5, 0.8, and 1.0 W cm−2) for 4 min before the MTT assay. Furthermore, U87 MG cells were incubated with 100 μL of anti-TfR for 30 min followed by incubating CuS-apoferritin and CuS-apoferritin-MBA with different concentrations (10 μg mL−1, 20 μg mL−1, 40 μg mL−1, 60 μg mL−1, 80 μg mL−1, and 100 μg mL−1) were also detected for evaluation of their photothermal effects. Then, the cells were irradiated by an 808 nm laser at power densities of 1 W cm−2.
For normal apoptotic and necrotic cell analysis, U87MG cells were seeded in 24 well plates. When the whole cells took up 70–80% space of the culture dishes, they were incubated with CuS-apoferritin (200 μg mL−1) and CuS-apoferritin-MBA (200 μg mL−1) for 4 h. Then, the cells were irradiated by an 808 nm laser at power densities of 1 W cm−2. The cells were incubated at 37 °C with 5% CO2 for another 2 h. Then, the cells were stained with Calcein AM/PI (10 μg mL−1) and incubated at 37 °C for 20 min. After the cells were washed twice with PBS, they were imaged by a Leica fluorescent microscope (DM 5000B, Germany).
2.6. Infrared thermal imaging
Normal (Kunming) mice were purchased from Charles River Laboratories (Shanghai, China) for in vivo imaging investigations. All animal experiments were carried out in compliance with the Animal Management Rules of the Ministry of Health of the People's Republic of China (document no. 55, 2001) and approved by the Animal Ethics Committee of China Pharmaceutical University (Nanjing, China).Tumor-bearing mouse models were obtained by subcutaneously injecting EAC tumor cells (∼5 × 10⁶ in 50 μL of PBS) into axillary fossa of the mice. When the tumor volumes reached about 100–200 mm3, the mice were immobilized for in vivo infrared thermal imaging.
50 μL of PBS, CuS-apoferritin and CuS-apoferritin-MBA were injected into tumor-bearing mice via intratumor injection. An 808 nm laser (1.0 W cm−2) was employed to perpendicularly irradiate the injected areas of mice, respectively. The infrared thermographic maps and changes were recorded by an infrared thermal imaging camera (Fluke, USA) at different time intervals (0 min, 1 min, 3 min, 5 min, and 8 min).
2.7. Subcutaneous tumor model for imaging and therapy
2.8. Statistical analysis
Significant differences were determined using the Student's t test where differences were considered significant when p < 0.05. All data are expressed as mean ± standard error of the mean.3. Results and discussion
3.1. Synthesis and characterization of CuS-apoferritin-MBA nanocomplex
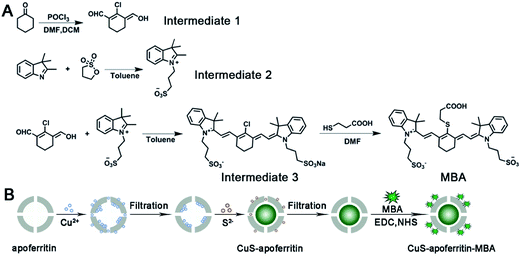
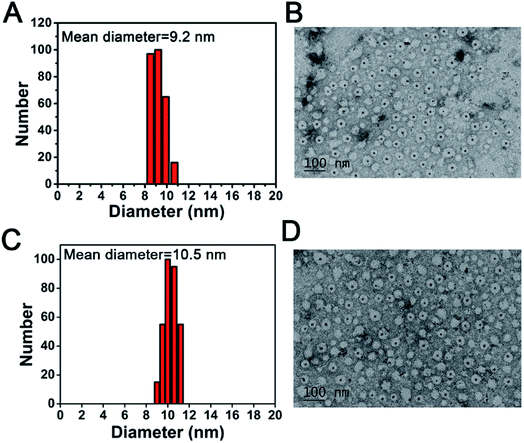
The detailed synthesis route of MBA and CuS-apoferritin-MBA nanocomplex is shown in Fig. 1A and B. Apoferritin was used as a biotemplate to synthesize and control the size of CuS. Apoferritin has a functional carboxyl group and amino group; herein, the activated carboxyl group of MBA was conjugated with the amino group of apoferritin via NHS/EDC.The size and morphology of CuS-apoferritin NCs were characterized by DLS and TEM. The TEM image shown in Fig. 2A presents an explicit spherical nanocage with a diameter around 12 nm. With the formation of CuS nanoparticles inside apoferritin nanocages, the core of apoferritin turns to black due to the high electron quantity of CuS NPs. The diameter distribution of CuS-apoferritin was obtained by statistically measuring their sizes in the TEM images using the plugin in Gatan Digital Micrograph (Fig. 2B). The mean diameter was calculated as 9.2 ± 0.387 nm. The TEM image shown in Fig. 2C presents an explicit spherical nanocage of CuS-apoferritin-MBA; the mean diameter was calculated as 10.5 ± 0.252 nm. There was no significant increase in particle size of CuS-apoferritin-MBA (Fig. 2D).
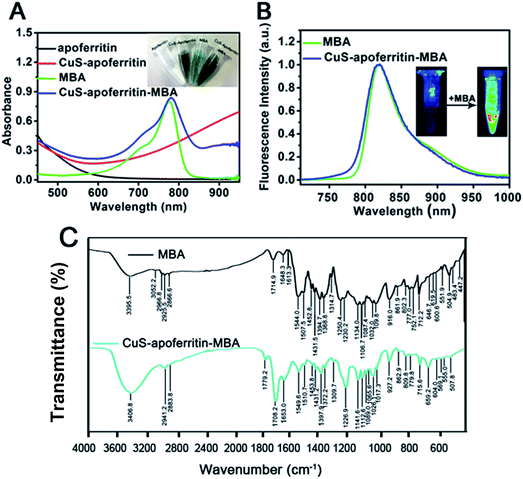
As shown in Fig. 3A, CuS-apoferritin nanoparticles have strong absorbance in the infrared region while apoferritin has no absorption. MBA and CuS-apoferritin-MBA (dissolved in PBS, pH = 7.4) all had a strong absorption at 780 nm. As shown in Fig. 3B, MBA has a strong emission peak at around 810 nm and CuS-apoferritin-MBA has the similar emission peak around 810 nm in PBS. No absorption peaks were observed for CuS-apoferritin. As shown in Fig. 3C, a new peak at 1708.2 cm−1 appears after MBA conjugates with CuS-apoferritin. This peak is attributed to the formation of –C![[double bond, length as m-dash]](https://www.rsc.org/images/entities/char_e001.gif) O– of the amido bond (–NHCO–). Vibration of the benzene skeleton causes additional peaks (1549.6 cm−1, 1653 cm−1), verifying the successful link of MBA to CuS-apoferritin. The peak at 779.8 cm−1 shows that the benzene ring is para-substituted, which is consistent with the structure of MBA. These results all can confirm the successful conjugation of MBA with CuS-apoferritin.
O– of the amido bond (–NHCO–). Vibration of the benzene skeleton causes additional peaks (1549.6 cm−1, 1653 cm−1), verifying the successful link of MBA to CuS-apoferritin. The peak at 779.8 cm−1 shows that the benzene ring is para-substituted, which is consistent with the structure of MBA. These results all can confirm the successful conjugation of MBA with CuS-apoferritin.
3.2. Photothermal effect of CuS-apoferritin and CuS-apoferritin-MBA
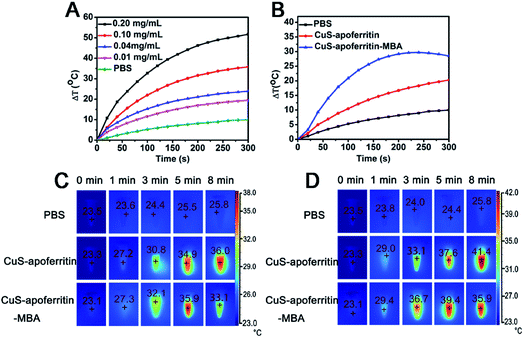
The temperature changes of CuS-apoferritin and CuS-apoferritin-MBA during NIR laser irradiation (0.8 W cm−2, 808 nm) were monitored. As shown in Fig. 4A, CuS-apoferritin possessed a temperature rise profile that is concentration dependent. For the different CuS-apoferritin aqueous solutions (10, 20, 40, 80, 100, and 200 μg mL−1), the temperature increased (from 19.5 to 51.7 °C) at different scopes after 5 minutes of irradiation. At the concentration of 10 μg mL−1, a temperature rise of over 13 °C was observed after 2 min of irradiation. At a higher concentration of 200 μg mL−1, the temperature increased 36.3 °C. Moreover, the maximum temperature increases of CuS-apoferritin (100 μg mL−1) and CuS-apoferritin-MBA (100 μg mL−1) are 20.3 and 28.5 °C, respectively (Fig. 4B). These results revealed that CuS-apoferritin and CuS-apoferritin-MBA can be used as efficient PTT agents for tumor hyperthermia.The infrared thermal images of CuS-apoferritin and CuS-apoferritin-MBA aqueous solution after 808 nm laser light irradiation for different times (1, 3, 5, and 8 min) or different concentrations (100 and 200 μg mL−1) are shown in Fig. 4C and D. During irradiation, temperature changes of the solutions were monitored by an IR thermal camera. After 1 min of irradiation, the temperatures of all the solutions were still below 30 °C. In comparison, a more significant temperature increase was noticed for the CuS-apoferritin-MBA (200 μg mL−1) solutions irradiated for more than 3 min, reaching a temperature of 36.7 °C throughout the irradiation period. After 5 min of irradiation, CuS-apoferritin-MBA (200 μg mL−1) solutions reached a temperature of nearly 40 °C, then the solutions' temperatures dropped, which can be attributed to the low-photo-stability of MBA.
3.3. In vitro cytotoxicity and cellular uptake studies
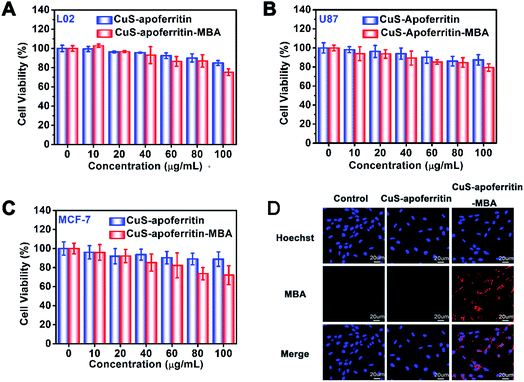
The in vitro toxicity of CuS-apoferritin-MBA on L02, U87MG and MCF-7 cell lines were studied in a concentration range of 10 to 100 μg mL−1. As indicated in Fig. 5A–C, all the cells maintained a high viability, even after incubation with these two nanoparticles at a high concentration (100 μg mL−1), verifying the good biocompatibility of these two nanoparticles.Next, the cellular uptake of CuS-apoferritin-MBA was tested on U87MG cells imaged by confocal microscopy (Fig. 5D). After 2 h of incubation, compared with CuS-apoferritin, CuS-apoferritin-MBA (100 μg mL−1) treated cells presented a significantly stronger red fluorescence, which demonstrated that MBA can provide useful fluorescence signals for imaging the distribution of CuS-apoferritin in cell levels.
3.4. In vitro photothermal cytotoxicity of CuS-apoferritin-MBA
To investigate photothermal cytotoxicity, CuS-apoferritin-MBA and CuS-apoferritin-MBA were utilized as photothermal agents for in vitro cancer cell ablation under laser irradiation. As shown in Fig. 6A and B, an enhanced cancer cell ablation was observed with an increase of laser power densities or the concentrations of CuS-apoferritin and CuS-apoferritin-MBA. As shown in Fig. 6C and D, the anti-TfR occupies the transferrin receptor so that CuS-apoferritin and CuS-apoferritin-MBA can't combine with transferrin receptor. The amount of CuS-apoferritin and CuS-apoferritin-MBA entering the cell was reduced, the thermal effect was lower, and there was not enough to kill more cancer cells; the cell viabilities were higher than CuS-apoferritin and CuS-apoferritin-MBA only.Fluorescent images of Calcine AM and PI co-stained cells further confirmed the effective and specific photothermal ablation of U87MG cells induced by CuS-apoferritin and CuS-apoferritin-MBA (Fig. 6E). Red fluorescence indicates dead cells and green fluorescence indicates live cells. Before 808 nm laser irradiation, the nanoparticles treated cells were alive. Once 808 nm laser was used to irradiate the CuS-apoferritin-MBA group, a large number of cells were scalded to death by thermal energy released from the CuS-apoferritin-MBA. These results illustrate the advantage of killing cancer cells by using CuS-apoferritin-MBA as a photothermal agent.
3.5. In vivo photothermal efficacy of CuS-apoferritin-MBA
To investigate photothermal therapeutic efficacy of CuS-apoferritin-MBA, 50 μL of PBS as control were injected into normal mice and tumor-bearing mice respectively. CuS-apoferritin and CuS-apoferritin-MBA were injected into the right lower limb of the normal mice, respectively, and CuS-apoferritin and CuS-apoferritin-MBA were also injected into the tumor in the tumor-bearing mice, respectively. As shown in Fig. 7A, within 5 min of laser irradiation, both the CuS-apoferritin and CuS-apoferritin-MBA groups had an obvious increase of temperature. But with the same laser irradiation time, the tumor temperature of CuS-apoferritin-MBA group was enhanced more highly than that of CuS-apoferritin groups (Fig. 7B). After 1 min of laser irradiation, the tumors treated with CuS-apoferritin and CuS-apoferritin-MBA had a temperature of 29.6 and 31.0 °C, respectively. After 5 min of laser irradiation, the temperature in the tumors increased to 36.3 and 40.4 °C for CuS-apoferritin and CuS-apoferritin-MBA groups respectively, which exceeds the damage threshold needed to induce irreversible tissue damage. However, the PBS-treated group in Fig. 7B only had a temperature increase of 3.4 °C, which is insufficient to damage tumor irreversibly.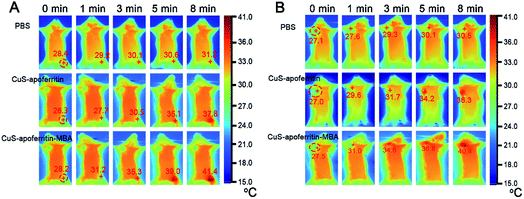 | ||
| Fig. 7 The infrared thermal images of (A) normal mice and (B) EAC tumor-bearing mice injected with the PBS, CuS-apoferritin and CuS-apoferritin-MBA. | ||
3.6. Biodistribution and tumor-targeting ability of CuS-apoferritin-MBA in vivo
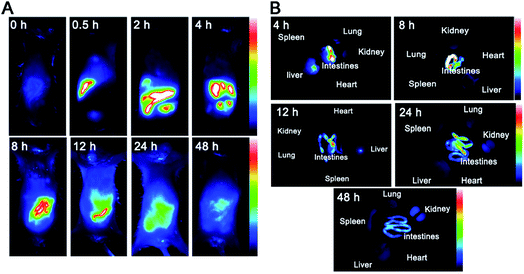
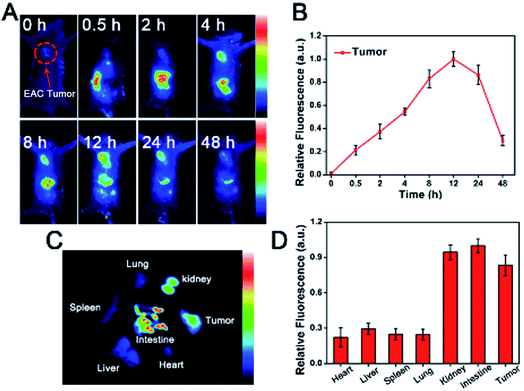
A NIR imaging approach was used to investigate tumor targeting and in vivo distribution of CuS-apoferritin-MBA in nude mice. Fig. 8A shows the dynamic distribution of CuS-apoferritin-MBA in normal mouse models at 0.5 h, 2 h, 4 h, 8 h, 12 h, 24 h, and 48 h post-injection. The obvious fluorescence signal appeared in the liver of the normal mice just after 0.5 h from injection; then, the fluorescence signal was observed in the intestine. The results suggested that CuS-apoferritin-MBA excreted from the mice through the liver-intestine excretion path way. To confirm the in vivo result, the mice were sacrificed and the main organs were collected and imaged at 4 h, 8 h, 12 h, 24 h, and 48 h (n = 5). Fig. 8B displays the in vitro fluorescence images of the main tissues from the CuS-apoferritin-MBA treated group at different post-injection times. Strong fluorescence signals appeared in intestine at each time interval.Tumor-bearing mice were utilized to investigate the tumor specificity of CuS-apoferritin-MBA. As shown in Fig. 9A, CuS-apoferritin-MBA initially spread over tumor-bearing mice body within 8 h of post-injection. The fluorescence signal reached peak intensity at 12 h. Fluorescence intensity in specific ROIs from tumors were collected to study the targeting efficacy of the probes semi-quantitatively (Fig. 9B). The maximum fluorescence of CuS-apoferritin-MBA arrived at 12 h post-injection, indicating CuS-apoferritin-MBA possesses good tumor targeting ability. The in vitro fluorescence images of the main tissues from CuS-apoferritin-MBA treated groups at 12 h post-injection are shown in Fig. 9C. Obviously, CuS-apoferritin-MBA treated group shows much strong fluorescence in tumors. And the semi-quantitative analysis demonstrates that there is obvious discrepancy of tumor fluorescence at different time intervals for CuS-apoferritin-MBA treated groups (Fig. 9D).
As an agent carrier, apoferritin may effectively carry a cargo towards a tumor due to high affinity with its specific receptors, TfR1. The apoferritin-encapsulated gadolinium was suggested by Makino et al. as a possible candidate for a new MRI contrast agent.32 Gadolinium was efficiently encapsulated into the apoferritin cavity and enhanced the T1 relativity to tenfold higher than the commercially used contrast agent gadolinium-DOTA. Moreover, the in vivo blood clearance time of apoferritin coated cargo can be prolonged. An increased accumulation of this complex was observed mainly in the tumor region due to active targeting via acceptor-ligand affinity and passive targeting via enhanced permeability and retention effects. We have shown that CuS-apoferritin-MBA can specifically target tumor cells that overexpress TfR1 (Fig. 5D). To confirm the specific binding of this nanocomposite in vivo, tumor imagings were performed on TfR1 overexpressed EAC tumor-bearing mouse models. As expected, EAC tumors showed significant fluorescence only after 4 h post-injection of CuS-apoferritin-MBA (Fig. 9A), indicating a specific binding of CuS-apoferritin-MBA to TfR1 on an animal level.
3.7. Therapy evaluation of CuS-apoferritin-MBA in tumor-bearing mice
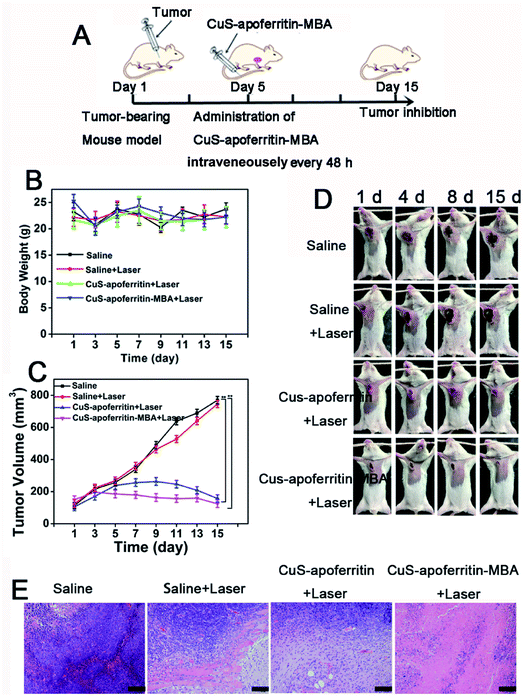
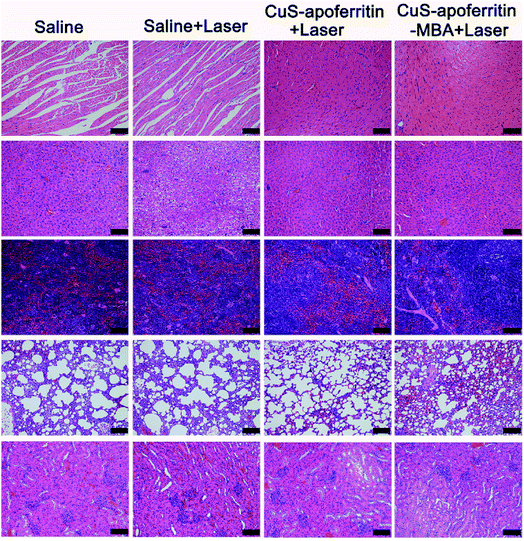
Fig. 10A illustrates the experimental scheme to evaluate the anti-tumor effect of CuS-apoferritin-MBA. The samples were intravenously injected into the mice at scheduled intervals. The size of tumor and weight of the mice were monitored every two days. Body weight is displayed in Fig. 10B; results show that there was no obvious toxicity of CuS-apoferritin-MBA. As indicated in Fig. 10C, tumors of CuS-apoferritin and CuS-apoferritin-MBA groups became smaller within 5 days after laser exposure. And the tumor inhibition ratio of the CuS-apoferritin-MBA group is 67.8%. By contrast, tumor volume increased rapidly over time in groups of CuS-apoferritin and CuS-apoferritin-MBA. These results indicated that CuS-apoferritin-MBA under laser exposure could inhibit tumor growth effectively due to higher thermal conversion efficiency. Furthermore, no tumor regrowth was observed in the CuS-apoferritin-MBA group within 15 days after treatment, thereby further confirming that a CuS-apoferritin-MBA injection with laser irradiation could completely ablate tumors in mice. All mice behaved normally after treatment. In the photothermal treatment group, black scars were noticed at the original tumor sites, but they fell off within 7–10 days post laser irradiation (Fig. 10D).Histology examination of tumor slices by Hematoxylin–eosin (H&E) staining revealed that tumor structure in the CuS-apoferritin-MBA injected group was severely damaged right after laser irradiation (Fig. 10E). Moreover, H&E stained images of main organs from CuS-apoferritin-MBA injected healthy mice also suggest that CuS-apoferritin-MBA did not induce appreciable toxic side effects to treated animals (Fig. 11).
Thanks to high biocompatibility, low immunogenicity, and good pharmacokinetics profile, apoferritin showed a promising application in PTT.33,34 Most of the photothermal agents show biotoxicity, high immunogenicity, non-biodegradability, and poor pharmacokinetics, which strongly affect their clinical application.35,36 We demonstrated that CuS-apoferritin-MBA presented favorable biocompatibility, prolonged circulation time, and enhanced tumor therapy efficiency. Mostly importantly, CuS-apoferritin-MBA together with NIR laser irradiation showed significant photothermal efficiency on EAC tumor-bearing mouse models (Fig. 10).
4. Conclusions
In conclusion, a unique photothermal agent (CuS-apoferritin-MBA) was developed by a conventional synthesis method. Apoferritin as a biotemplate was used to control the size of CuS nanoparticles, and NIR dye (MBA) was used to enhance the photothermal efficiency of CuS-apoferritin. The prepared CuS-apoferritin-MBA displayed good water dispersion, good biocompatibility, and favorable tumor-targeting capability. Both of in vitro and in vivo anti-cancer evaluations of CuS-apoferritin-MBA validated that this photothermal agent is highly efficient for photothermal therapy.Conflicts of interest
There are no conflicts to declare.Acknowledgements
The authors are grateful to the Natural Science Foundation Committee of China (NSFC 81671803), a project supported by the National Key Research and Development Program (Grant No. 2017YFC0107700), the Outstanding Youth Foundation of Jiangsu Province (BK20170030) and funded by Postgraduate Research & Practice Innovation Program of Jiangsu Province and the Priority Academic Program Development of Jiangsu Higher Education Institutions for their financial support.References
- P. Zhang, C. Hu, W. Ran, J. Meng, Q. Yin and Y. Li, Theranostics, 2016, 6, 948–968 CrossRef CAS PubMed.
- M. Xiao, Y. M. Li, M. C. Allen, D. D. Deheyn, X. J. Yue, J. Z. Zhao, N. C. Gianneschi, M. D. Shawkey and A. Dhinojwala, ACS Nano, 2015, 9, 5454–5460 CrossRef CAS PubMed.
- J. Lin, S. J. Wang, P. Huang, Z. Wang, S. H. Chen, G. Niu, W. W. Li, J. He, D. X. Cui, G. M. Lu, X. Y. Chen and Z. H. Nie, ACS Nano, 2013, 7, 5320–5329 CrossRef CAS PubMed.
- Z. B. Zha, Z. J. Deng, Y. Y. Li, C. H. Li and J. R. Wang, Nanoscale, 2013, 5, 4462–4467 RSC.
- S. S. Ren, X. Cheng, M. K. Chen, C. Liu, P. C. Zhao, W. Huang, J. He, Z. Y. Zhou and L. Y. Miao, ACS Appl. Mater. Interfaces, 2017, 9, 31509–31518 CAS.
- S. K. Misra, I. Srivastava, I. Tripathi, E. Daza, F. Ostadhossein and D. Pan, J. Am. Chem. Soc., 2017, 139, 1746–1749 CrossRef CAS PubMed.
- J. Budhathoki-Uprety, R. E. Langenbacher, P. V. Jena, D. Roxbury and D. A. Heller, ACS Nano, 2017, 11, 3875–3882 CrossRef CAS PubMed.
- K. Yang, J. Wan, S. Zhang, B. Tian, Y. Zhang and Z. Liu, Biomaterials, 2012, 33, 2206–2214 CrossRef CAS PubMed.
- J. B. Song, X. Y. Yang, Z. Yang, L. S. Lin, Y. J. Liu, Z. J. Zhou, Z. Y. Shen, G. C. Yu, Y. L. Dai, O. Jacobson, J. Munasinghe, B. Yung, G. J. Teng and X. Y. Chen, ACS Nano, 2017, 11, 6102–6113 CrossRef CAS PubMed.
- M. R. K. Ali, Y. Wu, T. G. Han, X. L. Zang, H. P. Xiao, Y. Tang, R. H. Wu, F. M. Fernández and M. A. El-Sayed, J. Am. Chem. Soc., 2016, 138, 15434–15442 CrossRef CAS PubMed.
- A. Camposeo, L. Persano, R. Manco, Y. Wang, P. D. Carro, C. Zhang, Z. Y. Li, D. Pisignano and Y. N. Xia, ACS Nano, 2015, 9, 10047–10054 CrossRef CAS PubMed.
- L. D. Trizio, H. B. Li, A. Casu, A. Genovese, A. Sathya, G. C. Messina and L. Manna, J. Am. Chem. Soc., 2014, 136, 16277–16284 CrossRef PubMed.
- H. X. Rao, W. H. Sun, S. Y. Ye, W. B. Yan, Y. L. Li, H. T. Peng, Z. W. Liu, Z. Q. Bian and C. H. Huang, ACS Appl. Mater. Interfaces, 2016, 8, 7800–7805 CAS.
- L. M. Yang, Y. H. Tang, D. F. Yan, T. Liu, C. B. Liu and S. L. Luo, ACS Appl. Mater. Interfaces, 2016, 8, 169–176 CAS.
- M. Chen, S. Z. Chen, C. Y. He, S. G. Mo, X. Y. Wang, G. Liu and N. F. Zheng, Nano Res., 2017, 10, 1234–1248 CrossRef CAS.
- Y. Tia n, J. Zhang, S. Tang, L. Zhou and W. Yang, Small, 2016, 12, 721–726 CrossRef CAS PubMed.
- C. Wang, H. Xu, C. Liu, Y. M. Liang, Z. W. Li, G. B. Yang, H. Li, Y. G. Cheng and Z. Liu, ACS Nano, 2013, 7, 6782–6795 CrossRef CAS PubMed.
- S. L. Li, X. Y. Wang, R. Hu, H. Chen, M. Li, J. W. Wang, Y. X. Wang, L. B. Liu, F. T. Lv, X. J. Liang and S. Wang, Chem. Mater., 2016, 28, 8669–8675 CrossRef CAS.
- M. Molina, S. Wedepohl and M. Calderón, Nanoscale, 2016, 8, 5852–5857 RSC.
- S. Pfaffen, J. M. Bradley, R. Abdulqadir, M. R. Firme, G. R. Moore, N. E. Le Brun and M. E. P. Murphy, J. Biol. Chem., 2015, 290, 28416–28427 CrossRef CAS PubMed.
- M. Bellini, S. Mazzucchelli, E. Galbiati, S. Sommaruga, L. Fiandra, M. Truffi, M. A. Rizzuto, M. Colombo, P. Tortora, F. Corsi and D. Prosperi, J. Controlled Release, 2014, 196, 184–196 CrossRef CAS PubMed.
- L. Turyanska, T. D. Bradshaw, M. Li, P. Bardelang, W. C. Drewe, M. W. Fay, S. Mann, A. Patan and N. R. Thomas, J. Mater. Chem., 2012, 22, 660–665 RSC.
- Q. Chen, C. Wang, Z. X. Zhan, W. W. He, Z. P. Cheng, Y. Y. Li and Z. Liu, Biomaterials, 2014, 35, 8206–8214 CrossRef CAS PubMed.
- M. Liang, K. Fan, M. Zhou, D. Duan, J. Zheng, D. Yang, J. Feng and X. Yan, Proc. Georgian Natl. Acad. Sci., 2014, 111, 14900–14905 CrossRef CAS PubMed.
- S. R. Radoshitzky, J. Abraham, C. F. Spiropoulou, J. H. Kuhn, N. Dan, W. H. Li, J. Nagel, P. J. Schmidt, J. H. Nunberg, N. C. Andrews, M. Farzan and H. Choe, Nature, 2007, 446, 92–96 CrossRef CAS PubMed.
- H. Choe, S. Jemielity, J. Abraham, S. R. Radoshitzky and M. Farzan, Curr. Opin. Microbiol., 2011, 14, 476–482 CrossRef CAS PubMed.
- D. Moss, L. W. Powell, P. Arosio and J. W. Halliday, J. Lab. Clin. Med., 1992, 120, 239–243 CAS.
- S. W. Hulet, S. Menzies and J. R. Connor, Dev. Neurosci., 2002, 24, 208–213 CrossRef CAS PubMed.
- J. Liu, G. Hu, D. Chen, A. Y. Gong, G. S. Soori, T. J. Dobleman and X. M. Chen, Oncogenesis, 2013, 2, 1–10 CrossRef PubMed.
- Z. T. Wang, P. Huang, O. Jacobson, Z. Wang, Y. J. Liu, L. S. Lin, J. Lin, N. Lu, H. M. Zhang, R. Tian, G. Niu, G. Liu and X. Y. Chen, ACS Nano, 2016, 10, 3453–3460 CrossRef CAS PubMed.
- L. Liang, S. W. Peng, Z. W. Yuan, C. Wei, Y. Y. He, J. R. Zhen, Y. Q. Gu and H. Y. Chen, RSC Adv., 2018, 8, 6013–6026 RSC.
- A. Makino, H. Harada, T. Okada, H. Kimura, H. Amano, H. Saji, M. Hiraoka and S. Kimura, Nanomedicine, 2011, 7, 638–646 CrossRef CAS PubMed.
- J. Xie, Z. P. Zhen and W. Tang, Cancer Res., 2013, 73, 4513 Search PubMed.
- H. C. Yao, L. Su, M. Zeng, L. Cao, W. W. Zhao, C. Q. Chen, B. Du and J. Zhou, Int. J. Nanomed., 2016, 11, 4423–4438 CrossRef CAS PubMed.
- A. Yuan, J. H. Wu, X. L. Tang, L. L. Zhao, F. Xu and Y. Q. Hu, J. Pharm. Sci., 2013, 102, 6–28 CrossRef CAS PubMed.
- S. Wang, Q. Zhang, X. F. Luo, J. Li, H. He, F. Yang, Y. Di, C. Jin, X. G. Jiang, S. Shen and D. L. Fu, Biomaterials, 2014, 35, 9473–9483 CrossRef CAS PubMed.
Footnote |
| † Yuanyuan He and Yuanzhi Shen contributed equally to this work. |
| This journal is © The Royal Society of Chemistry 2018 |

