Highly poison-resistant Pt nanocrystals on 3D graphene toward efficient methanol oxidation†
Lian Ying Zhangabcd,
Wenlin Zhangab,
Zhiliang Zhaoa,
Ze Liua,
Zhiqin Zhoub and
Chang Ming Li*ac
aInstitute for Clean Energy & Advanced Materials, Faculty of Materials and Energy, Southwest University, Chongqing 400715, P. R. China. E-mail: ecmli@swu.edu.cn
bCollege of Horticulture and Landscape Architecture, Southwest University, Chongqing, 400715, P. R. China
cInstitute of Materials Science and Devices, Suzhou University of Science and Technology, Suzhou 215011, P. R. China
dKey Laboratory of Low-grade Energy Utilization Technologies and Systems (Chongqing University), Ministry of Education of China, Chongqing University, Chongqing 400044, P. R. China
First published on 13th May 2016
Abstract
Highly poison-resistant and uniformly ultrasmall Pt nanocrystals on 3D graphene are synthesized using reductive sugars derived from pectin hydrolysis, and showed a much greater stability and better electrocatalytic activity than the commercial Pt/C toward methanol oxidation. The highly poison-resistant mechanism is mainly attributed to the electrostatic repelling effect between the remanent pectin modified on the Pt surface and the adsorbed poison reactive intermediate species such as carboxy (–COOH)ad during the methanol oxidation reaction. This work provides great promise for an anode catalyst for direct methanol fuel cells through a green synthetic approach.
1. Introduction
The worsening environment and the rapidly exhausting natural resources have urged extensive research of sustainable energy conversion and storage technologies.1–3 Direct methanol fuel cells (DMFCs) have become one of the promising green energy sources due to their compact design, high energy density, low pollution and liquid nature for easy storage and transportation.4–6 To date, Pt is still the most widely used catalyst for methanol electrooxidation.7,8 The high expense of the Pt catalyst for methanol oxidation is due to not only its noble nature but also the short life span by poisons of various irreversibly reactive immediate species such as COad and carboxy (–COOH)ad.9–11 Some non-noble metals have been introduced to form Pt-alloys or Pt-based coshells for increasing catalytic activity toward methanol oxidation, in which Pt preferably catalyzes methanol dehydrogenation to form Pt–COad and the introduced metals provide oxygen species such as –OH for oxidation of COad at a lower potential than Pt.12,13 Recently, some transition metal nitrides/carbides such as TiN and WC are used as supports for Pt catalysts to increase the CO tolerance via a synergistic effect from Pt and the support.14,15 The reflectance infrared spectra analysis suggests that the formed abundant Ti–OH may help in alleviating CO poisoning effect for the Pt/TiN catalyst.14 While WC could provide a strong negative electronic property to Pt atoms through an electron donating effect for avoiding CO adsorption as well as promoting the CO oxidation at low onset potentials.16 However, the process of the adsorbed reactive immediate carboxy (–COOH)ad produced from methanol oxidation has not been investigated, while it is known that the size of metal nanocrystals and dispersity play critical roles in their electrocatalytic behaviors, and small size and uniform dispersion can greatly enhance the electrocatalytic performance. Currently the reported synthetic approaches for uniformly ultrasmall Pt nanocrystals usually involve using organic solvents and toxic reducing agents like oleylamine and hydrazine,17,18 and/or foreign stabilizers such as hexadecyl-trimethyl-ammonium bromide (CTAB) and polyvinylpyrrolidone (PVP) are often used but are generally undesirable during the synthesis.19,20 With the increasing interest in total elimination or at least the minimization of waste and toxicant, green and facile synthetic strategy is desired to produce uniform and small Pt nanocrystals.Pectin is a naturally water-soluble polysaccharide present in primary cell walls of plants, and its backbone comprises linear chains of 1,4-linked α-D-galacturonic acid.21 Importantly, it can be commercially extracted from the pomace of citrus under mildly acidic conditions, and the effective utilization of pectin can be advocated for recycling the waste of resources. Due to its non-toxicity, excellent biocompatibility and biodegradability, pectin has been widely used in the biomedical and food industries including drug and gene delivery, biomaterial modification, food additive, gelling agent and stabilizer.22 Recently, spherical silver nanoparticles were prepared using reductive sugars (e.g. galactose) produced from pectin hydrolysis, suggesting potential application in medical dressings.23 In this study, we try to extend biological reductant applications in energy conversion and storage systems, and we select pectin as a candidate to synthesize Pt nanocrystals on 3D graphene (Pt@3D graphene) toward methanol oxidation reaction. The novelty of this work relies on a unique synthetic method, which used partially hydrolysed reductive sugar to produce uniformly ultrasmall Pt nanocrystals on 3D graphene while pectin simultaneously modifies on the surface of the Pt nanocrystals for high poison-resistance toward methanol oxidation. The schematic synthetic process and its application for methanol oxidation are shown in Fig. 1. The prepared Pt@3D graphene catalyst exhibits much higher poison-resistance for greater stability and better catalytic activity than that of commercial Pt/C, holding great promise as an anode catalyst for DMFCs.
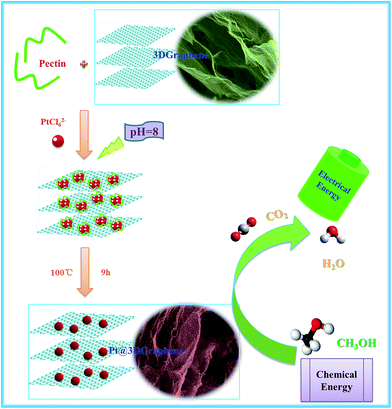 | ||
| Fig. 1 Schematic representation of the fabrication process of Pt@3D graphene and its application in methanol oxidation. | ||
2. Experimental
2.1 Chemicals
Graphite, pectin, hexachloroplatinic acid (H2PtCl6·6H2O) and potassium hydroxide (KOH) were purchased from Sigma-Aldrich. The commercial Pt/C (Pt 30 wt%) was bought from Gas hub-fuel cell system.2.2 Synthesis of 3D graphene
Firstly, the graphene oxide was synthesized using a modified Hummers method.1,24 The prepared graphene oxide was dried at 60 °C. After 10 h, the dried graphene oxide was put into a sealed glass bottle under high vacuum level at 70 °C overnight, followed by heating to 230 °C quickly. The obtained highly loose black powder was denoted as 3D graphene.2.3 Synthesis of Pt@3D graphene nanocomposites
In a typical synthesis of 3D graphene supported Pt nanocrystals, 80 mg pectin and 20 mg 3D graphene were added into 20 mL of deionized water and ultrasonicated for half an hour, followed by adjusting the pH up to 8 using 0.1 M KOH solution. 1.16 mL H2PtCl6 (7.4 mg mLPt−1) was injected into the above solution, and then continuous stirred overnight. Then, the mixed solution was placed in a 50 mL Teflon-sealed autoclave and maintained at 100 °C for 9 h, and the obtained colloidal mixture was centrifuged and washed for several times. After oven-dried at 70 °C for more than 12 h, the obtained sample was denoted as Pt@3D graphene. For XPS characterization, Pt nanocrystals were also synthesized with the same procedure except adding 3D graphene.2.4 Physicochemical characterization
The morphology and nanostructure of prepared samples were obtained on scanning electron microscope (SEM, JSM-7800F) and transmission electron microscope (TEM, JEOL JEM2100). The crystal structure was characterized by powder X-ray diffraction (XRD, XRD-7000), and the composition was carried out using energy dispersive X-ray spectroscopy (EDS, JSM-7800F). Nitrogen adsorption–desorption experiments were carried out at 77.3 K by using an automated gas sorption system (Quantachrome Instruments, 2QDS-MP-30). X-ray photoelectron spectroscopy (XPS) measurements were performed with Thermo Scientific ESCALAB 250Xi X-ray Photoelectron Spectrometer. The surface area and pore size distribution were calculated using the Brunauer–Emmett–Teller (BET) equation and Barrett–Joyner–Halenda (BJH) methods, respectively.2.5 Electrochemical characterization
Electrochemical characterizations were carried out in a three-electrode electrochemical cell using a saturated calomel electrode (SCE) and a platinum foil as the reference and counter electrode, respectively. Catalyst ink was prepared by ultrasonically mixing catalysts (5 mg), ethanol (1 mL) and Nafion solutions (50 μL, 5 wt%). Then 6 μL ink was pipetted and spreaded onto a pre-polished glass carbon (GC) disk electrode (4 mm diameter, 0.126 cm2), followed by drying for 15 min as the working electrode for measurements.Cyclic voltammetry (CV) curves were measured in N2-saturated 0.1 M HClO4 at a scan rate of 50 mV s−1 and 0.1 M HClO4 + 1.0 M CH3OH at a scan rate of 5 mV s−1. The amperometric i–t and chronopotentiometry curves were both obtained in 0.1 M HClO4 + 1.0 M CH3OH, respectively. All electrochemical experiments were performed in N2-saturated solution at 25 ± 1 °C.
3. Results and discussion
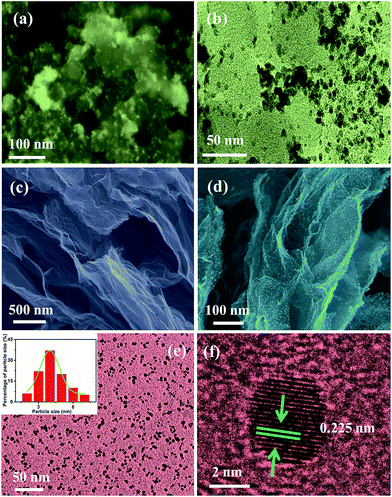
The SEM and TEM images of commercial Pt/C in Fig. 2a–b show that Pt nanocrystals are clearly agglomerated. In contrast, Pt nanocrystals are uniformly distributed on hierarchical macroporous 3D graphene (Fig. 2c) with an average size as small as 3.9 nm (Fig. 2d–e), which could greatly boost the electrocatalytic activity. The HRTEM image of Pt@3D graphene in Fig. 2f states well-defined crystal structure of Pt with predominant (111) facets. Since the hierarchical macroporous structure of 3D graphene can enable fast mass transport process, the ultrasmall and uniform Pt nanocrystals could be ascribed to the fast transfer for rapidly accessing graphene surface to produce highly concentrated Pt nucleation sites, while the gelatinization ability of pectin could also play critical role in restraining the formed Pt nanoparticles from agglomeration by the action of steric hindrance.23,25 Furthermore, reaction temperature and times are tailored to investigate the dispersity of synthesized Pt nanocrystals. The SEM images in Fig. S1† display that sparse Pt crystals are deposited on 3D graphene possibly due to the relatively short reaction time or low temperature; however, too high temperature or long reaction time could result in regional agglomeration by the carbonization tendency of pectin and/or by suppressing the gelatinization of pectin from the high surface energy of the formed ultrasmall Pt nanocrystals.The nitrogen adsorption–desorption isotherms and BJH pore size distribution of Pt@3D graphene and commercial Pt/C are presented in Fig. 3a–b. The calculated specific surface area of commercial Pt/C is 92.6 m2 g−1, while Pt@3D graphene exhibits a higher specific surface area up to 156.2 m2 g−1 with a large number of mesoporosity centered at 3.65 nm. Combining with macroporous structure observed from Fig. 2c–d, Pt@3D graphene materials produced by the green approach indeed existing very distinctively pore structured with meso- and macropores. For further analysis of the structure and phase of Pt@3D graphene, XRD was performed as in Fig. 3c. The diffraction peaks at 40°, 46°, 67°, 81° and 86° can be assigned to (111), (200), (220), (311) and (222) facets, respectively, indicating a typical face-centered cubic structure of Pt nanocrystals.26 The powerful diffraction peak at 40° suggests that the Pt nanocrystals on 3D graphene are primary (111) facet, which is in good agreement with the HRTEM characterization. Debye–Scherrer formula was employed to calculate the Pt crystallite size through its diffraction peak at (220),1,27 and the calculated average Pt crystallite size for Pt@3D graphene is 4.1 nm, which is almost consistent with the TEM analysis. In addition, the element composition of Pt@3D graphene materials are determined by EDS, and Fig. 3d tells that Pt loading is 31.4%, suggesting a similar amount comparing to the commercial Pt/C (30%).
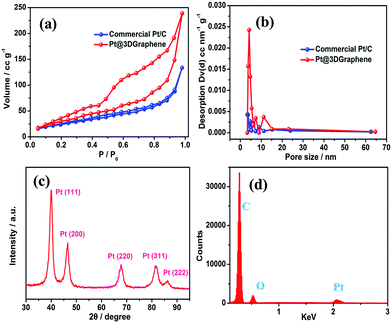 | ||
| Fig. 3 (a) N2 adsorption–desorption isotherm and (b) BJH pore size distribution of Pt@3D graphene and commercial Pt/C (c) XRD patterns and (d) EDS spectrum of Pt@3D graphene. | ||
Electrochemical behaviors of Pt@3D graphene and commercial Pt/C catalysts were firstly investigated by CV curves as in Fig. 4, in which two prominent potential regions of both catalysts corresponding to underpotential deposited hydrogen (Hupd) adsorption/desorption processes range from −0.30 to 0.07 V and forming an adsorbed hydroxyl layer beyond 0.46 V. Electrochemically active surface area (EASA), a significant parameter of an electrode to evaluate its catalytic performance, could account for not only the catalyst surface available for charge transfer but also the access of a conductive path to transfer the electrons to and from the electrode surface.28 Here, it can be calculated in term of the hydrogen adsorption/desorption region by integrating the charges collected in the Hupd adsorption/desorption region after double-layer correction.29 The calculated EASA of Pt@3D graphene (36.3 m2 g−1) is higher than that of commercial Pt/C (30.7 m2 g−1), demonstrating that the former can provide more available catalytic active sites.1 The enhanced EASA could contribute to the ultrasmall Pt nanocrystals uniformly distributed on 3D graphene in comparison to the commercial Pt/C.
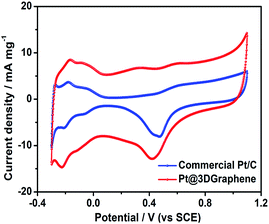 | ||
| Fig. 4 CV curves of Pt@3D graphene and commercial Pt/C electrocatalysts measured in N2-saturated 0.1 M HClO4 solution. Scan rate: 50 mV s−1. | ||
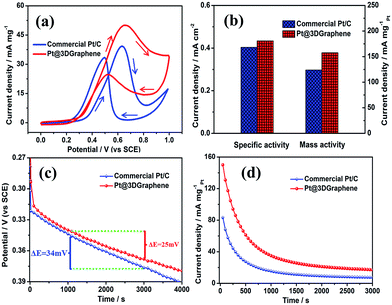
Fig. 5a shows that the methanol oxidation on each electrode of the present investigation has been characterized by two well-defined anodic current peaks: one in the forward and the other one in the reverse scan. In the forward scan, the methanol begins to oxide into intermediate species in accompany with the rising current. While in the reverse scan, the oxidation peak is primarily associated with the removal of the adsorbed carbonaceous species formed in the forward scan. Obviously, Pt@3D graphene presents much higher oxidation current peak (50.0 mA mg−1) than that of commercial Pt/C (39.2 mA mg−1) during the positive scan due to its higher EASA for more available active sites. Furthermore, Pt@3D graphene delivers more negative onset potential (0.318 V) in comparison to the commercial one (0.352 V), demonstrating its higher intrinsic catalytic activity toward methanol oxidation. The ratio of the forward to the reverse oxidation current peak, If/Ib, is a crucial parameter in evaluation of the catalyst resistance to the poisoning intermediate species toward methanol oxidation,30 and the higher ratio indicates the less accumulation of poisoning species on the surface of Pt nanocrystals. Interestingly, the calculated If/Ib of Pt@3D graphene is 2.01, which is much higher than that of commercial Pt/C (1.16), revealing its better poison-resistant ability. To understand the fundamental insights of high poison-resistance mechanism for Pt@3D graphene catalyst toward methanol oxidation, XPS was performed to probe the functional groups on Pt crystals surface (the Pt nanocrystals are prepared with same procedure of Pt@3D graphene except using 3D graphene as catalyst support). The C1s spectrum in Fig. 6 can be fitted by three peaks at 284.6, 286.3 and 288.2 eV, corresponding to C–C, C–OH and HO–C![[double bond, length as m-dash]](https://www.rsc.org/images/entities/char_e001.gif) O groups,31 respectively, which indicates existing remanent pectin molecules on Pt nanocrystals surface. It is worthy of a note that methanol oxidation involves surface-dependent limitation, the surface modification of metal nanocrystals often plays key role in catalytic properties. Furthermore, recently reported Pt/graphene32 and Pt–graphene33 without using pectin were also selected for further comparison. The corresponding If/Ib value for Pt/graphene and Pt–graphene are 1.24 and 1.19, respectively, which both lower than that of as-prepared Pt@3D graphene, implying that catalyst support of graphene might not play critical role in poison-resistant ability toward methanol oxidation. The CO-stripping result in Fig. S2† show that the onset potential of Pt@3D graphene has a negative shift in comparison to the commercial one, confirming the former has better CO poisoning resistance toward methanol oxidation.34,35 As shown schematically in Fig. 6, we argue that the high poison-resistance for Pt@3D graphene could be mainly contributed to the electrostatic repelling effect between negative charges of –COO− on remanent pectin backbone modified on Pt nanocrystals surface and adsorbed reactive intermediate species such as carboxy (–COOH)ad during methanol oxidation reaction, and consequently free active sites for the adsorption of methanol molecules to enhance electrode kinetics.
O groups,31 respectively, which indicates existing remanent pectin molecules on Pt nanocrystals surface. It is worthy of a note that methanol oxidation involves surface-dependent limitation, the surface modification of metal nanocrystals often plays key role in catalytic properties. Furthermore, recently reported Pt/graphene32 and Pt–graphene33 without using pectin were also selected for further comparison. The corresponding If/Ib value for Pt/graphene and Pt–graphene are 1.24 and 1.19, respectively, which both lower than that of as-prepared Pt@3D graphene, implying that catalyst support of graphene might not play critical role in poison-resistant ability toward methanol oxidation. The CO-stripping result in Fig. S2† show that the onset potential of Pt@3D graphene has a negative shift in comparison to the commercial one, confirming the former has better CO poisoning resistance toward methanol oxidation.34,35 As shown schematically in Fig. 6, we argue that the high poison-resistance for Pt@3D graphene could be mainly contributed to the electrostatic repelling effect between negative charges of –COO− on remanent pectin backbone modified on Pt nanocrystals surface and adsorbed reactive intermediate species such as carboxy (–COOH)ad during methanol oxidation reaction, and consequently free active sites for the adsorption of methanol molecules to enhance electrode kinetics.
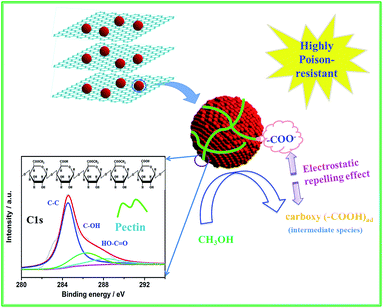 | ||
| Fig. 6 Schematic representation of high poison-resistance mechanism of Pt@3D graphene catalyst toward methanol oxidation. | ||
In addition, the mass activity (normalized in reference to metal loading) and specific activity (normalized in reference to EASA) of Pt@3D graphene as in Fig. 5b is higher than those of commercial Pt/C, respectively, confirming its higher catalytic activity toward methanol oxidation. Fig. 5c displays that the chronopotentiometry of Pt@3D graphene and commercial Pt/C catalysts are measured at a constant load of 3 mA cm−2. Clearly, the Pt@3D graphene holds more negative potential comparing to the commercial Pt/C, further confirming that the former has higher catalytic activity toward methanol oxidation, which might mainly come from its higher EASA offering more available active sites and highly poison-resistance ability. Meanwhile, the attenuated potential range from 1000 s to 3000 s is 34 mV and 25 mV for commercial Pt/C and Pt@3D graphene, respectively, demonstrating better stability of Pt@3D graphene. Chronoamperometry measurements (Fig. 5d) are also carried out to evaluate the catalyst stability toward methanol oxidation at a fixed potential of 0.6 V. The residual current density of Pt@3D graphene catalyst after 3000 s is 17.4 mA mgPt−1, which is almost two times than that of commercial Pt/C (7.4 mA mgPt−1), confirming that the Pt@3D graphene has better stability and is more suitable for long-term operation. The remarkable stability is very likely related to uniformly ultrasmall Pt nanocrystals with high poison-resistance and hierarchical porous 3D graphene offering low diffusion resistance and improving electrolyte–electrode accessibility for mass transport process.1
4. Conclusions
In summary, ultrasmall and uniform Pt nanocrystals on 3D graphene with an average size of 3.9 nm were synthesized using reductive sugars produced from pectin hydrolysis. The prepared Pt@3D graphene presents larger values for both specific surface area and EASA in comparison to commercial Pt/C, while much higher poison-resistance for greater stability as well as better catalytic activity toward methanol oxidation than the latter, thus rendering great promise as an efficient anode catalyst for DMFCs. The high poison-resistance mechanism is mainly resulted from electrostatic repelling effect between remanent pectin modified on Pt nanocrystals surface and adsorbed reactive intermediate species such as carboxy (–COOH)ad during methanol oxidation reaction. This work also provides a novel route to prepare efficient catalysts for other energy systems and sensing devices through handling reactive intermediate species formed on crystals surface.Acknowledgements
We gratefully acknowledge to the financial support by Fundamental Research Funds for the Central Universities (No. XDJK2016C001), Open fund of Key Laboratory of Low-grade Energy Utilization Technologies and Systems, Ministry of Education of China (LLEUTS-201609), Chongqing Postdoctoral Science Foundation (Xm2015006) and China Postdoctoral Science Foundation (No. 2015M572426).Notes and references
- L. Y. Zhang, Z. L. Zhao and C. M. Li, Nano Energy, 2015, 11, 71 CrossRef CAS
.
- M. K. Debe, Nature, 2012, 486, 43 CrossRef CAS PubMed
.
- L. Dai, Acc. Chem. Res., 2012, 46, 31 CrossRef PubMed
.
- L. Zhao, Z. B. Wang, J. L. Li, J. J. Zhang, X. L. Sui and L. M. Zhang, RSC Adv., 2015, 5, 98160 RSC
.
- Y. Wang, Z. M. Sheng, H. Yang, S. P. Jiang and C. M. Li, Int. J. Hydrogen Energy, 2010, 35, 10087 CrossRef CAS
.
- S. J. Guo and S. H. Sun, J. Am. Chem. Soc., 2012, 134, 2492 CrossRef CAS PubMed
.
- Y. Xiang, S. Lu and S. P. Jiang, Chem. Soc. Rev., 2012, 41, 7291 RSC
.
- J. Zhang and C. M. Li, Chem. Soc. Rev., 2012, 41, 7016 RSC
.
- B. Beden, J. M. Leger and C. Lamy, in Modern Aspects of Electrochemistry, ed. J. O. M. Bockris, R. E. White and B. E. Conway, Springer, New York, 1992, vol. 22, p. 97 Search PubMed
.
- W. Gao, M. Zhao and Q. Jiang, ChemPhysChem, 2008, 9, 2092 CrossRef PubMed
.
- S. Sun, G. Zhang, N. Gauquelin, N. Chen, J. Zhou, S. Yang, W. Chen, X. Meng, D. Geng, M. N. Banis, R. Li, S. Ye, S. Knights, G. A. Botton, T. K. Sham and X. Sun, Sci. Rep., 2013, 3, 1775 Search PubMed
.
- S. Liang, F. Wang, Z. Zhang, Y. Li, Y. Cai, J. Ren and X. Jiang, RSC Adv., 2015, 5, 48569 RSC
.
- H. Yang, J. Zhang, K. Sun, S. Zou and J. Fang, Angew. Chem., Int. Ed., 2010, 49, 6848 CrossRef CAS PubMed
.
- S. Sharma and B. G. Pollet, J. Power Sources, 2012, 208, 96 CrossRef CAS
.
- H. Yan, C. Tian, L. Sun, B. Wang, L. Wang, J. Yin, A. Wu and H. Fu, Energy Environ. Sci., 2014, 7, 1939 CAS
.
- G. Cui, P. K. Shen, H. Meng, J. Zhao and G. Wu, J. Power Sources, 2012, 196, 6125 CrossRef
.
- S. J. Guo, S. Zhang and S. H. Sun, Angew. Chem., Int. Ed., 2013, 52, 8526 CrossRef CAS PubMed
.
- C. Wang, H. Daimon, Y. Lee, J. Kim and S. H. Sun, J. Am. Chem. Soc., 2007, 129, 6974 CrossRef CAS PubMed
.
- H. Lee, S. E. Habas, S. Kweskin, D. Butcher, G. A. Somorjai and P. D. Yang, Angew. Chem., Int. Ed., 2006, 118, 7988 CrossRef
.
- H. Chen, D. Wang, Y. Yu, K. A. Newton, D. A. Muller, H. Abruña and F. J. DiSalvo, J. Am. Chem. Soc., 2012, 134, 18453 CrossRef CAS PubMed
.
- E. Bonnin, C. Garnier and M. C. Ralet, Appl. Microbiol. Biotechnol., 2014, 98, 519 CrossRef CAS PubMed
.
- X. J. Zhao, W. L. Zhang and Z. Q. Zhou, Colloids Surf., B, 2014, 123, 493 CrossRef CAS PubMed
.
- M. Zahran, H. B. Ahmed and M. El-Rafie, Carbohydr.
Polym., 2014, 111, 971 CrossRef CAS PubMed
.
- W. S. Hummers and R. E. Offeman, J. Am. Chem. Soc., 1958, 80, 1339 CrossRef CAS
.
- L. Y. Zhang, Z. L. Zhao, W. Y. Yuan and C. M. Li, Nanoscale, 2016, 8, 1905 RSC
.
- Z. Cui, C. X. Guo and C. M. Li, J. Mater. Chem. A, 2013, 1, 6687 CAS
.
- T. Hyeon, S. Han, Y. E. Sung, K. W. Park and Y. W. Kim, Angew. Chem., Int. Ed., 2003, 115, 4488 CrossRef
.
- B. Seger and P. V. Kamat, J. Phys. Chem. C, 2009, 113, 7990 CAS
.
- B. Lim, M. Jiang, P. H. Camargo, E. C. Cho, J. Tao, X. Lu, Y. Zhu and Y. Xia, Science, 2009, 324, 1302 CrossRef CAS PubMed
.
- S. Guo, S. Dong and E. Wang, ACS Nano, 2009, 4, 547 CrossRef PubMed
.
- Y. Fan, P. F. Liu, Z. J. Yang, T. W. Jiang, K. L. Yao, R. Han, X. X. Huo and Y. Y. Xiong, Electrochim. Acta, 2015, 163, 140 CrossRef CAS
.
- S. Woo, J. Lee, S. K. Park, H. Kim, T. D. Chung and Y. Piao, Curr. Appl. Phys., 2015, 15, 219 CrossRef
.
- H. J. Huang, S. B. Yang, R. Vajtai, X. Wang and P. M. Ajayan, Adv. Mater., 2014, 26, 5160 CrossRef CAS PubMed
.
- J. N. Tiwari, R. N. Tiwari, G. Singh and K. S. Kim, Nano Energy, 2013, 2, 553 CrossRef CAS
.
- S. Sharma and B. G. Pollet, J. Power Sources, 2012, 208, 96 CrossRef CAS
.
Footnote |
| † Electronic supplementary information (ESI) available. See DOI: 10.1039/c6ra06517a |
| This journal is © The Royal Society of Chemistry 2016 |

