Stirring-assisted hydrothermal synthesis of ultralong α-MnO2 nanowires for oxygen reduction reaction†
Kaixiang
Lei‡
a,
Liang
Cong‡
a,
Xiaorui
Fu
a,
Fangyi
Cheng
*a and
Jun
Chen
ab
aKey Laboratory of Advanced Energy Materials Chemistry (Ministry of Education), College of Chemistry, Tianjin 300071, China. E-mail: fycheng@nankai.edu.cn; Fax: +86-22-23509571; Tel: +86-22-23497717
bCollaborative Innovation Center of Chemical Science and Engineering, Nankai University, Tianjin 300071, China
First published on 27th April 2016
Abstract
Ultralong MnO2 nanowires were synthesized through a facile hydrothermal treatment of bulk MnO2 along with magnetic stirring. Compared with commercial MnO2 powders, the synthesized nanowires exhibited higher catalytic activity and stability toward the oxygen reduction reaction.
The sluggish kinetics of the cathode oxygen reduction reaction (ORR) largely determines the performance of fuel cells and metal-air batteries, necessitating the use of electrocatalysts.1 Pt-based materials are recognized as the most active ORR catalysts with low overpotential but suffer from scarcity and high cost.2 Manganese oxides, particularly MnO2, have attracted extensive attention as alternative cheap catalysts due to their high elemental abundance, easy synthesis, considerable activity and environmental friendliness.2b,c,3 Different strategies, including microwave synthesis,4 coprecipitation,5 electrodeposition,6 sol–gel synthesis7 and hydrothermal treatement,8 have been proposed to synthesize MnO2. These synthetic approaches have generated a variety of morphologies such as tubes,9 spheres,10 rods,11 belts,12 wires,8a,13 flowers,14 and so on.15 Generally, the electrochemical performance of MnO2 largely depends on its phase, shape and size.16 Compared to the bulk form, nanostructured MnO2 shows enhanced catalytic activity due to its large surface area and small particle size.8c,16
Among different crystallographic types of MnO2, α-MnO2 is the most active as it adopts a combined (1 × 1) and (2 × 2) tunnel structure, which benefits the insertion and transfer of ions in the lattice. More importantly, α-MnO2 possesses more defects and –OH groups and thus favors the surface adsorption of O2.8c,16c However, compared with noble-metal catalysts, the activity of MnO2 is limited, in terms of higher overpotential. Strategies such as doping metal ions,3d,17 coating with noble metals,18 introducing oxygen defects19 and hydrogenation,20 have been proposed to improve the performance. The reported α-MnO2 is often in particulate form prone to aggregation, or has a relatively large size ranging from hundreds of nanometers to micrometers, leaving much room for further enhancement. It is desirable to develop a facile route to synthesize ultralong and ultrathin one-dimensional (1D) α-MnO2 nanostructures, which would expose more active sites due to their small radial diameter and large surface area, facilitate electron transfer along the axis, and favor buildup of an interconnected network.21
Herein, we report a facile synthesis of ultralong α-MnO2 nanowires (NWs) from commercial MnO2 powders through hydrothermal treatment under magnetic stirring. The obtained NWs possess an average diameter of 50 nm, with length up to tens of micrometers. To the best of our knowledge, this is the largest aspect ratio (>1000) for α-MnO2 NWs ever reported. The enhanced aspect ratio results in a remarkable activity and stability for the electrocatalytic ORR.
Hydrothermal synthesis with stirring merits reactant contact and diffusion and thus promotes the formation of unique nanostructures, as recently demonstrated in nanotubular TiO2.22 In this study, commercial MnO2 powders (supplied by Tianjin Guangfu, AR) were employed as the raw material to prepare the intermediate MnOx nanowires (MnOx NWs) through stirring-assisted hydrothermal treatment in NH3·H2O solution. The generated MnOx NWs were subsequently subjected to annealing in air for the formation of α-MnO2 NWs. Scheme 1 schematically illustrates the synthesis process. A batch of samples was obtained by adjusting the experiment parameters such as reaction temperature, reactant concentration, and dwell time. Details of the synthesis are described in the ESI.†
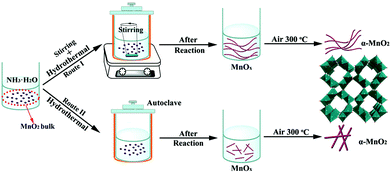 | ||
| Scheme 1 Schematic illustration of the hydrothermal synthesis of ultralong α-MnO2 nanowires and α-MnO2 nanorods with and without stirring. | ||
Fig. 1 and S1–S5 ESI† show the typical scanning electron microscopy (SEM) images of commercial MnO2 powders and the intermediate MnOx NWs obtained under different conditions. The commercial MnO2 precursor presents an irregular shape with micrometer size and is composed of firmly agglomerated nanoparticles (Fig. S1a†). The sample generated from hydrothermal treatment under stirring shows wire morphology, with a typical diameter of a few tens of nanometers (Fig. 1a). In comparison, only nanoparticles or nanorods (NRs) with a much shorter length can be found in the sample obtained without stirring (Fig. 1b).
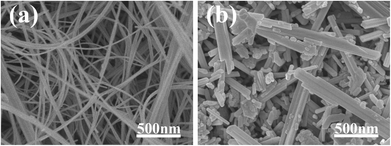 | ||
| Fig. 1 SEM images of the MnOx intermediate obtained by hydrothermal treatment with (a) and without (b) stirring at 160 °C for 48 h, respectively. | ||
In control experiments, we adjusted synthetic parameters such as reactant concentration, reaction temperature, dwell time, and stirring speed (Fig. S1–S6, ESI†). The results clearly indicate that increasing the reaction temperature and the concentration of NH3·H2O and extending the hydrothermal treatment time have resulted in a larger quantity of nanowires and a higher aspect ratio of the wires. Applying strong stirring also favors the formation of tortuous wires with a smaller diameter and longer length, as compared to the case without stirring or under weak stirring. In the present synthesis, tortuous MnOx NWs (Fig. S3d, ESI†) were obtained using a 4 M NH3·H2O solution and a dwell time of 48 h at 160 °C. Further increasing the concentration, extending the reaction time and elevating the temperature have no profound effect on the morphology of the prepared samples.
As the synthesis of nanowires was free from the use of any surfactant and template, the process of the nanowire growth could be explained by a dissolution–recrystallization process. Under hydrothermal conditions, the dispersed bulk MnO2 powders slowly dissolve in NH3·H2O solution, and then recrystallize and precipitate after saturation. Due to the complexation effect of NH3·H2O and the anisotropic growth habit of manganese dioxide of tetragonal crystallographic symmetry,8,23,24 the gradual dissolution–recrystallization process leads to the formation of one-dimensional (1D) nanowires or nanorods. This can be viewed from the time-dependent morphology evolution (Fig. S2 and S6†): particles are presented initially, a mixture of smaller nanoparticles and short nanorods is observed afterwards, and more 1D nanostructures form as the reaction proceeds. Stirring exerts a profound influence on the crystal growth behavior of manganese oxides. The main reasons are proposed as follows: firstly, the slow dissolution–recrystallization process and low growth kinetics under the traditional hydrothermal process would cause agglomeration of the precipitated nuclei to form short nanorods, whereas mechanical stirring can enhance the heat and mass transport, facilitating the growth of long nanowires. Secondly, strong stirring destroys the dissolution–recrystallization equilibrium under static conditions and accelerates the growth kinetics of nanowires. This is confirmed by the different appearance of the samples obtained after a short reaction interval of 1 h. A few nanowires (Fig. S3a†) and only nanoparticles (Fig. S6a†) are observed with and without stirring, respectively. Thirdly, the as-prepared nanowires are tortuous due to the effect of mechanical force. Under stirring, the shearing force between the motion of fluid and the generated nanowires makes them to constantly re-orient to the fluid direction and grow axially through an oriented crystal growth mechanism, which reduces the fluid drag force and results in the formation of tortuous nanowires with a high aspect ratio, as suggested previously in the case of titania.22
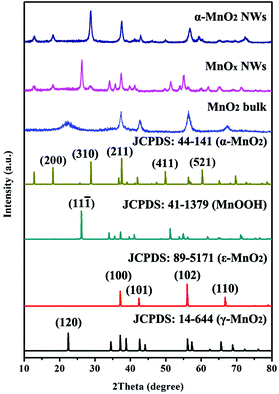
Thermogravimetry (TG) was performed to analyze the composition of the intermediate MnOx (Fig. S7, ESI†). The curve displays weight loss in three steps. The mass loss before 130 °C corresponds to the release of adsorbed water. The following mass loss between 130–560 °C can be assigned to the transition from MnOOH to MnO2. The last mass loss step at 560 °C is ascribed to the phase transition from MnO2 to Mn2O3.24bFig. 2 displays the powder X-ray diffraction (XRD) patterns of the MnO2 precursor, the intermediate MnOx, and the annealed sample, together with the standard reference profiles. By referring to standard patterns, the pristine MnO2 is mainly composed of ε-MnO2 (JCPDS no. 89-5171) and γ-MnO2 (JCPDS no. 144-644). The main phases of the intermediate MnOx NWs are α-MnO2 (JCPDS no. 44-141) and MnOOH (JCPDS no. 41-1379). After calcination in air at 300 °C, the intermediate MnOx was converted into α-MnO2. The obtained α-MnO2 adopts a tetragonal structure with the space group of I4/m. The two strongest peaks correspond to (211) and (310) planes, respectively. Compared with the pristine MnO2, the crystallinity of the as-synthesized α-MnO2 is enhanced.
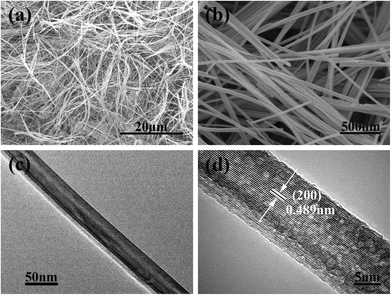
Fig. 3 shows the microstructure of the obtained α-MnO2 NWs. The SEM images (Fig. 3a and b) indicate uniformity of the samples. The NWs measure in length up to several tens of micrometers, with an average diameter of about 50 nm. The aspect ratio of the synthesized NWs is typically larger than 1000. Further transmission electron microscopy (TEM) imaging confirms the uniform diameter of the nanowire (Fig. 3c). A high-resolution TEM (HRTEM) micrograph (Fig. 3d) shows clear lattice fringes with an interplanar distance of 0.489 nm, which is consistent with the d-spacing of the (200) crystal planes.
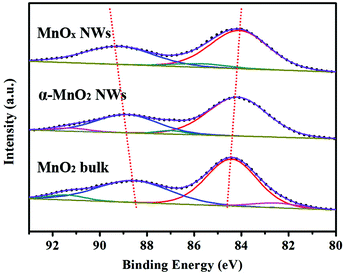
The chemical composition and oxidation state of the obtained samples were analyzed by X-ray photoelectron spectroscopy (XPS). The XPS survey scan spectra (Fig. S8, ESI†) show the presence of Mn, O, and C. The signal of C is possibly attributed to sample preparation in air before testing and the background of a conductive adhesive tape. Fig. 4 displays the Mn 3s spectra. The linear relationship between the valence of Mn in the oxides and the separation of peak energies of Mn 3s (ΔE3s) has been clarified in previous reports.2c,20,25 The measured ΔE3s for MnO2 bulk, MnOx NWs, and α-MnO2 NWs were 4.45, 5.05, and 4.70 eV, respectively. Since the intermediate MnOx is composed of MnOOH and α-MnO2, the surface Mn valence is between +3 and +4, agreeing with earlier studies.20,26
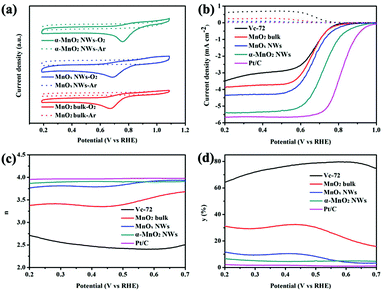
To evaluate the ORR catalytic activities of the materials, cyclic voltammetry (CV) tests were conducted for different samples in 0.1 M KOH solution saturated with Ar or O2 at a scan rate of 20 mV s−1 on a rotating disk electrode (RDE). The electrode preparation was described in detail in the ESI.†Fig. 5a shows the CV curves of bulk MnO2, MnOx NWs, and α-MnO2 NWs. Compared with the featureless peak currents in Ar-saturated KOH solution, distinct cathodic peaks were observed in the O2 atmosphere, indicating the catalytic ORR process. Moreover, in comparison with the bulk MnO2, the reduction peak potential of α-MnO2 NWs shifted positively from 0.67 to 0.76 V (vs. RHE), indicating much improvement in ORR activity.
The ORR performance was further investigated through linear sweeping voltammogram (LSV) measurements on a rotating ring-disk electrode (RRDE) setup in O2-saturated 0.1 M KOH solution (Fig. S9, ESI†). The current density increases with the rotating speed, due to the acceleration of mass flux at the electrode surface.27Fig. 5b displays the ORR polarization curves of different samples recorded at 1600 rpm. The results of Vulcan XC-72 carbon powders (Vc-72) and Pt/C (20 wt%) are also included for comparison. Apparently, among the as-prepared manganese oxides, MnO2 ultralong nanowires exhibit the highest catalytic activity in terms of onset potential, half-wave potential and limiting current density, which are usually referred to as the intuitional parameters to evaluate the catalytic performance of ORR electrocatalysts. In addition, the catalytic activity of the α-MnO2 nanorods (NRs) was also measured under the same conditions. As shown in Fig. S10a,† the ultralong MnO2 NWs are more active than MnO2 NRs. However, the performance of ultralong α-MnO2 NWs remains to be further improved as compared to Pt/C.
To further study the ORR kinetics, the electron transfer number (n) and peroxide yield (y, percentage of HO2− relative to total products) can be calculated using eqn (3) and (4) described in the ESI.†![[thin space (1/6-em)]](https://www.rsc.org/images/entities/char_2009.gif) 2b,19,28 As shown in Fig. 5c, the n values of manganese oxides are close to 4, suggesting an apparent four-electron pathway reduction. This is also confirmed by the K–L plots in Fig. S11 (ESI†). The two-electron pathway should be suppressed due to the generation of detrimental and corrosive peroxides that decreases ORR efficiency.29 The higher electron transfer number further demonstrates higher ORR efficiency on α-MnO2 NWs. As seen from Fig. 5d, the average peroxide yields are above 7% from 0.2 to 0.7 V (vs. RHE). Compared with the pristine bulk MnO2, the average peroxide yield of α-MnO2 NWs is lower.
2b,19,28 As shown in Fig. 5c, the n values of manganese oxides are close to 4, suggesting an apparent four-electron pathway reduction. This is also confirmed by the K–L plots in Fig. S11 (ESI†). The two-electron pathway should be suppressed due to the generation of detrimental and corrosive peroxides that decreases ORR efficiency.29 The higher electron transfer number further demonstrates higher ORR efficiency on α-MnO2 NWs. As seen from Fig. 5d, the average peroxide yields are above 7% from 0.2 to 0.7 V (vs. RHE). Compared with the pristine bulk MnO2, the average peroxide yield of α-MnO2 NWs is lower.
Fig. 6 shows the Tafel plots of the as-synthesized samples using kinetic currents (ik) calculated from the mass-transport correction (eqn (2), ESI†). Obviously, only one linear region was observed at high overpotential. α-MnO2 NWs show a Tafel slope of about 94 mV per decade, which is lower than MnO2 bulk and MnOx NWs (109 and 114 mV dec−1). The lower Tafel slope indicates slower increase of overpotential with current and thus suggests better kinetics of α-MnO2 NWs. Additionally, in the chronoamperometric test (Fig. S12a, ESI†), the ORR currents generated by α-MnO2 NWs maintained 80% in a continuous polarization of 17 h at 0.49 V (vs. RHE), while a decrease of 30% in the currents was observed for the bulk MnO2. For comparison, the ORR currents of the benchmark Pt/C (Fig. S12a†) decayed to 67% after 11 h, again suggesting favorable catalytic stability of ultralong α-MnO2 NWs in alkaline environment. Note that the insufficient O2 flux with applied constant electrode rotation for a long time may partly account for the decay of ORR current.2b,c,27c Furthermore, α-MnO2 NWs possess excellent tolerance to methanol crossover, as compared to Pt/C that shows a fast activity fade due to methanol poisoning (Fig. S12b, ESI†).
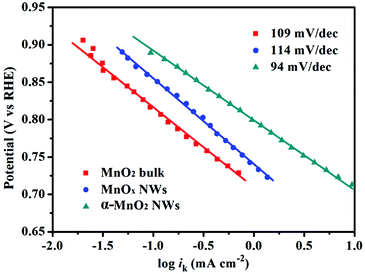 | ||
| Fig. 6 Tafel plots of MnO2 bulk, MnOx NWs, and α-MnO2 NWs derived by the mass-transport correction of voltammetry data. | ||
In order to evaluate the effect of conductive carbon, the electrochemical performance of α-MnO2 NWs without Vc-72 was also measured under the same conditions (Fig. S13, ESI†). The catalytic activity of freestanding α-MnO2 NWs is lower than that of α-MnO2 NWs containing Vc-72, which is mainly ascribed to the limited electrical conductivity of manganese oxides. However, the electron transfer number of freestanding α-MnO2 NWs is well above 3.4, indicating a quasi-4e ORR pathway. In addition, iR compensation is considered in Fig. S10.† For all electrodes, the series resistance calculated from EIS is about 40 ohm, which exerts a noticeable effect on the ORR LSV profiles in the kinetic-controlled region. The iR drop however negligibly affects the overall trend of catalytic activities among the tested samples. Furthermore, we have investigated the influence of catalyst loading. Fig. S14† shows the electrochemical performance of three electrodes with loadings of 28, 60, and 283 μg cm−2. The electron transfer number decreased and the peroxide content increased at lower loading. Therefore, the catalyst loading should be optimized to balance the mass specific activity and areal specific activity.
The electrochemical performances of different samples are summarized in Table 1. Compared with the commercial MnO2 and the as-synthesized nanorods, the ultralong NWs exhibit the highest activity. Notably, the performance of ultralong α-MnO2 NWs is among the best reported for α-MnO2 (Table S2†).8c,17b,17e,19a,30 The remarkable electrocatalytic performance of the synthesized ultralong α-MnO2 NWs might be ascribed to the following factors. Firstly, in α-MnO2, the sizes of (1 × 1) and (2 × 2) tunnels (0.189 and 0.46 nm, respectively) are suitable for the absorption of O2 and the transfer of ions, respectively.8c Secondly, the measured electronic conductivity of α-MnO2 NWs is higher than that of bulk MnO2, MnOx NWs, and α-MnO2 NRs (4.33 × 10⁻³versus 8.07 × 10⁻⁴, 9.62 × 10⁻⁴ and 2.31 × 10⁻³ S m−1). Enhanced charge transfer in NWs is also confirmed by impedance spectra (Fig. S10b, ESI†). Thirdly, the ultralong 1D nanostructure of α-MnO2 NWs not only shortens the charge transfer distance, but also favors the formation of 3D interconnected conducting networks that are less prone to aggregation like the comparative particulate form. More importantly, the ultralong nanowires possess a larger surface area (57.81 m2 g−1) and electrochemical surface area (ECSA, 74.3 m2 g−1) than other samples, which is in favor of exposing more active sites (Fig. S15–S17, ESI†). These advantages help to enhance the electrocatalytic activity and stability.
| Samples | E onset (V) | E half (V) | i k (mA cm−2) | I m (mA mg−1) | n | ||||||||||||||||||||||||||||||||||||||||||||||||||||||||||||||||||||||||||||||||||||||||||||||
|---|---|---|---|---|---|---|---|---|---|---|---|---|---|---|---|---|---|---|---|---|---|---|---|---|---|---|---|---|---|---|---|---|---|---|---|---|---|---|---|---|---|---|---|---|---|---|---|---|---|---|---|---|---|---|---|---|---|---|---|---|---|---|---|---|---|---|---|---|---|---|---|---|---|---|---|---|---|---|---|---|---|---|---|---|---|---|---|---|---|---|---|---|---|---|---|---|---|---|---|
| a E onset, Ehalf, ik, Im, and n represent onset potential, half-wave potential, kinetic current density, mass activity and electron transfer number, respectively. The values of ik are determined at 0.7 V. Im and n are determined at 0.45 V. | |||||||||||||||||||||||||||||||||||||||||||||||||||||||||||||||||||||||||||||||||||||||||||||||||||
| Vc-72 | 0.76 | 0.67 | 1.65 | 10.41 | 2.44 | ||||||||||||||||||||||||||||||||||||||||||||||||||||||||||||||||||||||||||||||||||||||||||||||
| MnO2 bulk | 0.76 | 0.66 | 1.54 | 43.89 | 3.35 | ||||||||||||||||||||||||||||||||||||||||||||||||||||||||||||||||||||||||||||||||||||||||||||||
| MnOx NWs | 0.82 | 0.67 | 2.35 | 50.48 | 3.79 | ||||||||||||||||||||||||||||||||||||||||||||||||||||||||||||||||||||||||||||||||||||||||||||||
| α-MnO2 NRs | 0.86 | 0.67 | 2.85 | 54.95 | 3.68 | ||||||||||||||||||||||||||||||||||||||||||||||||||||||||||||||||||||||||||||||||||||||||||||||
| α-MnO2 NWs | 0.94 | 0.72 | 9.42 | 62.60 | 3.91 | ||||||||||||||||||||||||||||||||||||||||||||||||||||||||||||||||||||||||||||||||||||||||||||||
| Pt/C | 0.99 | 0.81 | 127.82 | 99.90 | 3.97 | ||||||||||||||||||||||||||||||||||||||||||||||||||||||||||||||||||||||||||||||||||||||||||||||
In summary, uniform ultralong α-MnO2 nanowires have been synthesized by a facile stirring-assisted hydrothermal method. For the oxygen reduction catalysis, the obtained ultralong MnO2 nanowires exhibit remarkable catalytic activity with an apparent four-electron transfer and low yield of peroxide species. They also afford much lower overpotential and better stability as compared to commercial bulk MnO2 powders. The results would foster the design and synthesis of MnO2 nanomaterials as efficient yet cheap catalysts for applications in alkaline metal-air batteries.
This work was supported by NSFC (21322101 and 21231005) and MOE (ACET-13-0296 and B12015).
Notes and references
- (a) U. Paulus, T. Schmidt, H. Gasteiger and R. Behm, J. Electroanal. Chem., 2001, 495, 134 CrossRef CAS; (b) M. Oezaslan and P. Strasser, J. Power Sources, 2011, 196, 5240 CrossRef CAS; (c) W. B. Luo, S. L. Chou, J. Z. Wang, Y. C. Zhai and H. K. Liu, Sci. Rep., 2015, 5, 8012 CrossRef CAS PubMed; (d) Z. L. Wang, D. Xu, J. J. Xu and X. B. Zhang, Chem. Soc. Rev., 2014, 43, 7746 RSC; (e) Y. Nie, L. Li and Z. D. Wei, Chem. Soc. Rev., 2015, 44, 2168 RSC.
- (a) J. Benson, Q. Xu, P. Wang, Y. T. Shen, L. T. Sun, T. Y. Wang, M. X. Li and P. Papakonstantinou, ACS Appl. Mater. Interfaces, 2014, 6, 19726 CrossRef CAS PubMed; (b) X. Han, T. Zhang, J. Du, F. Cheng and J. Chen, Chem. Sci., 2013, 4, 368 RSC; (c) J. Du, Y. Pan, T. Zhang, X. Han, F. Cheng and J. Chen, J. Mater. Chem., 2012, 22, 15812 RSC; (d) X. Liu, M. Park, M. G. Kim, S. Gupta, G. Wu and J. Cho, Angew. Chem., Int. Ed., 2015, 54, 1 CrossRef CAS PubMed; (e) F. Cheng and J. Chen, Chem. Soc. Rev., 2012, 41, 2172 RSC; (f) F. Lu, J. Sui, J. Su, C. Jin, M. Shen and R. Yang, J. Power Sources, 2014, 271, 55 CrossRef CAS.
- (a) C. H. Choi, S. H. Park and S. I. Woo, Phys. Chem. Chem. Phys., 2012, 14, 6842 RSC; (b) Y. Gorlin, C. J. Chung, D. Nordlund, B. M. Clemens and T. F. Jaramilo, ACS Catal., 2012, 2, 2687 CrossRef CAS; (c) F. Cheng, J. Shen, B. Peng, Y. Pan, Z. Tao and J. Chen, Nat. Chem., 2011, 3, 79 CrossRef CAS PubMed; (d) E. M. Benbow, S. P. Kelly, L. Zhao, J. W. Reutenauer and S. L. Suib, J. Phys. Chem. C, 2011, 115, 22009 CrossRef CAS; (e) M. Le, Y. Liu, H. Wang, R. K. Dutta, W. B. Yan, J. C. Hemminger, R. Q. Wu and R. M. Penner, Chem. Mater., 2015, 27, 3494 CrossRef CAS.
- J. Yan, Z. Fan, T. Wei, W. Qian, M. Zhang and F. Wei, Carbon, 2010, 48, 3825 CrossRef CAS.
- Q. Qu, P. Zhang, B. Wang, Y. Chen, S. Tian, Y. Wu and R. Holze, J. Phys. Chem. C, 2009, 113, 14020 CAS.
- X. Hu, F. Cheng, X. Han, T. Zhang and J. Chen, Small, 2015, 11, 809 CrossRef CAS PubMed.
- X. Wang, A. Yuan and Y. Wang, J. Power Sources, 2007, 172, 1007 CrossRef CAS.
- (a) X. Wang and Y. D. Li, J. Am. Chem. Soc., 2002, 124, 2880 CrossRef CAS PubMed; (b) Y. J. Xiong, Y. Xie, Z. Q. Li and C. Z. Wu, Chem. – Eur. J., 2003, 9, 1645 CrossRef CAS PubMed; (c) W. Xiao, D. L. Wang and X. W. Lou, J. Phys. Chem. C, 2010, 114, 1694 CrossRef CAS.
- T. T. Truong, Y. Liu, Y. Ren, L. Traheny and Y. Sun, ACS Nano, 2012, 6, 8067 CrossRef CAS PubMed.
- P. Ragupathy, H. N. Vasan and N. Munichandraiah, J. Electrochem. Soc., 2008, 155, A34 CrossRef CAS.
- X. Lu, D. Zheng, T. Zhai, Z. Liu, Y. Huang, S. Xie and Y. Tong, Energy Environ. Sci., 2011, 4, 2915 CAS.
- J. Zhu, W. Shi, N. Xiao, X. Rui, H. Tan, X. Lu, H. Hng, J. Ma and Q. Yan, ACS Appl. Mater. Interfaces, 2012, 4, 2769 CAS.
- (a) Z. Sun, S. Firdoz, E. Yap, L. Li and X. Lu, Nanoscale, 2013, 5, 4379 RSC; (b) A. Sumboja, C. Y. Foo, J. Yan, C. Yan, R. K. Gupta and P. S. Lee, J. Mater. Chem., 2012, 22, 23921 RSC.
- (a) G. Yu, L. Hu, N. Liu, H. Wang, M. Vosgueritchian, Y. Yang, Y. Cui and Z. Bao, Nano Lett., 2011, 11, 4438 CrossRef CAS PubMed; (b) J. Zhang, C. Guo, L. Zhang and C. M. Li, Chem. Commun., 2013, 49, 6334 RSC.
- (a) Z. Q. Li, Y. Ding, Y. J. Xiong, Q. Yang and Y. Xie, Chem. Commun., 2005, 7, 918 Search PubMed; (b) S. W. Lee, J. Kim, S. Chen, P. T. Hammond and S. H. Yang, ACS Nano, 2010, 4, 3889 CrossRef CAS PubMed.
- (a) F. H. B. Lima, M. L. Calegaro and E. A. Ticianelli, J. Electroanal. Chem., 2006, 590, 152 CrossRef CAS; (b) F. H. B. Lima, M. L. Calegaro and E. A. Ticianelli, Electrochim. Acta, 2007, 52, 3732 CrossRef CAS; (c) F. Cheng, Y. Su, J. Liang, Z. Tao and J. Chen, Chem. Mater., 2010, 22, 898 CrossRef CAS; (d) S. K. Bikkarolla, F. J. Yu, W. Z. Zhou, P. Joseph, P. Cumpson and P. Papakonstantinou, J. Mater. Chem. A, 2014, 2, 14493 RSC.
- (a) P. Bezdička, T. Grygar, B. Klápště and J. Vondrák, Electrochim. Acta, 1999, 45, 913 CrossRef; (b) T. N. Lambert, D. J. Davis, W. Lu, S. J. Limmer, P. G. Kotula, A. Thuli, M. Hungate, G. Ruan, Z. Jin and J. M. Tour, Chem. Commun., 2012, 48, 7931 RSC; (c) Y. Meng, W. Song, H. Huang, Z. Ren, S. Chen and S. L. Suib, J. Am. Chem. Soc., 2014, 136, 11452 CrossRef CAS PubMed; (d) I. Roche, E. Chaînet, M. Chatenet and J. Vondrák, J. Phys. Chem. C, 2007, 111, 1434 CrossRef CAS; (e) D. J. Davis, T. N. Lambert, J. A. Vigil, M. A. Rodriguez, M. T. Brumbach, E. N. Coker and S. J. Limmer, J. Phys. Chem. C, 2014, 118, 17342 CrossRef CAS.
- X. Wang, Z. Yang, Y. Zhang, L. Jing, Y. Zhao, Y. Yan and K. Sun, Fuel Cells, 2014, 14, 35 Search PubMed.
- (a) F. Cheng, T. Zhang, Y. Zhang, J. Du, X. Han and J. Chen, Angew. Chem., Int. Ed., 2013, 52, 2474 CrossRef CAS PubMed; (b) J. l. Jung, H. Y. Jeong, M. G. Kim, G. Nam, J. Park and J. Cho, Adv. Mater., 2015, 27, 266 CrossRef CAS PubMed; (c) L. Li, X. Feng, Y. Nie, S. Chen, F. Shi, K. Xiong, W. Ding, X. Qi, J. Hu, Z. Wei, L. Wan and M. Xia, ACS Catal., 2015, 5, 4825 CrossRef CAS.
- T. Zhang, F. Cheng, J. Du, Y. Hu and J. Chen, Adv. Energy Mater., 2015, 5, 1400654 Search PubMed.
- C. Wei, L. Yu, C. Cui, J. Lin, C. Wei, N. Mathews, F. Huo, T. Sritharan and Z. Xu, Chem. Commun., 2014, 50, 7885 RSC.
- Y. Tang, Y. Zhang, J. Deng, J. Wei, H. L. Tam, B. K. Chandran, Z. Dong, Z. Chen and X. Chen, Adv. Mater., 2014, 26, 6111 CrossRef CAS PubMed.
- R. H. Ma, Y. Bando, Q. L. Zhang and T. Sasaki, Adv. Mater., 2004, 16, 918 CrossRef CAS.
- (a) Z. Y. Yuan, Z. Zhang, G. Du, T. Z. Ren and B. L. Su, Chem. Phys. Lett., 2003, 378, 349 CrossRef CAS; (b) F. Cheng, J. Zhao, W. Song, C. Li, H. Ma, J. Chen and P. Shen, Inorg. Chem., 2006, 45, 2038 CrossRef CAS PubMed.
- (a) M. Toupin, T. Brousse and D. Bélanger, Chem. Mater., 2004, 16, 3184 CrossRef CAS; (b) Y. Gorlin and T. F. Jaramillo, J. Am. Chem. Soc., 2010, 132, 13612 CrossRef CAS PubMed; (c) Y. Gorlin, B. Lassalle-Kaiser, J. D. Benck, S. Gul, S. M. Webb, V. K. Yachandra, J. Yano and T. F. Jaramillo, J. Am. Chem. Soc., 2013, 135, 8525 CrossRef CAS PubMed; (d) K. Lei, X. Han, Y. Hu, X. Liu, L. Cong, F. Cheng and J. Chen, Chem. Commun., 2015, 51, 11599 RSC.
- Q. W. Tang, L. H. Jiang, J. Liu, S. L. Wang and G. Q. Sun, ACS Catal., 2014, 4, 457 CrossRef CAS.
- (a) A. Aijaz, N. Fujiwara and Q. Xu, J. Am. Chem. Soc., 2014, 136, 6790 CrossRef CAS PubMed; (b) J. Liang, Y. Zheng, J. Chen, J. Liu, D. Hulicova-Jurcakova, M. Jaroniec and S. Z. Qiao, Angew. Chem., Int. Ed., 2012, 51, 3892 CrossRef CAS PubMed; (c) X. Liu, J. Du, C. Li, X. Han, X. Hu, F. Cheng and J. Chen, J. Mater. Chem. A, 2015, 3, 3425 RSC.
- S. S. Liu, W. Y. Bian, Z. R. Yang, J. H. Tian, C. Jin, M. Shen, Z. F. Zhou and R. Z. Yang, J. Mater. Chem. A, 2014, 2, 18012 CAS.
- J. F. Wu, X. Z. Yuan, J. J. Martin, H. J. Wang, J. J. Zhang, J. Shen, S. H. Wu and W. Merida, J. Power Sources, 2008, 184, 104 CrossRef CAS.
- (a) C. Shi, G. L. Zang, Z. Zhang, G. P. Sheng, Y. X. Huang, G. X. Zhao, X. K. Wang and H. Q. Yu, Electrochim. Acta, 2014, 132, 239 CrossRef CAS; (b) Y. Y. Ma, R. F. Wang, H. Wang, J. Key and S. Ji, J. Power Sources, 2015, 280, 526 CrossRef CAS; (c) K. Selvakumar, S. M. S. Kumar, R. Thangamuthu, K. Ganesan, P. Murugan, P. Rajput, S. N. Jha and D. Bhattacharyya, J. Phys. Chem. C, 2015, 119, 6604 CrossRef CAS.
Footnotes |
| † Electronic supplementary information (ESI) available: Experimental details, SEM images of the intermediate, TG curves, XPS survey scan spectrum, N2 absorption/desorption, and electrochemical results. See DOI: 10.1039/c6qi00056h |
| ‡ These authors contributed equally to this work. |
| This journal is © the Partner Organisations 2016 |


