Water-soluble and phosphorus-containing carbon dots with strong green fluorescence for cell labeling†
Wei
Wang
ab,
Yongmao
Li
a,
Lu
Cheng
a,
Zhiqiang
Cao
b and
Wenguang
Liu
*a
aSchool of Materials Science and Engineering, Tianjin Key Laboratory of Composite and Functional Materials, Tianjin University, Tianjin 300072, PR China. E-mail: wgliu@tju.edu.cn
bDepartment of Chemical Engineering and Materials Science, Wayne State University, Detroit, Michigan 48202, USA
First published on 30th October 2013
Abstract
Water-soluble phosphorus-containing carbon dots (PCDs) with strong green fluorescence were synthesized through a facile one-step microwave assisted approach using phosphorus-rich phytic acid as a carbon source. Owing to their strong green fluorescence and low cytotoxicity, the PCDs are promising as bio-imaging agents.
Emerging from carbon nanomaterials, fluorescent carbon dots (CDs) have recently attracted a tremendous amount of attention.1,2 Unlike semiconductor quantum dots (QDs) which contain toxic heavy metal elements, CDs are mainly composed of non-toxic C, O and N, and are considered to be biocompatible.3 Numerous natural and synthetic substances have been utilized as the carbon source to fabricate CDs through various methods,1,4 for cell labeling,5,6in vivo imaging,7,8 drug delivery9 and gene transfection.10 However, most of these CDs emit blue light under ultraviolet excitation which is not appropriate for bio-imaging. Cells and tissues are mostly composed of carbohydrate, and emit blue light too, which would interfere with the fluorescent signals from CDs; this is the so-called “water window” effect.11 These CDs may emit longer wavelength light by longer-wavelength excitation, but the quantum yield of the red-shifted fluorescence decreases significantly. There have been significant efforts to shift the maximum emission light from blue to green, yellow, red and even near-infrared regions. The resulting CDs usually showed low quantum yields and their syntheses involved complex procedures or toxic components.12–17 It is very challenging to fabricate CDs with strong long-wavelength emission through a facile strategy. Here we present a simple one-step microwave assisted method to prepare water-soluble, phosphorus-containing and highly green fluorescent carbon dots (PCDs) (Fig. 1). The synthesis process was accomplished within 10 minutes. By purification with specific organic solvent, the quantum yield reached 21.65% with fluorescein as a standard. The MTT test indicated low cell toxicity of the resulting PCDs; this implied their good potential in cell labeling and imaging.
 | ||
| Fig. 1 (a) Schematic diagram for synthesizing PCDs. (b) Emission under daylight and 365 nm ultraviolet excitation. | ||
The PCDs were synthesized by simply mixing 2 ml 70% phytic acid (PA) and 1 ml ethylenediamine (EDA) in 25 ml ultrapure water. The turbid mixture was then put at the center of the rotation plate of a 700 W microwave oven for about 8 minutes. As water evaporated during this process, 30 ml ultrapure water was poured into the beaker to avoid the product burning. The resulting crude product was extracted by organic solvent and PCDs were obtained followed by rotary evaporation (for details see the ESI†).
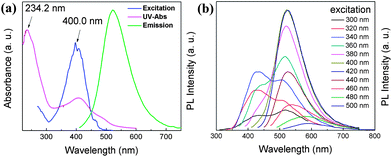
The synthesized PCDs were examined for their photoluminescence (PL) properties. The UV-Vis spectrum showed a sharp peak at 234.2 nm and a broad peak at 407.2 nm (Fig. 2a). The sharp one was attributed to the π–π* transition of the C![[double bond, length as m-dash]](https://www.rsc.org/images/entities/char_e001.gif) C structure, in agreement with previously reported carbon dots,18 and the broad one was attributed to aromatic structures. Upon the maximum excitation at 400 nm, PCDs emitted bright green fluorescence centered at 525 nm. Such PL properties differentiated PCDs from traditional blue light emitting CDs. Fig. 2b shows the PL spectra of the PCDs excited at wavelengths ranging from 300 to 500 nm. It should be noted that the PCDs gave two-peak emissions (i.e., 420 nm and 510 nm) when excited at wavelengths lower than 360 nm. At such low excitation wavelengths, the energy was strong enough to excite two types of chromophores for emission. While at high excitation wavelengths (360–460 nm), the energy decreased and was no longer able to excite chromophores having 340 nm maximum excitation, resulting in a single-peak emission at 525 nm (green fluorescence). Further increasing the excitation wavelength (e.g., to 480 and 500 nm) shifted the emission peak to even longer wavelengths (reached 580 and 590 nm, respectively), which can be explained by an “edge red-shift effect”.19
C structure, in agreement with previously reported carbon dots,18 and the broad one was attributed to aromatic structures. Upon the maximum excitation at 400 nm, PCDs emitted bright green fluorescence centered at 525 nm. Such PL properties differentiated PCDs from traditional blue light emitting CDs. Fig. 2b shows the PL spectra of the PCDs excited at wavelengths ranging from 300 to 500 nm. It should be noted that the PCDs gave two-peak emissions (i.e., 420 nm and 510 nm) when excited at wavelengths lower than 360 nm. At such low excitation wavelengths, the energy was strong enough to excite two types of chromophores for emission. While at high excitation wavelengths (360–460 nm), the energy decreased and was no longer able to excite chromophores having 340 nm maximum excitation, resulting in a single-peak emission at 525 nm (green fluorescence). Further increasing the excitation wavelength (e.g., to 480 and 500 nm) shifted the emission peak to even longer wavelengths (reached 580 and 590 nm, respectively), which can be explained by an “edge red-shift effect”.19
 | ||
| Fig. 2 (a) UV-Vis spectrum and the maximum PL excitation and emission spectra of PCDs in water. (b) PL emission spectra of PCDs under different wavelength excitations. | ||
The quantum yield (QY) is one of the most important features to determine. It is noted that most of the reported green PCDs remained low in QY value.12–14,16,17 The fluorescein in 0.1 M NaOH solution was utilized as the standard, with the reported QY to be 90%. We utilized a variety of solvents to purify the PCD samples. Compared with rough PCDs, the purified PCDs had a QY of 11.1%, 11.6%, 13.4%, 17.4% and 19.5% by using methanol, ethanol, tetrahydrofuran, acetonitrile and acetone with an improvement of 5.6%, 10.5%, 27.8%, 66.1% and 85.7%, respectively. Acetone was the most effective to purify PCDs, with the resulting QY = 19.5% ± 1.5% (average ± standard deviation, from 5 independent experiments). The PL decay curve of PCDs is shown in Fig. S2.† The lifetime was 4.88 ns with a perfect linearity value of 1.009, indicating that at an excitation of 400 nm, the chromophores of the PCDs were dominated by uniform structures on their surface, which also endowed PCDs with excitation-independent properties.
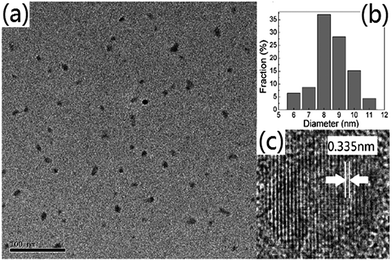
The PL performance of the PCDs in different pH solutions was measured. It was found that the pH of the solution did not shift the emission wavelength but dramatically influenced the fluorescent intensity of the PCDs (Fig. S3†). The PL intensity was strong at pH = 6–10 with the maximum at pH = 9. At extreme acidic or basic environments the intensity was irreversibly decreased possibly due to the damage of crucial fluorescence structures. The morphology and chemical nature of the synthesized PCDs were further investigated. Transmission electron microscope (TEM) images in Fig. 3 showed a uniform dispersion of the PCDs in water and a relatively narrow particle size distribution ranging from 6–11 nm, with the average diameter of 9 nm.
 | ||
| Fig. 3 (a) LR-TEM image of the PCDs. Scale bar: 100 nm. (b) Size distribution diagram. (c) HR-TEM image of the PCDs. | ||
The existence of the graphite-like structure in the PCDs was confirmed via high resolution TEM (HRTEM), Raman spectroscopy, and X-ray diffraction (XRD). HRTEM images showed that the average lattice spacing of the PCDs was 0.335 nm (Fig. 3c), in agreement with the interspacing of the (002) plane of graphite.15 The Raman spectrum (Fig. S4†) showed two closely packed peaks at 1580 cm−1 (G band) and 1371 cm−1 (D band), representing the E2g mode of graphite (i.e., related to the vibration of sp2-bonded carbon atoms in a hexagonal lattice) and the vibration of disordered or glassy carbon atoms, respectively.17 The XRD pattern (Fig. S5†) showed a large broad peak centered at 2θ = 22.06°, 4.30 Å, similar to the graphite lattice spacing.13
To the best of our knowledge, the inclusion of phosphorus groups to the CDs has never been reported before. We found that phosphorus groups were covalently bonded to aromatic structures of PCDs. The existence of P–O–R (R = aromatic structure) was confirmed through FT-IR (Fig. S6†). In the spectrum of the raw materials (white powder mentioned in the Experimental part in the ESI†), the broad peak between 2200 and 2900 cm−1 was typical for phosphate. The peaks at 1638 cm−1 and 1543 cm−1 could be attributed to the plane bending vibration and the stretching vibration of N–H in EDA. Peaks at 1128 cm−1, 1055 cm−1, and 972 cm−1 were related to the vibration of P![[double bond, length as m-dash]](https://www.rsc.org/images/entities/char_e001.gif) O, P–O–R (R = alkyl) and P–O–H of phytic acid, respectively.20 In the spectrum of the synthesized PCDs, these –NH2 and phosphate structures were mostly maintained. There were new peaks emerging at 1713 cm−1 corresponding to the unsaturated carbon structures (i.e., C
O, P–O–R (R = alkyl) and P–O–H of phytic acid, respectively.20 In the spectrum of the synthesized PCDs, these –NH2 and phosphate structures were mostly maintained. There were new peaks emerging at 1713 cm−1 corresponding to the unsaturated carbon structures (i.e., C![[double bond, length as m-dash]](https://www.rsc.org/images/entities/char_e001.gif) C stretching vibration). The peak at 972 cm−1 for the P–O–H structures of the raw material disappeared, while a new peak at 928 cm−1 emerged, which reflected the vibration of P–O–R (R = aromatic structure).20
C stretching vibration). The peak at 972 cm−1 for the P–O–H structures of the raw material disappeared, while a new peak at 928 cm−1 emerged, which reflected the vibration of P–O–R (R = aromatic structure).20
The existence of aromatic carbons or unsaturated carbons in the PCDs could be further supported by the X-ray Photoelectron Spectrometer (XPS) study (full spectrum shown in Fig. S7†). The high resolution C 1s spectrum (Fig. S8†) could be well fitted with sp2 C![[double bond, length as m-dash]](https://www.rsc.org/images/entities/char_e001.gif) C (from aromatic structure), C–N, and C–O three structures, centered at 284.4, 285.4 and 286.4 eV, respectively, rather than with C–N and C–O two structures only.
C (from aromatic structure), C–N, and C–O three structures, centered at 284.4, 285.4 and 286.4 eV, respectively, rather than with C–N and C–O two structures only.
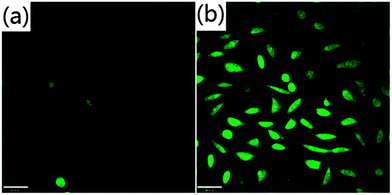
The synthesized PCDs exhibited low cytotoxicity as measured by a MTT assay. It was found that L929 cells retained 100% viability even in the presence of 2 mg ml−1 PCDs, and above 80% with 7 mg ml−1 (Fig. S9†). The PCD labeled L929 cells were further imaged in vitro utilizing a confocal microscopy. L929 cells treated by PCDs showed bright green light under the excitation of 405 nm, while there was no detectable fluorescence in the untreated control group (Fig. 4). Remarkably, labeled PCDs showed no blinking and low photo-bleaching under the confocal laser, indicating their good photo-stability and great potential as bioimaging materials.
 | ||
| Fig. 4 Laser confocal microscopy images of L929 cells. (a) Control group. (b) PCDs labeled L929 cells. Scale bar: 40 μm. | ||
In summary, we have demonstrated a facile one-step microwave assisted method to synthesize water-soluble phosphorus-containing carbon dots (PCDs) with strong green fluorescence. Phytic acid was used as a natural phosphorus-rich carbon source. The synthesized carbon dots were further purified through acetone extraction, and the resulting PCDs showed a remarkably high quantum yield (i.e., 21.65%), much higher than most green fluorescent carbon dots so far reported. It was proved that the graphite-like structure and covalent linkage of phosphorus groups to the graphite-like structure existed in the PCDs. With low cytotoxicity and cell-labeling ability, the PCDs showed great potential as bioimaging materials.
Acknowledgements
The authors gratefully acknowledge the support for this work from National Science and Technology Major Project of China (Grants 2012ZX10004801-003-007, 2012AA022603).Notes and references
- S. N. Baker and G. A. Baker, Angew. Chem., Int. Ed., 2010, 49, 6726 CrossRef CAS PubMed.
- X. Y. Xu, R. Ray, Y. L. Gu, H. J. Ploehn, L. Gearheart, K. Raker and W. A. Scrivens, J. Am. Chem. Soc., 2004, 126, 12736 CrossRef CAS PubMed.
- B. F. Han, W. X. Wang, H. Y. Wu, F. Fang, N. Z. Wang, X. J. Zhang and S. K. Xu, Colloids Surf., B, 2012, 100, 209 CrossRef CAS PubMed.
- H. T. Li, Z. H. Kang, Y. Liu and S. T. Lee, J. Mater. Chem., 2012, 22, 24230 RSC.
- L. Cao, X. Wang, M. J. Meziani, F. S. Lu, H. F. Wang, P. J. G. Luo, Y. Lin, B. A. Harruff, L. M. Veca, D. Murray, S. Y. Xie and Y. P. Sun, J. Am. Chem. Soc., 2007, 129, 11318 CrossRef CAS PubMed.
- X. Y. Zhai, P. Zhang, C. J. Liu, T. Bai, W. C. Li, L. M. Dai and W. G. Liu, Chem. Commun., 2012, 48, 7955 RSC.
- H. Q. Tao, K. Yang, Z. Ma, J. M. Wan, Y. J. Zhang, Z. H. Kang and Z. Liu, Small, 2012, 8, 281 CrossRef CAS PubMed.
- S. T. Yang, L. Cao, P. G. Luo, F. S. Lu, X. Wang, H. F. Wang, M. J. Meziani, Y. F. Liu, G. Qi and Y. P. Sun, J. Am. Chem. Soc., 2009, 131, 11308 CrossRef CAS PubMed.
- Q. Wang, X. Huang, Y. Long, X. Wang, H. Zhang, R. Zhu, L. Liang, P. Teng and H. Zheng, Carbon, 2013, 59, 192 CrossRef CAS PubMed.
- C. J. Liu, P. Zhang, X. Y. Zhai, F. Tian, W. C. Li, J. H. Yang, Y. Liu, H. B. Wang, W. Wang and W. G. Liu, Biomaterials, 2012, 33, 3604 CrossRef CAS PubMed.
- S. F. Lim, R. Riehn, W. S. Ryu, N. Khanarian, C. K. Tung, D. Tank and R. H. Austin, Nano Lett., 2006, 6, 169 CrossRef CAS PubMed.
- S. J. Zhu, J. H. Zhang, C. Y. Qiao, S. J. Tang, Y. F. Li, W. J. Yuan, B. Li, L. Tian, F. Liu, R. Hu, H. N. Gao, H. T. Wei, H. Zhang, H. C. Sun and B. Yang, Chem. Commun., 2011, 47, 6858 RSC.
- S. N. Qu, X. Y. Wang, Q. P. Lu, X. Y. Liu and L. J. Wang, Angew. Chem., Int. Ed., 2012, 51, 12215 CrossRef CAS PubMed.
- J. C. Zhang, W. Q. Shen, D. Y. Pan, Z. W. Zhang, Y. G. Fang and M. H. Wu, New J. Chem., 2010, 34, 591 RSC.
- Y. Liu, C. Y. Liu and Z. Y. Zhang, J. Mater. Chem. C, 2013, 1, 4902 RSC.
- J. Zhou, P. Lin, J. J. Ma, X. Y. Shan, H. Feng, C. C. Chen, J. R. Chen and Z. S. Qian, RSC Adv., 2013, 3, 9625 RSC.
- Y. Fang, S. Guo, D. Li, C. Zhu, W. Ren, S. Dong and E. Wang, ACS Nano, 2012, 6, 400 CrossRef CAS PubMed.
- L. Tang, R. Li, X. Cao, J. Lin, H. Jiang, X. Li, K. S. Teng, C. M. Luk, S. Zeng, J. Hao and S. P. Lau, ACS Nano, 2012, 6, 5102 CrossRef CAS PubMed.
- A. P. Demchenko, Luminescence, 2002, 17, 19 CrossRef CAS PubMed.
- L. C. Thomas and R. A. Chittenden, Spectrochim. Acta, 1964, 20, 467 CrossRef CAS.
Footnote |
| † Electronic supplementary information (ESI) available. See DOI: 10.1039/c3tb21370f |
| This journal is © The Royal Society of Chemistry 2014 |
