
 Open Access Article
 This Open Access Article is licensed under a
 Creative Commons Attribution 3.0 Unported Licence
Electron correlation effects on uranium isotope fractionation in U(VI)–U(VI) and U(IV)–U(VI) equilibrium isotopic exchange systems†
Ataru
Sato
 ab,
Masahiko
Hada
a and
Minori
Abe
*ab
ab,
Masahiko
Hada
a and
Minori
Abe
*ab
aDepartment of Chemistry, Graduate School of Science, Tokyo Metropolitan University, 1-1 Minami-Osawa, Hachiojii-shi Tokyo 192-0397, Japan. E-mail: minoria@hiroshima-u.ac.jp; Tel: +81-82-424-7496
bDepartment of Chemistry, Graduate School of Advanced Science and Engineering, Hiroshima University, 1-3-1 Kagamiyama, Higashi-Hiroshima City Hiroshima 739-8526, Japan
First published on 14th May 2024
Abstract
Uranium isotope fractionation has been extensively investigated in the fields of nuclear engineering and geochemical studies, yet the underlying mechanisms remain unclear. This study assessed isotope fractionations in U(VI)–U(VI) and U(IV)–U(VI) systems by employing various relativistic electron correlation methods to explore the effect of electron correlation and to realize accurate calculations of isotope fractionation coefficients (ε). The nuclear volume term, ln![[thin space (1/6-em)]](https://www.rsc.org/images/entities/char_2009.gif) Knv, the major term in ε, was estimated using the exact two-component relativistic Hamiltonian in conjunction with either HF, DFT(B3LYP), MP2, CCSD, CCSD(T), FSCCSD, CASPT2, or RASPT2 approaches for small molecular models with high symmetry. In contrast, chemical species studied in prior experimental work had moderate sizes and were asymmetrical. In such cases, electron correlation calculations other than DFT calculations were not possible and so only the HF and B3LYP approaches were employed. For closed-shell U(VI)–U(VI) systems, the MP2, CCSD and CCSD(T) methods yielded similar lnKnv values that were intermediate between those for the HF and B3LYP methods. Comparisons with experimental results for U(VI)–U(VI) systems showed that the B3LYP calculations gave results closer to the experimental data than the HF calculations. Because of the open-shell structure of U(IV), multireference methods involving the FSCCSD, CASPT2 and RASPT2 techniques were used for U(IV)–U(VI) systems, but these calculations exhibited instability. The average-of-configuration HF method showed better agreement with the experimental ε values for U(IV)–U(VI) systems than the B3LYP method. Overall, electron correlation improved the description of ε for the U(VI)–U(VI) systems but challenges remain with regard to open-shell U(IV) calculations because an energy accuracy of 10−6–10−7Eh is required for lnKnv calculations.
Knv, the major term in ε, was estimated using the exact two-component relativistic Hamiltonian in conjunction with either HF, DFT(B3LYP), MP2, CCSD, CCSD(T), FSCCSD, CASPT2, or RASPT2 approaches for small molecular models with high symmetry. In contrast, chemical species studied in prior experimental work had moderate sizes and were asymmetrical. In such cases, electron correlation calculations other than DFT calculations were not possible and so only the HF and B3LYP approaches were employed. For closed-shell U(VI)–U(VI) systems, the MP2, CCSD and CCSD(T) methods yielded similar lnKnv values that were intermediate between those for the HF and B3LYP methods. Comparisons with experimental results for U(VI)–U(VI) systems showed that the B3LYP calculations gave results closer to the experimental data than the HF calculations. Because of the open-shell structure of U(IV), multireference methods involving the FSCCSD, CASPT2 and RASPT2 techniques were used for U(IV)–U(VI) systems, but these calculations exhibited instability. The average-of-configuration HF method showed better agreement with the experimental ε values for U(IV)–U(VI) systems than the B3LYP method. Overall, electron correlation improved the description of ε for the U(VI)–U(VI) systems but challenges remain with regard to open-shell U(IV) calculations because an energy accuracy of 10−6–10−7Eh is required for lnKnv calculations.
Introduction
Uranium possesses two abundant isotopes having long half-lives, these being 235U and 238U. These isotopes generally exist in two dominant oxidation states (OSs) with differing mobilities: hexavalent U (U(VI)), which is highly soluble in water, and tetravalent U (U(IV)), which is sparingly soluble. The 238U/235U ratio can be significantly affected by redox processes, such as the reduction of U(VI) to U(IV) mediated by abiotic reducing agents or microbial enzymatic activities.1–9 The range of U isotope ratios observed in natural samples, including minerals, sediments and seawater, is quite broad.4,10–14 Hence, these differences in U isotope ratios are expected to be utilized for assessing the redox evolution in Earth's oceans and atmosphere, as well as for enhancing our understanding of the evolution of life on Earth and ongoing subsurface processes. However, the underlying mechanisms governing variations in the isotope ratio (i.e., isotope fractionation) during geochemical processes remain incompletely understood, necessitating further research.In aqueous solution, U(VI) typically adopts the uranyl structure (UO22+) while coordinating with H2O molecules and various anions along the equatorial plane of the cation. The isotope fractionation coefficients (ε) for U(VI)–U(VI) species involving carbonate, chloride, perchlorate and certain carboxylates (such as acetate, lactate and malate) were experimentally determined using ion exchange chromatography.15,16 In such prior work, ε was calculated as the difference in the 238U/235U ratio between a U(VI) species in solution and the hydrated UO22+ bound to a strongly acidic cation exchange resin packed into a column. These experiments were conducted at 298 K and the largest ε value obtained was 0.34‰ between the carbonate and resin-bound hydrated species, showing enrichment of 235U in the former and 238U in the latter. Such prior studies also demonstrated a proportional relationship between ε and the harmonic frequency of the U![[double bond, length as m-dash]](https://www.rsc.org/images/entities/char_e001.gif) O asymmetric stretching mode (ν3).15,16
O asymmetric stretching mode (ν3).15,16
In other work, ε was determined for a U(IV)–U(VI) system in low pH media containing either hydrochloric acid (HCl)17–19 or sulfuric acid (H2SO4).20 These acidic conditions promoted the solubility of U(IV) and facilitated the appearance of an isotopic exchange equilibrium on a reasonable timescale. Previous studies by Fukuda et al. and Fujii et al. reported ε values ranging from 0.9 to 1.4‰ with a measurement error on the order of 20% at temperatures in the range of 303–433 K.17,18 Florence et al. reported an ε value of 1.3 ± 0.8 (2σ)‰ for a direct isotopic exchange reaction in an H2SO4 solution at 308 K.20 More recently, Wang et al. achieved isotopic exchange equilibrium through a direct isotopic exchange reaction in an HCl solution at 298 K.19 Based on the resulting data, ε could be estimated to be 1.65 ± 0.16 (2σ)‰. The consistently positive ε values obtained for these U(IV)–U(VI) systems provided evidence for 238U enrichment in the U(IV) at isotopic equilibrium for the U(IV)–U(VI) system.
The ε value can be theoretically approximated by the sum of the nuclear mass term (lnKnm), which arises from variations in vibrational energy levels resulting from differences in the reduced masses of isotopologues,21 and the nuclear volume term (lnKnv). Please refer to the section entitled “Theory of isotope fractionation in equilibrium” for the definitions of these terms. The latter originates from the difference in the ground-state electronic energies of isotopologues stemming from variations in the volume and shape of the atomic nucleus.22–26 In the case of the isotopic fractionation of heavy elements such as Hg, Tl, Pb and U, lnKnv makes the predominant contribution to ε.22–26 This term is, in turn, greatly affected by relativistic effects because the electron density in the vicinity of a heavy nucleus is correlated with the magnitude of lnKnv.21,24–29 Consequently, the four-component Dirac–Coulomb (DC) Hamiltonian, one of the most accurate relativistic Hamiltonians, has been widely employed to compute lnKnv together with the Hartree–Fock (HF) wave function, representing the DCHF method.25,26,30–35 Previously, the lnKnv value for the chloride U(IV)–U(VI) system was theoretically estimated by Abe et al. using UO2Cl3− and UO2Cl42− as molecular models for U(VI) together with UCl4 as the U(IV) model, employing the DCHF method.32 The lnKnv values calculated for UO2Cl3− and UO2Cl42− were both 1.90‰, in reasonable agreement with the experimental lnKnv value of 2.24‰ at 303 K reported by Fujii et al.18 Nemoto et al. performed lnKnv calculations for the same system using the infinite-order two-component Douglas–Kroll–Hess relativistic Hamiltonian,36–38 based on the HF formalism, and demonstrated that this level of theory yields lnKnv results nearly equivalent to those generated by the DCHF method but with approximately 30 times faster computational speed.39 Nemoto also suggested the possibility of using the exact two-component (X2C) relativistic Hamiltonian38,40–42 as an alternative. In recent studies, the present authors conducted relativistic calculations of lnKnv utilizing the X2C Hamiltonian within the density functional theory (DFT) formalism, which can incorporate electron correlation to some extent while maintaining computational efficiency comparable to that of the HF technique.43–45 However, the effect of employing DFT on the results was not examined in detail in this prior research. To the best of our knowledge, the effects of electron correlation on lnKnv have been examined only with regard to the Hg(0)–Hg(II) systems in work by Wiederhold et al. and Schable.46,47 In prior studies, employing second-order Møller–Plesset perturbation (MP2) theory48 and coupled cluster singles, doubles and perturbative triples (CCSD(T))49,50 provided better agreement with experimental data (within a 6% error) and up to a 29% difference compared with HF results. Notably, in the case of U, the close energy levels of the valence orbitals (that is, the 5f, 6d and 7s orbitals)51 highlight the potential importance of static electron correlation in the theoretical treatment of U and suggest the necessity of an extensive investigation into the role of such orbitals in U isotope fractionation.
The present work employed various relativistic electron correlation methods to explore the impact of electron correlation on uranium isotope fractionation and to allow the calculations of accurate ε values. Given the computational complexity of advanced electron correlation methods, this study examined only highly symmetrical small molecules. Thus, we employed UO2X42− (X− = F−, Cl−, Br−) (D4h), UO2(CO3)22− (D2h), UO2(NO3)2 (D2h) and UO2(H2O)42+ (D4h) as hypothetical molecular models for U(VI) and UX4 (X− = F−, Cl−, Br−) (Td) as the U(IV) counterparts (as illustrated in Fig. 1). Note that the point group symmetry of each molecule is indicated in parentheses above. The HF, B3LYP, MP2,48,52 CCSD, CCSD(T),49,50 Fock-space CCSD (FSCCSD),53 complete active-space configuration interaction (CASCI), CAS second-order perturbation theory (CASPT2),54–56 restricted active-space CI (RASCI) and RAS second-order perturbation theory (RASPT2)57 techniques were employed along with the X2C Hamiltonian for the purpose of calculating lnKnv. In addition, HF and B3LYP calculations were carried out to estimate ε values using more realistic asymmetrical large molecular models based on previous experimental studies of U(VI)–U(VI)15,16 and U(IV)–U(VI)17–20 systems. These estimated ε values were subsequently compared with experimental data to evaluate the suitability of the HF and B3LYP formalisms.
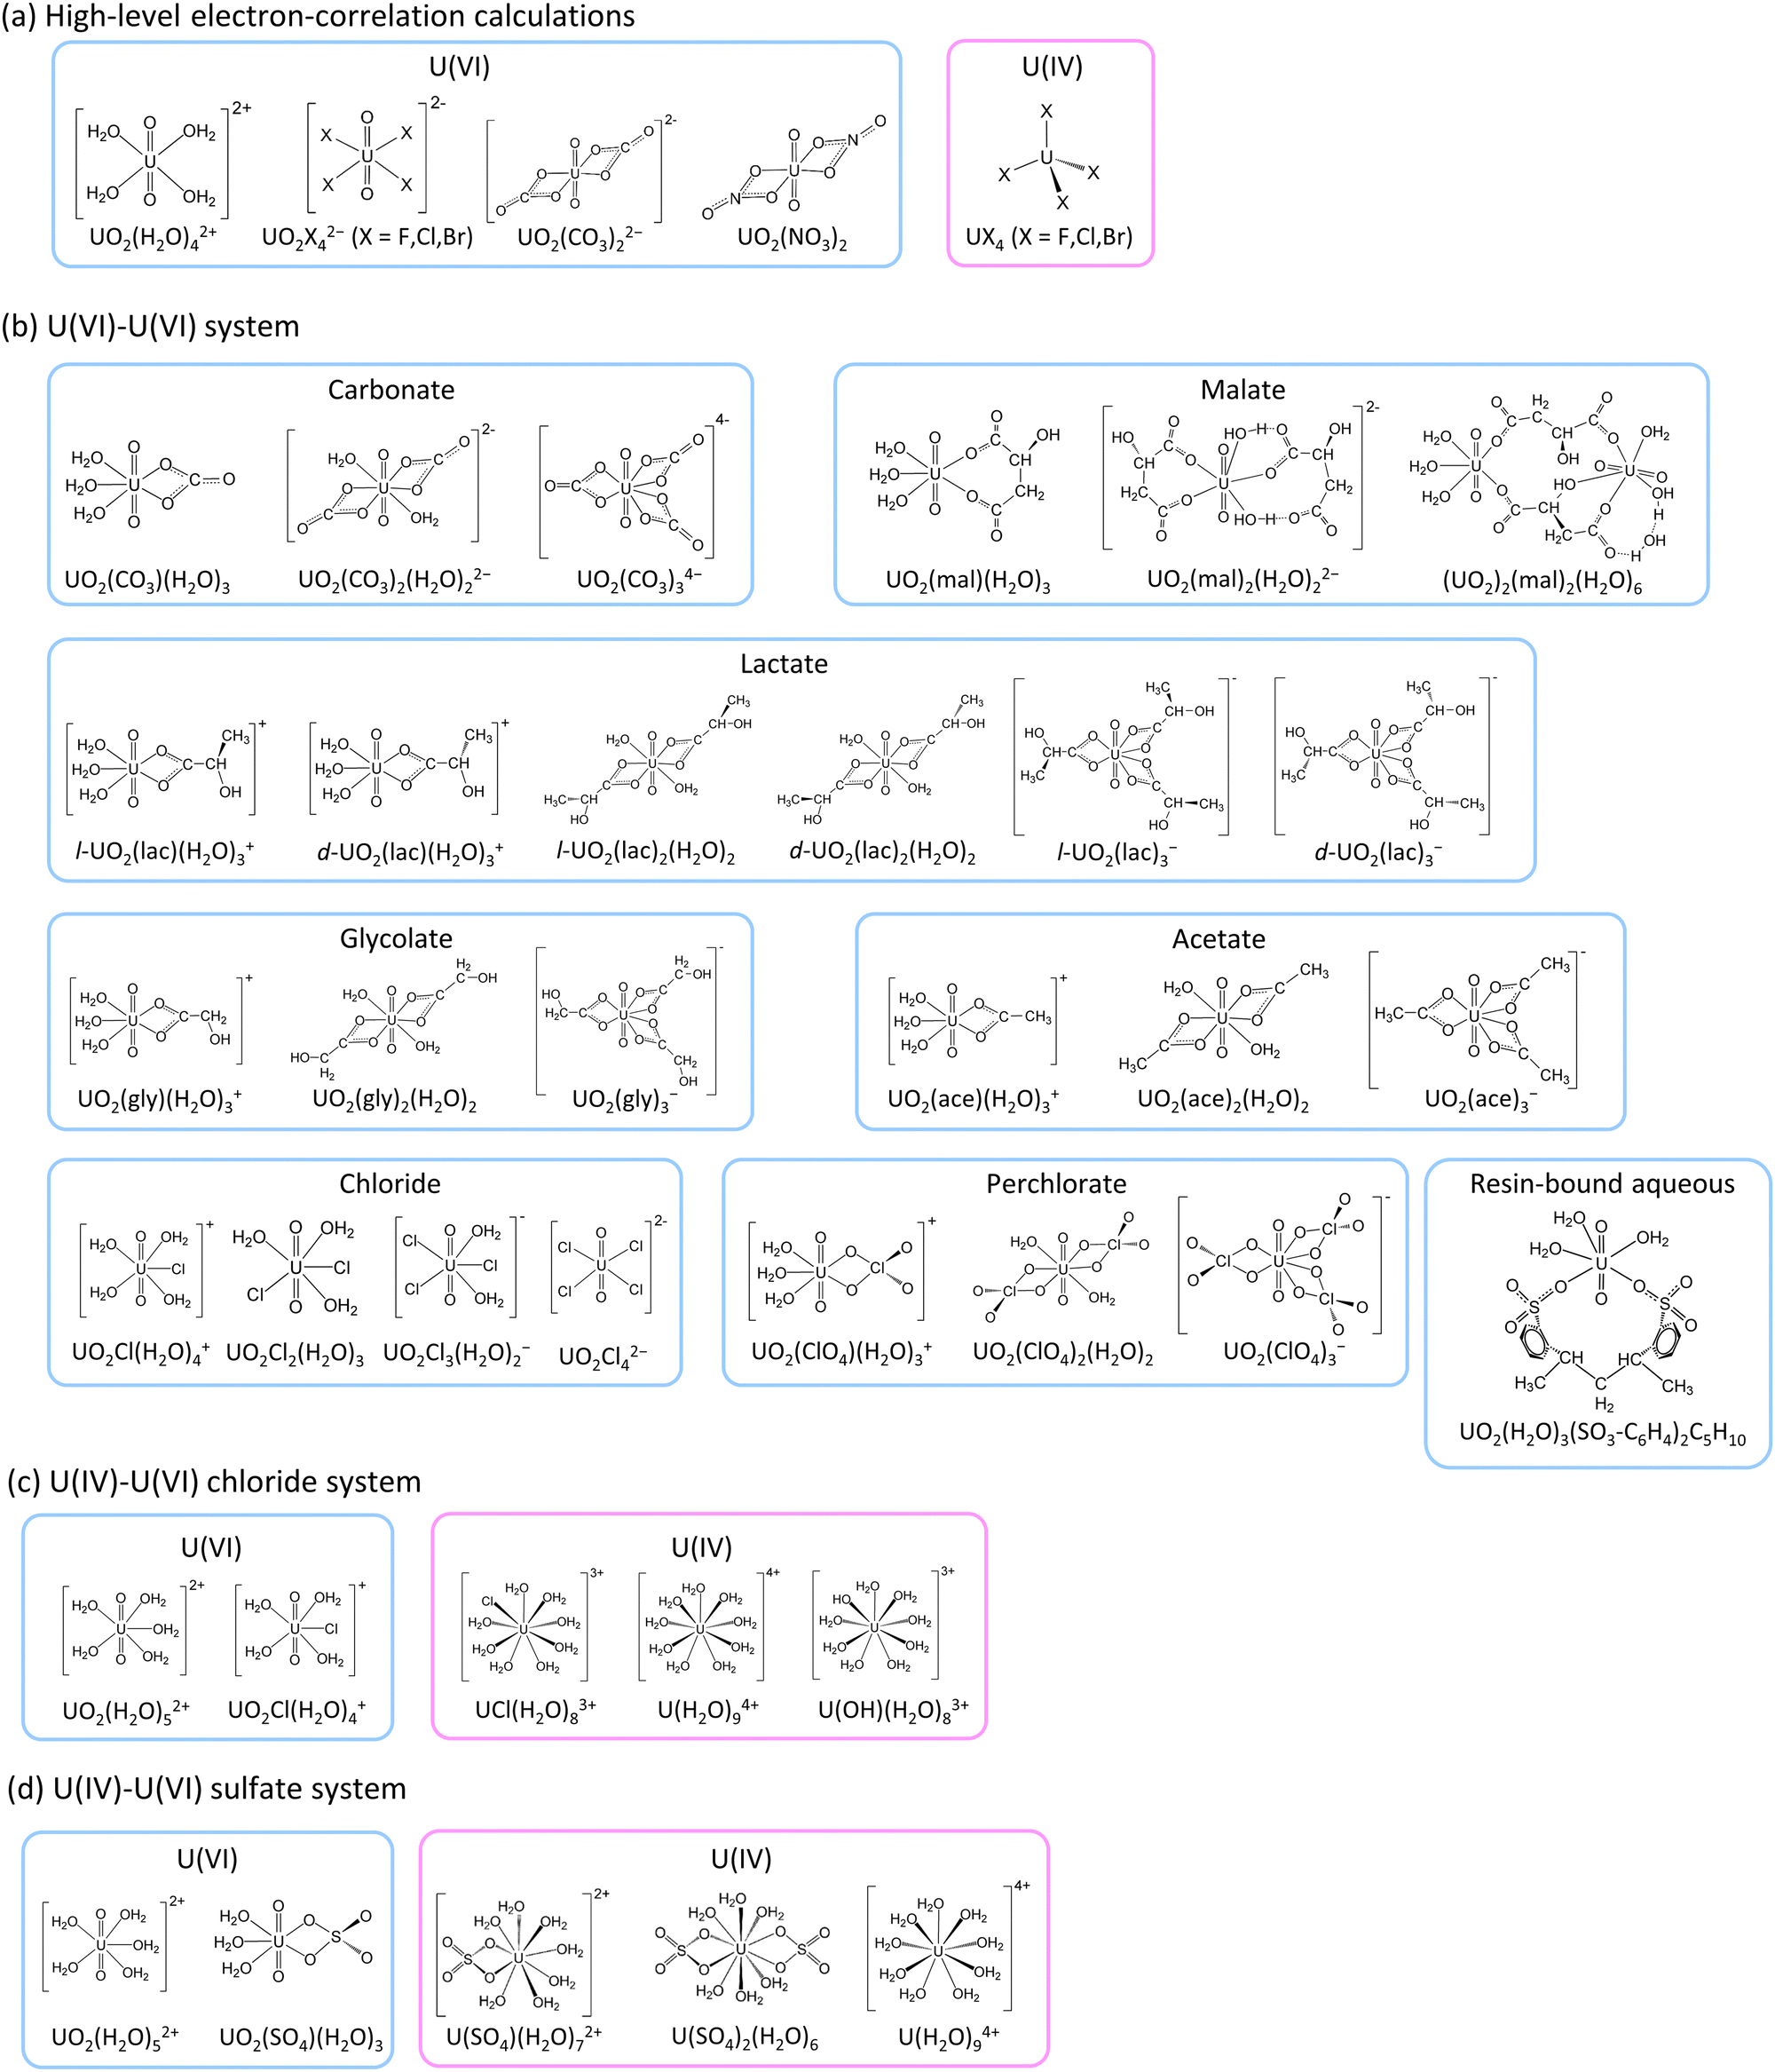 | ||
| Fig. 1 Molecular structures utilized for (a) high-level electron correlation calculations and for comparisons with the experimental (b) U(VI)–U(VI), (c) U(IV)–U(VI) chloride and (d) U(IV)–U(VI) sulfate systems. | ||
Theory of isotope fractionation in equilibrium
An isotope exchange reaction is generally represented as| AX + A′Y ⇌ A′X + AY, | (1) |
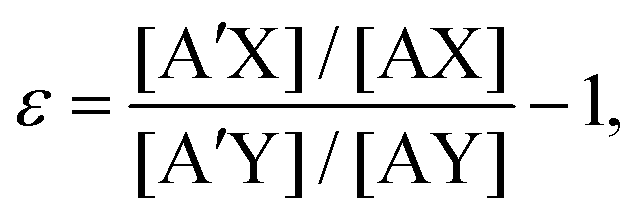 | (2) |
K. The latter may be expressed as the sum of two major terms, these being the nuclear mass term, lnKnm,21 and nuclear volume term, lnKnv.22–26 This expression is| ε = K − 1 ≅ lnK ≈ lnKnm + lnKnv. | (3) |
Knm can, in turn, be calculated as the difference of the logarithms of the reduced partition function ratio (β) between AX and AY, as| lnKnm = lnβ(AY) − lnβ(AX), | (4) |
β can be defined based on the harmonic vibrational frequencies (νι) as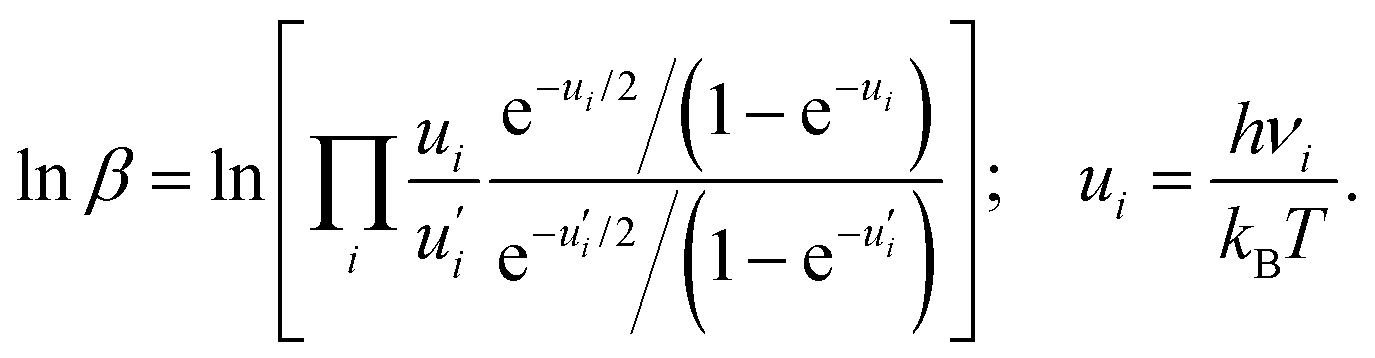 | (5) |
In contrast, lnKnv is calculated based on the electronic energy difference between the two isotopologues (ΔEnv) using finite-size nuclear charges. The associated equation is
| lnKnv = [ΔEnv(AX) − ΔEnv(AY)]/kBT = [{E(AX) − E(A′X)} − {E(AY) − E(A′Y)}]/kBT, | (6) |
Knv will result from an electronic energy variance of approximately 1 × 10⁻⁶Eh. Because of the significant effect of this minute energy change on lnKnv, it is crucial to exercise caution to avoid numerical errors when optimizing electronic energies.
Computational details
The ground state geometry optimizations and vibrational analyses associated with the lnKnm calculations were conducted using the Gaussian16 software package.58 The initial structures of the perchlorate and carboxylate ligands used for geometry optimization were taken from the database generated by the PubChemQC project.59,60 The DFT approach with the B3LYP functional, which combines Becke's three-parameter non-local hybrid exchange potential with Lee–Yang–Parr non-local functionals,61–63 was employed. The electronic structure of the U atom was described by utilizing the Stuttgart small-core relativistic effective core potential (RECP) referred to as ECP60MWB64 together with a contracted Gaussian basis set [10s, 9p, 5d, 4f, 3g].65 In the case of calculations involving Br, the ECP28MWB66 RECP was used along with a contracted Gaussian basis set [4s, 4p, 3d, 2f]67 while the 6-31++G(d,p) basis set was employed for all other atoms.68–76 When employing the polarizable continuum model (PCM)77 during geometry optimization calculations, convergence was not achieved for certain molecules. Hence, this work reports lnKnv and lnKnm values only for optimized gas phase geometries for all molecules. In the case of those molecules for which geometry optimization was possible regardless of whether or not the PCM was used, employing this model did not greatly affect the lnKnv or lnKnm values that were obtained, as shown in Section S1 in the ESI.†
Electronic energy calculations were performed using the X2C relativistic Hamiltonian38,40–42 implemented in the DIRAC16 software package78,79 with the HF and DFT formalisms to obtain lnKnv. In the case of the DFT calculations, we employed the B3LYP hybrid exchange–correlation functional.61–63 In a previous study by the authors,43 the Perdew–Burke–Ernzerhof (PBE) approach80 and Coulomb-attenuating method (CAM)-B3LYP81 were evaluated and minimal differences from the B3LYP results were observed for the majority of molecules. However, unlike the B3LYP method, these functionals produced unusual lnKnv values for some large molecules. Consequently, the present work used only the B3LYP functional in DFT calculations. Restricted HF calculations were performed for the U(VI) closed-shell systems whereas calculations involving U(IV) open-shell systems employed the average-of-configuration (AOC) method in which the energy was averaged over all possible configurations in the active space formed by open-shell molecular orbitals (MOs).82 Six spinors were selected for the AOC method, primarily comprising U 5f5/2 as the open-shell. In contrast, during the DFT calculations, fractional occupation of the open-shell MOs was employed while calculating the energy for a configuration in which the occupation number of each open-shell MO was the same fractional value.
In the case of small highly symmetric molecules, lnKnv was computed using the advanced electron correlation methods MP2,48,52 CCSD, CCSD(T)49,50 or FSCCSD53 implemented in the DIRAC21 software package.78,83 MP2 calculations were conducted only for the closed shell U(VI) species because the MP2 program implemented in DIRAC21 assumed canonical orbitals, which may not have been correct for open-shell calculations. As an alternative, the CASPT254–56 approach was used for calculations concerning open-shell U(IV), using an active space defined by two electrons in six 5f5/2 spinors and with a reference function based on the CASCI technique. The effect of expanding the active space was assessed by performing RASCI-RASPT2 calculations employing different RAS1–RAS3 spaces, as detailed in subsequent sections and in the ESI.† Improved virtual orbital (IVO) methods84,85 were also introduced in conjunction with the CAS/RAS calculations. Because many MOs were nearly degenerate relative to the highest occupied MO (HOMO) and lowest unoccupied MO (LUMO) in UO2Br42− and in UBr4, RASPT2 calculations were not carried out for these molecules. The MOs extending from the occupied orbital comprising the U 6s orbital to the virtual orbital below the orbital energy of 20.0 Eh were considered in these electron correlation calculations, based on a prior survey of the virtual cut-off threshold energy values as described in Section S2 in the ESI.† Those MOs were determined at the HF or HF(AOC) level. Specifically, in the case of the FSCCSD calculations for U(IV) species, the electronic state of UX42+ was initially calculated as a closed shell system by removing two electrons from the 5f orbitals. Following this, two electrons were added to seven MOs (i.e., fourteen spinors) ranging from the LUMO to the LUMO+6 to form the Fock space. The basis sets consisted of Dyall's double-zeta basis set (Dyall.cv2z) for U,86 Dyall.cv2z with the diffuse functions (Dyall.acv2z) for Br87–89 and 6-31++G(d,p) for the remaining atoms.68–76 Note that the effect of the basis set on the lnKnv value is described in Section S3 in the ESI.† A Gaussian-type finite nucleus model90 incorporating root-mean-square nuclear charge radii of 5.8571 fm and 5.8337 fm for 238U and 235U, respectively,91 was utilized.
In the case of the HF and B3LYP calculations, the MOs were optimized solely for 238U isotopologues and then used to determine the electronic energy values for the 235U isotopologues without self-consistent-field (SCF) iterations, which was considered a suitable approximation.43,92–94 However, utilizing the identical MOs for the MP2, CASPT2 and RASPT2 calculations produced lnKnv values nearly identical to those obtained from the HF, CASCI and RASCI calculations, respectively. This outcome is attributed to the dependence of the second-order correlation energy on both the two-electron integrals and the differences in orbital energies. In the case that the same MOs are used for two different isotopologues, the two-electron integrals will be unaffected by the nuclear volume difference whereas the orbital energies will be modified. However, this effect of the nuclear volume difference on the two orbital energies may not be significant. Hence, employing the MP2 method should have only a minimal effect on lnKnv. Consequently, orbital relaxation effects had a greater impact in these calculations. To address this phenomenon, the MOs for both isotopologues were optimized through high-level theory calculations as well as in the HF and B3LYP calculations for comparison.
A temperature of 298 K was adopted for all calculations, unless otherwise specified. The OS of U was confirmed from the Mulliken spin density95 in the RECP-B3LYP calculations and the Mulliken population95 of U 5f orbitals in the open-shell MOs during the X2C calculations, following the methodology employed in a previous study.43 The compositions of molecular species under the experimental conditions of the sulfate U(IV)–U(VI) system20 were predicted by conducting speciation simulations using the Visual MINTEQ 3.1 software package.96 These simulations assumed a pH of 0.456 and a temperature of 308 K as reported in the literature.20 This pH corresponded to an H+ concentration of 0.35 M. The concentrations of UO22+, U4+ and SO42− were set to 0.1, 0.1 and 0.175 M, respectively. In contrast, calculations involving the chloride system employed the proportions of molecular species reported by Wang et al., as predicted using the MINEQL software package.19
Results and discussion
(1) Impact of electron correlation on ln![[thin space (1/6-em)]](https://www.rsc.org/images/entities/h3_char_2009.gif) Knv for small, highly symmetrical molecules
Knv for small, highly symmetrical molecules
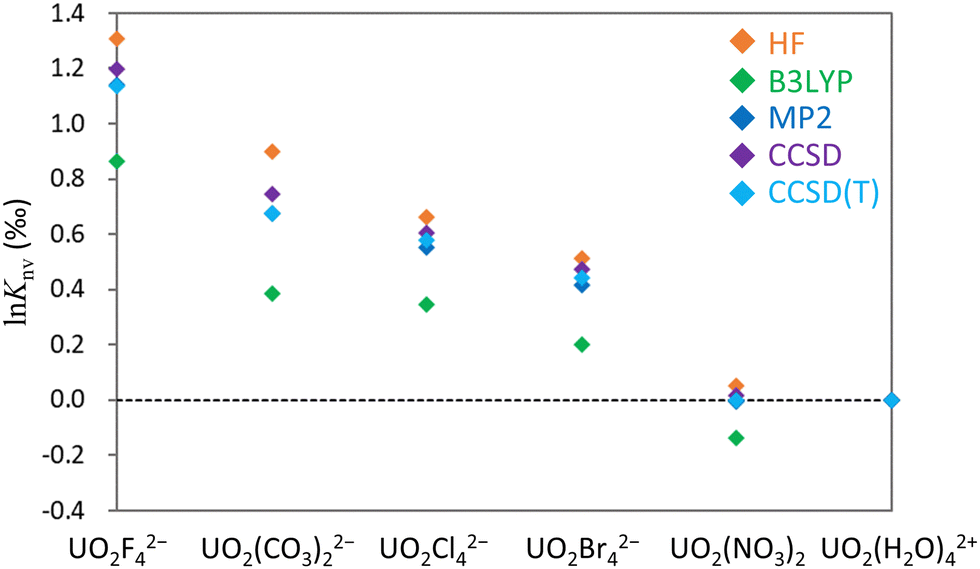
Knv values using various correlation methods within the X2C Hamiltonian framework. As a consequence of computational limitations, this work focused on the small, highly symmetrical molecules UO2X42− (X− = F−, Cl−, Br−), UO2(CO3)22−, UO2(NO3)2 and UO2(H2O)42+ for U(VI) and UX4 (X− = F−, Cl−, Br−) for U(IV) (Fig. 1). A U(IV) state in which two electrons occupied U 5f as an open-shell structure was successfully obtained, as confirmed by spin density analysis and the occupation numbers of U 5f orbitals (see Section S4 in ESI†). The lnKnv values obtained for U(VI)–U(VI) and U(IV)–U(VI) are summarized in Tables 1 and 2, respectively. The isotope fractionations of U(VI)–U(VI) species occur via ligand exchange reactions without changing the main uranyl structure (OUO2+). In contrast, isotope fractionation of U(IV)–U(VI) involves the exchange of isotopes between different OSs such that the magnitude of lnKnv for a U(IV)–U(VI) system is generally larger than for a U(VI)–U(VI) system.
Knv values for the U(VI)–U(VI) systems obtained using the HF, B3LYP, MP2, CCSD and CCSD(T) methods. The upper part of the table displays results obtained using MOs optimized for 238U for both isotopologues, whereas the lower part presents the results obtained using individually optimized MOs for 235U and 238U. All values are referenced to UO2(H2O)42+ and are presented in units of permil (‰)
| MO optimization only for 238U | HF | B3LYP | MP2 | CCSD | CCSD(T) |
|---|---|---|---|---|---|
| UO2F42− | 1.31 | 0.86 | 1.30 | 1.18 | 1.12 |
| UO2(CO3)22− | 0.90 | 0.39 | 0.90 | 0.71 | 0.65 |
| UO2Cl42− | 0.66 | 0.34 | 0.66 | 0.59 | 0.56 |
| UO2Br42− | 0.56 | 0.24 | 0.57 | 0.50 | 0.48 |
| UO2(NO3)2 | 0.06 | −0.14 | 0.07 | 0.00 | −0.01 |
| Individual MO optimizations | HF | B3LYP | MP2 | CCSD | CCSD(T) |
|---|---|---|---|---|---|
| UO2F42− | 1.31 | 0.86 | 1.14 | 1.20 | 1.14 |
| UO2(CO3)22− | 0.90 | 0.39 | 0.68 | 0.75 | 0.67 |
| UO2Cl42− | 0.66 | 0.34 | 0.55 | 0.61 | 0.58 |
| UO2Br42− | 0.55 | 0.23 | 0.46 | 0.52 | 0.50 |
| UO2(NO3)2 | 0.05 | −0.14 | −0.01 | 0.02 | 0.00 |
Knv values for U(IV)–U(VI) systems obtained using the HF(AOC), B3LYP, CCSD, CCSD(T), FSCCSD, CASCI, CASPT2, RASCI and RASPT2 methods. The upper part of the table displays the results obtained using MOs optimized for 238U for both isotopologues whereas the lower part presents the results obtained using individually optimized MOs for 235U and 238U. All values are expressed in units of ‰
| MO optimization only for 238U | HF(AOC) | B3LYP | CCSD | CCSD(T) | FSCCSD | CASCI | CASPT2 | RASCI | RASPT2 |
|---|---|---|---|---|---|---|---|---|---|
| a Because the FSCCSD calculations for UBr4 did not converge, calculated values are not provided. b In the case of the CASCI and CASPT2 calculations, CAS(2e,10s) was used for UO2F42− and UO2Cl42− whereas CAS(2e,6s) was used for UF4, UCl4 and UBr4. Here, CAS(2e,6s) indicates that the CAS consisted of two electrons in six spinors. However, due to the degeneracy of a large number of the MOs relative to the LUMO of UO2Br42−, the MP2 energy was instead used in calculations involving this molecule. c The RAS1, RAS2 and RAS3 calculations used 12, 0 and 8 spinors for UO2F42−, respectively, and 4, 6 and 8 for UF4, respectively. Similarly, for UO2Cl42−, these values were 8, 0 and 8 while the values for UCl4 were 4, 6 and 8, respectively. The numbers of active electrons were 12, 6, 8 and 6 for UO2F42−, UF4, UO2Cl42− and UCl4, respectively. | |||||||||
| UO2F42−–UF4 | 3.64 | 2.26 | 2.98 | 2.79 | 2.49 | 3.76b | 3.70b | 3.76c | 3.69c |
| UO2Cl42−–UCl4 | 2.71 | 1.82 | 2.04 | 1.91 | 1.39 | 2.78b | 2.73b | 2.77c | 2.75c |
| UO2Br42−–UBr4 | 2.54 | 1.77 | 1.87 | 1.75 | N/Aa | 2.60b | 2.53b | — | — |
![[thin space (1/6-em)]](https://www.rsc.org/images/entities/b_char_2009.gif) Knv on molecular orbitals in U(VI)–U(VI) systems.
From Table 1 it is apparent that the two lnKnv values obtained using optimized MOs for a single isotopologue (238U) and for individual isotopologues (235U and 238U) were nearly identical at the HF and B3LYP levels, consistent with prior reports.93,94 Using the MP2 method while employing identical MOs produced results close to those obtained from the HF technique. As discussed in the preceding section, using individual MOs yielded outcomes similar to those from the CCSD and CCSD(T) methods. The CCSD and CCSD(T) results demonstrate that switching between identical MOs and individual MOs has a minimal effect on lnKnv, suggesting that orbital rotation effects are appropriately incorporated through single excitation operators in the exponential ansatz.
Knv values if individual MOs are used in the MP2 calculations. In all cases, CCSD(T) values are intermediate between those derived from the HF and B3LYP methods. Consequently, it appears that the HF technique typically provides an overestimation whereas B3LYP calculations underestimate the values relative to those produced by the CCSD(T) method. The MP2 technique is evidently a cost-effective approach to predicting lnKnv for closed-shell U(VI) states, although it remains computationally intensive in the case of calculations involving asymmetric medium-sized molecules. In such cases, it is likely that the true theoretical value lies between the outcomes of the HF and B3LYP calculations. The largest difference between the HF and CCSD(T) results of 0.23‰ was observed for calculations involving UO2(CO3)22− and UO2(H2O)42+. This outcome demonstrates that electron correlation can affect the lnKnv of a U(VI)–U(VI) system by approximately 0.2‰.
Knv on molecular orbitals in U(VI)–U(VI) systems.
From Table 1 it is apparent that the two lnKnv values obtained using optimized MOs for a single isotopologue (238U) and for individual isotopologues (235U and 238U) were nearly identical at the HF and B3LYP levels, consistent with prior reports.93,94 Using the MP2 method while employing identical MOs produced results close to those obtained from the HF technique. As discussed in the preceding section, using individual MOs yielded outcomes similar to those from the CCSD and CCSD(T) methods. The CCSD and CCSD(T) results demonstrate that switching between identical MOs and individual MOs has a minimal effect on lnKnv, suggesting that orbital rotation effects are appropriately incorporated through single excitation operators in the exponential ansatz.
Knv values if individual MOs are used in the MP2 calculations. In all cases, CCSD(T) values are intermediate between those derived from the HF and B3LYP methods. Consequently, it appears that the HF technique typically provides an overestimation whereas B3LYP calculations underestimate the values relative to those produced by the CCSD(T) method. The MP2 technique is evidently a cost-effective approach to predicting lnKnv for closed-shell U(VI) states, although it remains computationally intensive in the case of calculations involving asymmetric medium-sized molecules. In such cases, it is likely that the true theoretical value lies between the outcomes of the HF and B3LYP calculations. The largest difference between the HF and CCSD(T) results of 0.23‰ was observed for calculations involving UO2(CO3)22− and UO2(H2O)42+. This outcome demonstrates that electron correlation can affect the lnKnv of a U(VI)–U(VI) system by approximately 0.2‰.
 | ||
| Fig. 2 lnKnv values for the U(VI)–U(VI) system generated using the HF, B3LYP, MP2, CCSD and CCSD(T) methods. The horizontal axis indicates the molecule under consideration while the vertical axis shows lnKnv values in permil (‰). UO2(H2O)42+ served as the reference for all calculations. | ||
Knv on molecular orbitals in U(IV)–U(VI) systems.
In calculations involving the U(IV)–U(VI) systems shown in Table 2, the use of either identical MOs or individual MOs did not affect the lnKnv values at the HF, B3LYP, CCSD and CCSD(T) levels, similar to the results obtained for the U(VI)–U(VI) system that are shown in Table 1. At the MP2, CASPT2 and RASPT2 levels, employing identical MOs produced results similar to those generated using the HF, CASCI and RASCI methods, respectively, as discussed in the preceding section. Hence, it is important to employ individual MOs so as to incorporate electron correlation effects when using these perturbation methods. In addition, using identical MOs gave quite different lnKnv values from those produced with individual MOs at the FSCCSD levels, suggesting that orbital rotation effects may not be sufficient to account for the relaxation of MOs for different nuclear radii in FSCCSD calculations.
Knv using individual MOs, it is crucial to obtain two sets of subtly distinct MOs solely as a consequence of differences in the nuclear volume. However, optimizing individual MOs through different SCF procedures can lead to more significant disparities in virtual MOs compared with the differences resulting solely from nuclear volume variations. This phenomenon can, in turn, produce numerical instability when applying the CASPT2, RASPT2 and FSCCSD methods to describe lnKnv. The appearance of such instability may be confirmed by calculating additional lnKnv values using different nuclear radii and assessing the linearity of the correlation between lnKnv and nuclear radius. Particularly in the case of the CASPT2 approach, significant instabilities appeared when the CASCI reference states were completely degenerate within the same irreducible representation. Calculations involving UX4 molecules as U(IV) species generated three completely degenerate states in the ground state at the CASCI level. One such state had A symmetry while the others had B symmetry in the case that the C2 double group was used as the Abelian group. In this scenario, a unique set of CI coefficients for the CASCI process could not be determined during the matrix diagonalization for each nuclear radius calculation. This may have produced small numerical errors in the CASPT2 energies (on the order of 10−6–10−7Eh) that prevented a precise comparison of the energy values associated with the different nuclear radii, which is a prerequisite for the calculation of lnKnv. Interestingly, the CASPT2 calculations for the non-degenerate state with A symmetry did not indicate numerical instability, and so the data related to the ground state of UX4 are considered reliable. Employing the RASCI/RASPT2 method was shown to remove the degeneracy found in the CASCI results although greater numerical instability appeared in the RASPT2 results obtained without using the IVO technique. Even in the case that the IVO process was combined with the RASPT2 method, nonlinear trends with respect to the nuclear radii values sometimes emerged, depending on the choice of RAS. A more detailed discussion concerning the effect of the RAS technique, numerical instability and other factors is provided in Section S5 in the ESI.† It should be noted that the RASPT2 data in Table 2 do not show such numerical instability. The UCl4 calculations using the FSCCSD method with independent MOs generated lnKnv values that did not exhibit instability, although the ground state was obtained as a non-degenerate system. Similarly, the CCSD and CCSD(T) calculations for A and B symmetries did not show any degeneration of the ground state (see Section S6 in the ESI†).
Knv values, suggesting that the treatment of open-shell MOs via the AOC or CASCI procedures does not significantly affect lnKnv. Analogous to the U(VI)–U(VI) results, the lnKnv values obtained through the CCSD and CCSD(T) methods were intermediate between those obtained from HF and B3LYP calculations. The FSCCSD, CASPT2 and RASPT2 methods all produced comparable lnKnv values that were either equivalent to or less than the values obtained from B3LYP calculations.
Knv with experimental data in the UO2Cl42−–UCl4 system (for reference only).
The molecular models used for UO2Cl42− and UCl4 in the present work may align with those reported by Fujii et al. based on experiments employing high HCl concentrations.18 Under these HCl-rich conditions, hexavalent uranyl can potentially coordinate with three or four Cl− ions and water molecules whereas tetravalent uranium forms neutral UCl4 and also undergoes coordination with water. Even so, attempts to simulate these species using Visual MINTEQ 3.1 did not converge, likely because of the very high HCl concentration used in the experimental work. Below, the present results are compared with the experimental data published by Fujii et al., although it should be noted that uncertainty regarding the molecular structures and a reported large experimental error in ε (∼20%) may make accurate comparisons challenging.
The lnKnv value when converted to 298 K using the temperature-dependent equation reported by Fujii et al. was found to be 2.32‰. It was also evident that the HF(AOC) and CASCI methods tended to overestimate the experimental lnKnv while the B3LYP technique provided an underestimate. Theoretically, the multireference electron correlation methods (that is, the FSCCSD, CASPT2 and RASPT2 methods) have the potential to precisely describe the electronic state of U(IV), which comprises a degenerate open-shell system. However, these methods collectively underestimated the experimental value. The FSCCSD approach might have yielded a smaller lnKnv because of the lower occupation number of U 5f orbitals in the MOs specified as the Fock space for UCl42+ (see Section S7 in the ESI†). This lower occupation number could potentially reduce the shielding effect of open-shell 5f electrons on valence s orbitals (that is, those in 6s and 7s orbitals). The numerical instability associated with certain computational settings may impede the CASPT2 and RASPT2 methods from accurately estimating the electronic energy values required for lnKnv calculations. Even though the CCSD and CCSD(T) approaches are generally not suitable for degenerate or open-shell systems, the present calculations exhibit moderate values of single or double-excitation amplitudes (see Section S8 in the ESI†), suggesting the absence of serious collapse of the numerical simulations. However, it remains unclear from this analysis whether the theoretically correct electronic state was obtained. Despite this uncertainty, the CCSD and CCSD(T) methods yielded the lnKnv values closest to the experimental value reported by Fujii et al. when compared with the results from the other methodologies.
(2) Comparison between experimental and theoretical ε obtained using the HF and B3LYP methods
Knv, lnKnm and ε values for U(VI) species with anionic ligands such as carbonate, malate, lactate, glycolate, acetate, chloride and perchlorate were calculated and compared with existing experimental ε values for U(VI)–U(VI) systems.15,16 In these calculations, UO2(H2O)3(SO3-C6H4)2C5H10, which has a hydrated uranyl structure when attached to a cation exchange resin (Fig. 1), was used as a reference for calculations of ε. In the case of the nonsymmetric medium-size systems, only the HF and DFT methods have sufficiently low computational costs to be employed for lnKnv calculations. Because the lnKnm values were solely derived from the RECP-B3LYP technique, these values were used uniformly in all ε calculations, regardless of whether lnKnv was obtained from X2C-HF or X2C-B3LYP calculations. Given the unknown coordination numbers of the ligands in the actual experiments, all conceivable patterns of coordination numbers were used in these computations. The resulting data are summarized in Table 3 and plotted in Fig. 3.
Knv, lnKnm and ε values for the U(VI)–U(VI) systems. The values of lnKnv calculated using the X2C-HF and X2C-B3LYP techniques are shown separately in the HF and B3LYP columns, respectively. The Expt. column presents the experimental ε values for each species.42,43 All values are in units of ‰
| Species | lnKnv |
lnKnm |
ε | ||||
|---|---|---|---|---|---|---|---|
| HF | B3LYP | HF | B3LYP | Expt. | |||
| Carbonate | UO2(CO3)(H2O)3 | 0.66 | 0.17 | −0.04 | 0.62 | 0.13 | 0.34 |
| UO2(CO3)2(H2O)22− | 0.86 | 0.29 | −0.03 | 0.83 | 0.26 | ||
| UO2(CO3)34− | 0.94 | 0.47 | 0.12 | 1.05 | 0.58 | ||
| Malate | UO2(mal)(H2O)3 | 0.66 | 0.23 | −0.08 | 0.58 | 0.15 | 0.22 |
| UO2(mal)2(H2O)22− | 0.75 | 0.34 | −0.07 | 0.68 | 0.27 | ||
| (UO2)2(mal)2(H2O)6 U1 | 0.68 | 0.24 | −0.08 | 0.61 | 0.16 | ||
| (UO2)2(mal)2(H2O)6 U2 | 0.59 | 0.18 | −0.08 | 0.51 | 0.10 | ||
| Lactate | L-UO2(lac)(H2O)3+ | 0.40 | 0.11 | −0.08 | 0.32 | 0.03 | 0.14 |
| D-UO2(lac)(H2O)3+ | 0.43 | 0.05 | −0.08 | 0.36 | −0.03 | ||
| L-UO2(lac)2(H2O)2 | 0.49 | 0.18 | −0.09 | 0.40 | 0.09 | ||
| D-UO2(lac)2(H2O)2 | 0.64 | 0.36 | −0.09 | 0.55 | 0.27 | ||
| L-UO2(lac)3− | 0.51 | 0.30 | −0.02 | 0.49 | 0.28 | ||
| D-UO2(lac)3− | 0.57 | 0.23 | −0.02 | 0.55 | 0.21 | ||
| Glycolate | UO2(gly)(H2O)3+ | 0.42 | 0.08 | −0.08 | 0.35 | 0.00 | 0.10 |
| UO2(gly)2(H2O)2 | 0.64 | 0.13 | −0.09 | 0.54 | 0.03 | ||
| UO2(gly)3− | 0.63 | 0.36 | −0.02 | 0.61 | 0.34 | ||
| Acetate | UO2(ace)(H2O)3+ | 0.42 | 0.21 | −0.08 | 0.34 | 0.13 | 0.09 |
| UO2(ace)2(H2O)2 | 0.54 | 0.20 | −0.10 | 0.44 | 0.11 | ||
| UO2(ace)3− | 0.67 | 0.32 | −0.03 | 0.64 | 0.29 | ||
| Chloride | UO2Cl(H2O)4+ | 0.34 | −0.04 | −0.02 | 0.32 | −0.06 | 0.03 |
| UO2Cl2(H2O)3 | 0.39 | 0.06 | 0.00 | 0.39 | 0.06 | ||
| UO2Cl3(H2O)2− | 0.46 | 0.10 | 0.06 | 0.52 | 0.16 | ||
| UO2Cl42− | 0.63 | 0.19 | 0.13 | 0.76 | 0.32 | ||
| Perchlorate | UO2(ClO4)(H2O)3+ | 0.20 | −0.05 | −0.10 | 0.11 | −0.14 | 0.00 |
| UO2(ClO4)2(H2O)2 | −0.08 | −0.14 | −0.09 | −0.17 | −0.23 | ||
| UO2(ClO4)3− | 0.02 | −0.17 | −0.05 | −0.03 | −0.22 | ||
| Resin-bound aqueous | UO2(H2O)3(SO3-C6H4)2C5H10 | 0.00 | 0.00 | 0.00 | 0.00 | 0.00 | 0.00 |
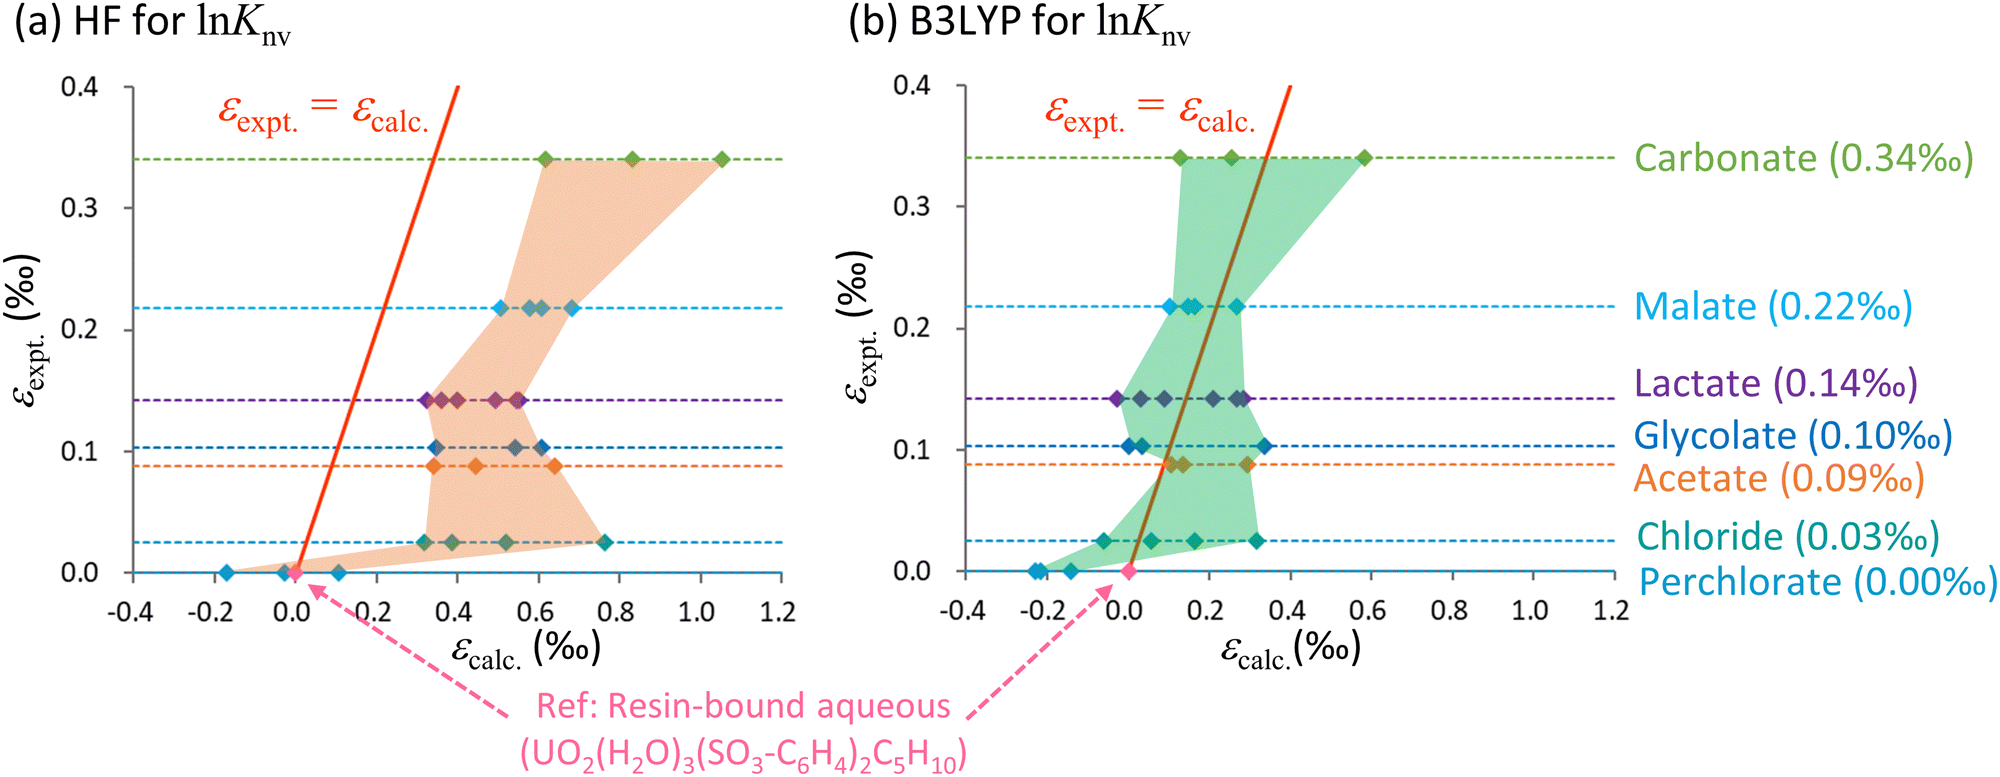 | ||
| Fig. 3 Calculated ε values based on lnKnv obtained using the (a) HF and (b) B3LYP methods along with experimental data for the U(VI)–U(VI) system. The horizontal axis shows the calculated values relative to UO2(H2O)3(SO3-C6H4)C5H10 while the vertical axis shows the experimental values relative to the aqueous UO22+ complex bound to the cation exchange resin. The red solid line indicates the scenario in which the calculated and experimental values are equal. The areas bounded by the values calculated using the HF and B3LYP methods are shaded orange and green, respectively. The dotted lines parallel to the horizontal axis represent the experimental values for each species as described on the right while the quantities in parentheses indicate the experimental data. The numerical data are also summarized in Table 3. | ||
From Table 3, it is evident that lnKnv exceeded lnKnm for both the HF and B3LYP calculations for most species. This finding suggests that differences in electronic states, not vibrational levels, make the primary contribution to isotope fractionation, even in ligand exchange systems. Even among those species having identical ligands, the calculated ε values were greatly affected by the coordination number of the anionic ligand. As an example, the ranges of ε values for carbonate species were 0.44‰ and 0.46‰ for the HF and B3LYP methods.
Fig. 3 provides the ranges of ε values obtained from the HF and B3LYP computations, which reflect the wide variety of coordination numbers for the various ligands. The y = x line represents an identical match between computational and experimental data. In this figure, the area occupied by the B3LYP results aligns more closely with the experimental line compared with the HF region. The HF values also exhibit overestimation similar to that described in the previous section regarding electron correlations calculations, in which the HF results were higher than the CCSD(T) values.
Because the B3LYP values for certain coordination numbers were close to the experimental data, one might expect that such information could be used to predict coordination numbers associated with experimental work. However, the precision of the present ε calculations did not exceed 0.01‰ (corresponding to an electronic energy accuracy of 10−8Eh), rendering the calculated data inadequate for such predictive purposes. Furthermore, achieving convergence to the exact global minimum of electronic states becomes increasingly challenging as molecules grow in size. As an example, in the case of the lactate calculations, there is a deviation of 0.18‰ in the B3LYP results (0.15‰ in the HF results) for the L- and D-enantiomers, which ideally should yield identical values. This discrepancy implies potential convergence to local minima in the SCF for either the L- or D-enantiomer, or even both. Notably, the ε values for the U(VI)–U(VI) systems are smaller than those for the U(IV)–U(VI) systems involving changes in OS. Hence, it should be noted that U(VI)–U(VI) isotopic fractionation coefficients computed through the present ab initio methods might be less accurate.
Intriguingly, previous experimental studies have indicated robust negative linear correlations between the UO antisymmetric stretching frequency, ν3, and ε.15,16 The plot in Fig. 4 includes calculated ν3 value generated using the RECP-B3LYP method along with ε acquired from B3LYP or HF calculations and experimental data. The calculated results qualitatively replicate the experimental trend and demonstrate a negative linear correlation between ν3 and ε. However, the associated R2 values are 0.78 (B3LYP), 0.74 (HF) and 0.99 (experimental), confirming that the calculated results are more scattered than the experimental data. This scattering can possibly be attributed to the use of the RECP-B3LYP method to calculate the vibrational frequencies, whereas lnKnv was determined with the X2C Hamiltonian. As previously noted, achieving convergence to the global minimum of the electronic state becomes increasingly challenging for larger molecules in X2C relativistic calculations. Although the R2 value for the B3LYP results was marginally better than that for the HF values, the former method notably approached the experimental values more closely in terms of both slope and intercept in the ν3–ε plot. This outcome demonstrates the remarkable reproducibility that can be obtained from this technique, not just with regard to direct comparisons with experimental ε values but also in terms of the correlation between ν3 and ε. Hence it is evident that the B3LYP method effectively incorporates the electron correlation effect for the U(VI)–U(VI) system.
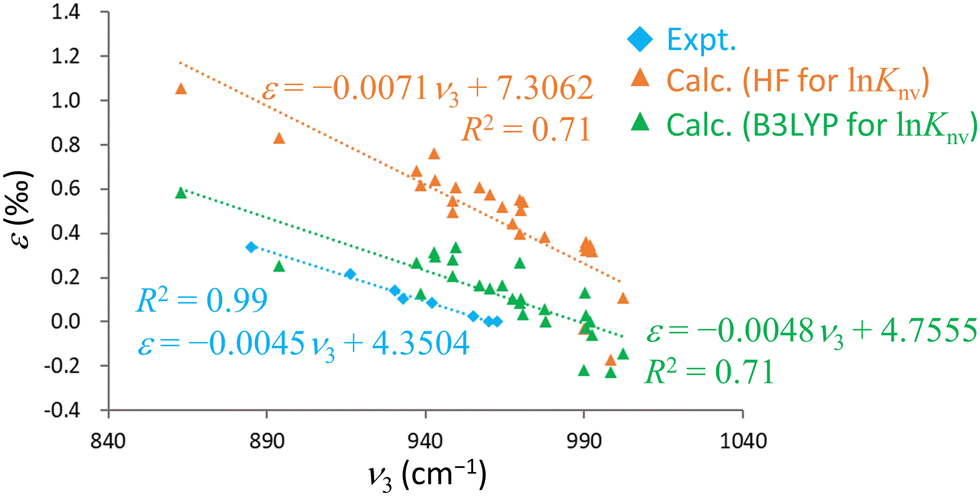 | ||
| Fig. 4 Relationships between ν3 and ε. The horizontal axis shows ν3 in units of cm−1 while the vertical axis shows ε in units of ‰. The dotted lines are linear regressions and r2 is the coefficient of determination in each case. | ||
Knv, lnKnm and ε for the U(IV)–U(VI) systems in hydrochloric and sulfuric acid media, aligning with the experiments conducted by Wang et al. (who determined an ε of 1.65‰ at 298 K)19 and Florence et al. (ε = 1.3‰ at 308 K).20 In the recent HCl media experimentation by Wang et al., the experimental error (0.16‰, 2σ) was approximately one-fourth the magnitude of the error in the experiments using sulfuric acid performed by Florence (0.8‰, 2σ). Table 4 summarizes a plausible list of chemical species present in these experiments and the relative percentages of each. The data for the HCl system were sourced from a paper written by Wang et al.19 while those for the sulfuric system were determined from our own simulations. Based on coordinating the appropriate number of water molecules and optimizing geometries using the RECP-B3LYP method, lnKnv and lnKnm were calculated for each species, employing U(H2O)94+ as a reference. The final ε values were derived through weighted averaging based on the proportion of each species (refer to Table 4). In both the chloride and sulfate systems, the primary U(VI) species was UO2(H2O)52+. In the case of U(IV), the primary species differed between the chlorine-coordinated and sulfate-coordinated configurations but exhibited similar ε values, resulting in similar calculated ε values for the chloride and sulfate systems. Two previous experiments showed a 0.35‰ difference in ε but agreed with each other within the associated experimental errors. The experimental ε values can be seen to fall between the ε values obtained by the HF and B3LYP methods for both the chloride and sulfate systems. Hence, the HF and B3LYP methods tended to overestimate and underestimate the experimental values, respectively. These trends are consistent with the observations discussed in the previous section concerning the effect of electron correlation on the U(VI)–U(VI) system based on a comparison with the CCSD(T) method. However, the deviation between the experimental data and B3LYP results is notably more significant in the case of the U(IV)–U(VI) systems compared with the U(VI)–U(VI) systems, particularly in the case of the chloride species. Considering the successful use of the B3LYP method to describe the U(VI)–U(VI) systems, as discussed earlier, this discrepancy suggests that predicting the open-shell electronic states of U(IV) is more challenging than predicting the closed-shell U(VI) states when employing DFT calculations.
Knv, lnKnm and ε values for the U(IV)–U(VI) chloride and sulfate systems along with the oxidation state (OS) and speciation for each. For lnKnv and ε, separate entries are provided for cases in which lnKnv was computed using the X2C-HF(AOC) and X2C-B3LYP methods in the HF(AOC) and B3LYP columns, respectively. The reference for both chloride and sulfate systems was U(H2O)94+. The proportion of speciation is displayed as a percentage (%) while lnKnv, lnKnm and ε are presented in units of ‰
| Chloride | OS | Proportion of speciation (%) | lnKnv |
lnKnm |
ε | Averaged ε among speciation | Experimental ε | Temperature (K) | |||
|---|---|---|---|---|---|---|---|---|---|---|---|
| HF(AOC) | B3LYP | HF(AOC) | B3LYP | HF(AOC) | B3LYP | ||||||
| UO2(H2O)52+ | VI | 51.7 | 2.59 | 1.76 | −1.03 | 1.56 | 0.73 | 1.73 | 0.89 | 1.65 | 298 |
| UO2Cl(H2O)4+ | VI | 48.3 | 2.88 | 1.83 | −0.98 | 1.90 | 0.85 | ||||
| UCl(H2O)83+ | IV | 95.4 | −0.02 | −0.12 | 0.01 | −0.01 | −0.11 | ||||
| U(H2O)94+ | IV | 3.3 | 0.00 | 0.00 | 0.00 | 0.00 | 0.00 | ||||
| U(OH)(H2O)83+ | IV | 1.3 | −0.04 | −0.01 | −0.14 | −0.17 | −0.14 | ||||
| Sulfate | OS | Proportion of speciation (%) | lnKnv |
lnKnm |
ε | Averaged ε among speciation | Experimental ε | Temperature (K) | |||
|---|---|---|---|---|---|---|---|---|---|---|---|
| HF(AOC) | B3LYP | HF(AOC) | B3LYP | HF(AOC) | B3LYP | ||||||
| UO2(H2O)52+ | VI | 87.8 | 2.50 | 1.70 | −0.98 | 1.52 | 0.72 | 1.75 | 0.94 | 1.3 | 308 |
| UO2(SO4)(H2O)3 | VI | 11.9 | 3.01 | 1.87 | −0.97 | 2.05 | 0.90 | ||||
| U(SO4)(H2O)72+ | IV | 52.2 | 0.15 | −0.17 | −0.12 | 0.03 | −0.28 | ||||
| U(SO4)2(H2O)6 | IV | 45.6 | −0.31 | 0.00 | −0.10 | −0.41 | −0.10 | ||||
| U(H2O)94+ | IV | 1.8 | 0.00 | 0.00 | 0.00 | 0.00 | 0.00 | ||||
Conclusions
To the best of our knowledge, this work is the first to elucidate the effect of electron correlation on U isotope fractionation using various methods (specifically, the HF, HF(AOC), B3LYP, MP2, CCSD, CCSD(T), FSCCSD, CASCI, RASCI, CASPT2 and RASPT2 methods) with the X2C relativistic Hamiltonian. With the exception of the HF and B3LYP techniques, the use of these electron correlation methods was restricted to the analysis of small, highly symmetric molecular models. In calculations involving closed-shell U(VI)–U(VI) systems, the MP2, CCSD and CCSD(T) methods yielded comparable lnKnv values that were intermediate between those obtained from the HF and B3LYP methods. A comparison of the HF and CCSD(T) results indicated that electron correlation modified the lnKnv value by approximately 0.2‰.
In the case of U(IV)–U(VI) systems, an assessment of the effect of electron correlation was more challenging because of the triplet-like open-shell structure of U(IV). The CCSD and CCSD(T) approaches yielded lnKnv values in between those generated by HF and B3LYP calculations, similar to the U(VI)–U(VI) results, while the FSCCSD, CASPT2 and RASPT2 calculations yielded values similar to those obtained from the B3LYP method. Several issues arose in conjunction with the CASPT2, RASPT2 and FSCCSD calculations. Specifically, the CASPT2 and RASPT2 methods sometimes exhibited numerical instability with regard to the lnKnv values while the FSCCSD technique showed insufficient orbital rotation effects and lower occupation of 5f spinors. Assuming the present calculated models involving chlorides are comparable to the experimental work of Fujii et al., the CCSD and CCSD(T) calculations provided the best agreement with the experimental data. However, it remains uncertain whether the CCSD and CCSD(T) methods can describe open-shell U(IV) electronic states correctly.
HF and B3LYP calculations were performed using more experimentally realistic molecular models, and the results were compared with previous experimental results. In the case of the U(VI)–U(VI) systems, the HF approach overestimated the experimental ε values15,16 while the B3LYP results showed good agreement. The linear correlation observed between the UO antisymmetric stretching frequency ν3 and ε in the experimental results16 was reproduced by our HF and B3LYP calculations and the B3LYP values showed better agreement with the experimental trend than those obtained from the HF method. Currently, the number and variety of DFT functionals implemented in the DIRAC software are limited. However, it would be interesting to explore whether using other functionals, such as double hybrid functionals, could further improve the results obtained with B3LYP.
In contrast, calculations involving U(IV)–U(VI) systems with chloride and sulfate indicated that the HF(AOC) technique provided results closer to the experimental values,19,20 whereas the B3LYP method underestimated these values. This outcome highlights the difficulty in accurately describing the open-shell electronic state of U(IV). In principle, DFT methods are not suitable for describing such open-shell degenerate states, although the results obtained may seem correct coincidentally. Multireference electron correlation methods should offer more promising approaches; however, their application to large real systems is currently hindered by computational resource limitations. It is worth noting that similar results were observed for small U(IV)–U(VI) models using B3LYP, CASPT2, and FSCCSD calculations. Assuming this trend extends to larger realistic models, CASPT2 and FSCCSD methods might also underestimate experimental values in these larger scenarios. To address these discrepancies more effectively in future studies, the following calculations may be crucial: (i) employing CASSCF-CASPT2 calculations to improve molecular orbitals, rather than HF(AOC)-CASCI-CASPT2. (ii) Utilizing multi-reference configuration interaction (CI) calculations to surpass the accuracy provided by second-order perturbation theory. (iii) Directly computing large realistic models using massively parallelized multireference programs on supercomputers.
Overall, this work demonstrated that reliable calculation results could be obtained for closed-shell U(VI)–U(VI) systems although determining the electronic state of U(IV) remains challenging. It is also difficult to determine if the U(IV) electronic state has been accurately computed based on lnKnv because the experimental data must be assumed to be reliable, and the molecular model must be credible. In addition, it may be difficult to accurately produce lnKnv values based on electron correlation calculations because this requires an energy accuracy on the order of 10−6–10−7Eh. To address this issue, future work will need to validate and verify the present calculations using other properties that are more readily comparable between the experimental and computational domains, such as spectroscopic properties or thermodynamic properties.
Author contributions
A. S., M. H. and M. A. designed the research; A. S. performed the work and analyzed the data; A. S., M. H. and M. A. wrote the paper.Conflicts of interest
There are no conflicts to declare.Acknowledgements
The authors would like to express their gratitude to Prof. Rizlan Bernier-Latmani (École Polytechnique Fédérale de Lausanne), Dr Aleksandra Kiuberis (University of Groningen), Prof. Lucas Visscher (University of Amsterdam), Emeritus Prof. Yasuhiko Fujii (Tokyo Institute of Technology) and Prof. Tatsuya Suzuki (Nagaoka University of Technology) for helpful discussions. This work was supported by the Japan Society for the Promotion of Science (JSPS) through KAKENHI grant numbers JP22J12551, JP22KJ2553, JP21H01864, JP22K19010, and JP18K05040. The authors thank the Research Center for Computational Science (RCCS)/Institute for Molecular Science (IMS), Okazaki, Japan, for granting time on the high-performance computer for the large-scale calculations involved in this work (22-IMS-C049, 23-IMS-C043). We thank Edanz (https://jp.edanz.com/ac) for editing a draft of this manuscript.References
- C. J. Bopp IV, C. C. Lundstrom, T. M. Johnson, R. A. Sanford, P. E. Long and K. H. Williams, Uranium 238U/235U isotope ratios as indicators of reduction: results from an in situ biostimulation experiment at Rifle, Colorado, U.S.A., Environ. Sci. Technol., 2010, 44(15), 5927–5933, DOI:10.1021/es100643v.
- A. Basu, R. A. Sanford, T. M. Johnson, C. C. Lundstrom and F. E. Löffler, Uranium isotopic fractionation factors during U(VI) reduction by bacterial isolates, Geochim. Cosmochim. Acta, 2014, 136, 100–113, DOI:10.1016/j.gca.2014.02.041.
- L. Newsome, K. Morris and J. R. Lloyd, The biogeochemistry and bioremediation of uranium and other priority radionuclides, Chem. Geol., 2014, 363, 164–184, DOI:10.1016/j.chemgeo.2013.10.034.
- C. H. Stirling, M. B. Andersen, R. Warthmann and A. N. Halliday, Isotope fractionation of 238U and 235U during biologically-mediated uranium reduction, Geochim. Cosmochim. Acta, 2015, 163, 200–218, DOI:10.1016/j.gca.2015.03.017.
- M. Stylo, N. Neubert, Y. Wang, N. Monga, S. J. Romaniello, S. Weyer and R. Bernier-Latmani, Uranium isotopes fingerprint biotic reduction, Proc. Natl. Acad. Sci. U. S. A., 2015, 112(18), 5619–5624, DOI:10.1073/pnas.1421841112.
- A. E. Shiel, T. M. Johnson, C. C. Lundstrom, P. G. Laubach, P. E. Long and K. H. Williams, Reactive transport of uranium in a groundwater bioreduction study: Insights from high-temporal resolution 238U/235U data, Geochim. Cosmochim. Acta, 2016, 187, 218–236, DOI:10.1016/j.gca.2016.05.020.
- M. B. Andersen, C. H. Stirling and S. Weyer, Uranium isotope fractionation, Rev. Mineral. Geochem., 2017, 82(1), 799–850, DOI:10.2138/rmg.2017.82.19.
- S. T. Brown, A. Basu, X. Ding, J. N. Christensen and D. J. DePaolo, Uranium isotope fractionation by abiotic reductive precipitation, Proc. Natl. Acad. Sci. U. S. A., 2018, 115(35), 8688–8693, DOI:10.1073/pnas.1805234115.
- A. Basu, C. Wanner, T. M. Johnson, C. C. Lundstrom, R. A. Sanford, E. L. Sonnenthal, M. I. Boyanov and K. M. Kemmer, Microbial U isotope fractionation depends on the U(VI) reduction rate, Environ. Sci. Technol., 2020, 54(4), 2295–2303, DOI:10.1021/acs.est.9b05935.
- C. H. Stirling, M. B. Andersen, E.-K. Potter and A. N. Halliday, Low-temperature isotopic fractionation of uranium, Earth Planet. Sci. Lett., 2007, 264, 208–225, DOI:10.1016/j.epsl.2007.09.019.
- S. Weyer, A. D. Anbar, A. Gerdes, G. W. Gordon, T. J. Algeo and E. A. Boyle, Natural fractionation of 238U/235U, Geochim. Cosmochim. Acta, 2008, 72, 345–359, DOI:10.1016/j.gca.2007.11.012.
- M. J. Murphy, C. H. Stirling, A. Kaltenbach, S. P. Turner and B. F. Schaefer, Fractionation of 238U/235U by reduction during low temperature uranium mineralisation processes, Earth Planet. Sci. Lett., 2014, 388, 306–317, DOI:10.1016/j.epsl.2013.11.034.
- Y. A. Uvarova, T. K. Kyser, M. L. Geagea and D. Chipley, Variations in the uranium isotopic compositions of uranium ores from different types of uranium deposits, Geochim. Cosmochim. Acta, 2014, 146, 1–17, DOI:10.1016/j.gca.2014.09.034.
- J. M. Rolison, C. H. Stirling, R. Middag and M. J. A. Rijkenberg, Uranium stable isotope fractionation in the Black Sea: Modern calibration of the 238U/235U paleo-redox proxy, Geochim. Cosmochim. Acta, 2017, 203, 69–88, DOI:10.1016/j.gca.2016.12.014.
- H. Y. Kim, M. Kakihana, M. Aida, K. Kogure, M. Nomura, Y. Fujii and M. Okamoto, Uranium isotope effects in some ion exchange systems involving uranyl–carboxylate complexes, J. Chem. Phys., 1984, 81(12), 6266–6271, DOI:10.1063/1.447584.
- T. Aoyama, M. Aida, Y. Fujii and M. Okamoto, Uranium isotope effects in uranyl carbonate complex system, J. Phys. Chem., 1989, 93(6), 2666–2668, DOI:10.1021/j100343a082.
- J. Fukuda, Y. Fujii and M. Okamoto, A fundamental study on uranium isotope separation using U(IV)–U(VI) electron exchange eeaction, Z. Naturforsch., A: Phys. Sci., 1983, 38(10), 1072–1077, DOI:10.1515/zna-1983-1005.
- Y. Fujii, N. Higuchi, Y. Haruno, M. Nomura and T. Suzuki, Temperature dependence of isotope effects in uranium chemical exchange reactions, J. Nucl. Sci. Technol., 2006, 43(4), 400–406, DOI:10.1080/18811248.2006.9711111.
- X. Wang, T. M. Johnson and C. C. Lundstrom, Low temperature equilibrium isotope fractionation and isotope exchange kinetics between U(IV) and U(VI), Geochim. Cosmochim. Acta, 2015, 158, 262–275, DOI:10.1016/j.gca.2015.03.006.
- T. M. Florence, G. E. Batley, A. Ekstrom, J. J. Fardy and Y. J. Farrar, Separation of uranium isotopes by uranium(IV)-uranium(VI) chemical exchange, J. Inorg. Nucl. Chem., 1975, 37(9), 1961–1966, DOI:10.1016/0022-1902(75)80925-0.
- J. Bigeleisen and M. Goeppert-Mayer, Calculation of equilibrium constants for isotopic exchange reactions, J. Chem. Phys., 1947, 15(5), 261–267, DOI:10.1063/1.1746492.
- J. Bigeleisen, Nuclear size and shape effects in chemical reactions. isotope chemistry of the heavy elements, J. Am. Chem. Soc., 1996, 118(15), 3676–3680, DOI:10.1021/ja954076k.
- M. Nomura, N. Higuchi and Y. Fujii, Mass dependence of uranium isotope effects in the U(IV)–U(VI) exchange reaction, J. Am. Chem. Soc., 1996, 118(38), 9127–9130, DOI:10.1021/ja954075s.
- T. Fujii, F. Moynier and F. Albarède, The nuclear field shift effect in chemical exchange reactions, Chem. Geol., 2009, 267(3–4), 139–156, DOI:10.1016/j.chemgeo.2009.06.015.
- N. Dauphas and E. A. Schauble, Mass fractionation laws, mass-independent effects, and isotopic anomalies, Annu. Rev. Earth Planet. Sci., 2016, 44, 709–783, DOI:10.1146/annurev-earth-060115-012157.
- S. Yang and Y. Liu, Nuclear field shift effects on stable isotope fractionation: a review, Acta Geochim., 2016, 35, 227–239, DOI:10.1007/s11631-016-0109-3.
- W. H. King, Isotope shifts in atomic spectra, Kluwer Academic/Plenum, New York, NY, 1984th edn, 1984 Search PubMed.
- S. Knecht and T. Saue, Nuclear size effects in rotational spectra: A tale with a twist, Chem. Phys., 2012, 401, 103–112, DOI:10.1016/j.chemphys.2011.10.030.
- A. Almoukhalalati, A. Shee and T. Saue, Nuclear size effects in vibrational spectra, Phys. Chem. Chem. Phys., 2016, 18, 15406–15417, 10.1039/C6CP01913G.
- E. A. Schauble, Role of nuclear volume in driving equilibrium stable isotope fractionation of mercury, thallium, and other very heavy elements, Geochim. Cosmochim. Acta, 2007, 71, 2170–2189, DOI:10.1016/j.gca.2007.02.004.
- M. Abe, T. Suzuki, Y. Fujii, M. Hada and K. Hirao, An ab initio molecular orbital study of the nuclear volume effects in uranium isotope fractionations, J. Chem. Phys., 2008, 129(16), 164309, DOI:10.1063/1.2992616.
- M. Abe, T. Suzuki, Y. Fujii, M. Hada and K. Hirao, Ligand effect on uranium isotope fractionations caused by nuclear volume effects: An ab initio relativistic molecular orbital study, J. Chem. Phys., 2010, 133(4), 044309, DOI:10.1063/1.3463797.
- T. Fujii, F. Moynier, A. Agranier, E. Ponzevera and M. Abe, Nuclear field shift effect of lead in ligand exchange reaction using a crown ether, Proc. Radiochem. Acta, 2011, 1, 387–392, DOI:10.1524/rcpr.2011.0069.
- T. Fujii, F. Moynier, A. Agranier, E. Ponzevera, M. Abe, A. Uehara and H. Yamana, Nuclear field shift effect in isotope fractionation of thallium, J. Radioanal. Nucl. Chem., 2013, 296, 261–265, DOI:10.1007/s10967-012-2181-4.
- S. Yang and Y. Liu, Nuclear volume effects in equilibrium stable isotope fractionations of mercury, thallium and lead, Sci. Rep., 2015, 5, 12626, DOI:10.1038/srep12626.
- M. Barysz, A. J. Sadlej and J. G. Snijders, Nonsingular two/one-component relativistic Hamiltonians accurate through arbitrary high order in α2, Int. J. Quantum Chem., 1997, 65, 225–239, DOI:10.1002/(SICI)1097-461X(1997)65:3<225::AID-QUA4>3.0.CO;2-Y.
- M. Iliaš, H. J. A. Jensen, V. Kellö, B. O. Roos and M. Urban, Theoretical study of PbO and the PbO anion, Chem. Phys. Lett., 2005, 408(4–6), 210–215, DOI:10.1016/j.cplett.2005.04.027.
- M. Iliaš and T. Saue, An infinite-order two-component relativistic Hamiltonian by a simple one-step transformation, J. Chem. Phys., 2007, 126(6), 064102, DOI:10.1063/1.2436882.
- K. Nemoto, M. Abe, J. Seino and M. Hada, An ab initio study of nuclear volume effects for isotope fractionations using two-component relativistic methods, J. Comput. Chem., 2015, 36(11), 816–820, DOI:10.1002/jcc.23858.
- W. Liu, Ideas of relativistic quantum chemistry, Mol. Phys., 2010, 108(13), 1679–1706, DOI:10.1080/00268971003781571.
- T. Saue, Relativistic Hamiltonians for chemistry: A primer, ChemPhysChem, 2011, 12(17), 3077–3094, DOI:10.1002/cphc.201100682.
- S. Knecht, M. Repisky, H. J. A. Jensen and T. Saue, Exact two-component Hamiltonians for relativistic quantum chemistry: Two-electron picture-change corrections made simple, J. Chem. Phys., 2022, 157(11), 114106, DOI:10.1063/5.0095112.
- A. Sato, R. Bernier-Latmani, M. Hada and M. Abe, Ab initio and steady-state models for uranium isotope fractionation in multi-step biotic and abiotic reduction, Geochim. Cosmochim. Acta, 2021, 307, 212–227, DOI:10.1016/j.gca.2021.05.044.
- A. R. Brown, Y. Roebbert, A. Sato, M. Hada, M. Abe, S. Weyer and R. Bernier-Latmani, Contribution of the nuclear field shift to kinetic uranium isotope fractionation, Geochem. Perspect. Lett., 2023, 27, 43–47, DOI:10.7185/geochemlet.2333.
- A. R. Brown, M. Molinas, Y. Roebbert, R. Faizova, T. Vitova, A. Sato, M. Hada, M. Abe, M. Mazzanti, S. Weyer and R. Bernier-Latmani, The isotopic signature of UV during bacterial reduction, Geochem. Perspect. Lett., 2024, 29, 45–50, DOI:10.7185/geochemlet.2411.
- J. G. Wiederhold, C. J. Cramer, K. Daniel, I. Infante, B. Bourdon and R. Kretzschmar, Equilibrium mercury isotope fractionation between dissolved Hg(II) species and thiol-bound Hg, Environ. Sci. Technol., 2010, 44(11), 4191–4197, DOI:10.1021/es100205t.
- E. A. Schauble, Modeling nuclear volume isotope effects in crystals, Proc. Natl. Acad. Sci. U. S. A., 2013, 110(44), 17714–17719, DOI:10.1073/pnas.1216216110.
- C. Møller and M. S. Plesset, Note on an approximation treatment for many-electron systems, Phys. Rev., 1934, 46(7), 618–622, DOI:10.1103/PhysRev.46.618.
- L. Visscher, T. J. Lee and K. G. Dyall, Formulation and implementation of a relativistic unrestricted coupled-cluster method including noniterative connected triples, J. Chem. Phys., 1996, 105(19), 8769–8776, DOI:10.1063/1.472655.
- A. Shee, L. Visscher and T. Saue, Analytic one-electron properties at the 4-component relativistic coupled cluster level with inclusion of spin-orbit coupling, J. Chem. Phys., 2016, 145(18), 184107, DOI:10.1063/1.4966643.
- R. J. Baker, New reactivity of the uranyl(VI) ion, Chem. – Eur. J., 2012, 18(51), 16258–16271, DOI:10.1002/chem.201203085.
- J. N. P. van Stralen, L. Visscher, C. V. Larsen and H. J. A. Jensen, First-order MP2 molecular properties in a relativistic framework, Chem. Phys., 2005, 311, 81–95, DOI:10.1016/j.chemphys.2004.10.018.
- L. Visscher, E. Eliav and U. Kaldor, Formulation and implementation of the relativistic Fock-space coupled cluster method for molecules, J. Chem. Phys., 2001, 115(21), 9720–9726, DOI:10.1063/1.1415746.
- K. Andersson, P.-Å. Malmqvist, B. O. Roos, A. J. Sadlej and K. Wolinski, Second-order perturbation theory with a CASSCF reference function, J. Phys. Chem., 1990, 94(14), 5483–5488, DOI:10.1021/j100377a012.
- K. Andersson, P.-Å. Malmqvist and B. O. Roos, Second-order perturbation theory with a complete active space self-consistent field reference function, J. Chem. Phys., 1992, 96(2), 1218–1226, DOI:10.1063/1.462209.
- M. Abe, T. Nakajima and K. Hirao, The relativistic complete active-space second-order perturbation theory with the four-component Dirac Hamiltonian, J. Chem. Phys., 2006, 125(23), 234110, DOI:10.1063/1.2404666.
- P. Å. Malmqvist, K. Pierloot, A. R. M. Shahi, C. J. Cramer and L. Gagliardi, The restricted active space followed by second-order perturbation theory method: Theory and application to the study of CuO2 and Cu2O2 systems, J. Chem. Phys., 2008, 128(20), 204109, DOI:10.1063/1.2920188.
- M. J. Frisch, G. W. Trucks, H. B. Schlegel, G. E. Scuseria, M. A. Robb, J. R. Cheeseman, G. Scalmani, V. Barone, G. A. Peters-son, H. Nakatsuji, X. Li, M. Caricato, A. Marenich, J. Bloino, B. G. Janesko, R. Gomperts, B. Mennucci, H. P. Hratchian, J. V. Ortiz, A. F. Izmaylov, J. L. Son-nernberg, D. Williams-Young, F. Ding, F. Lipparini, F. Egidi, J. Goings, B. Peng, A. Petrone, T. Hender-son, D. Ranasinghe, V. G. Zakrzewski, J. Gao, N. Re-ga, G. Zheng, W. Liang, M. Hada, M. Ehara, K. Toyota, R. Fukuda, J. Hasegawa, M. Ishida, T. Nakajima, Y. Honda, O. Kitao, H. Nakai, T. Vreven, K. Throssell, J. A. Montgomery, Jr., J. E. Peralta, F. Ogliaro, M. Bearpark, J. J. Heyd, E. Brothers, K. N. Kudin, V. N. Staroverov, T. Keith, R. Kobayashi, J. Normand, K. Raghavachari, A. Rendell, J. C. Burant, S. S. Iyengar, J. Tomasi, M. Cossi, J. M. Millam, M. Klene, C. Adamo, R. Cammi, J. W. Ochterski, R. L. Martin, K. Morokuma, O. Farkas, J. B. Foresman and D. J. Fox, Gaussian16, Revision C.01, Gaussian, Inc., Wallingford CT, 2016 Search PubMed.
- M. Nakata, The PubChemQC project: A large chemical database from the first principle calculations, AIP Conf. Proc., 2015, 1702(1), 090058, DOI:10.1063/1.4938866.
- M. Nakata and T. Shimazaki, PubChemQC project: A large-scale first-principles electronic structure database for data-driven chemistry, J. Chem. Inf. Model., 2017, 57(6), 1300–1308, DOI:10.1021/acs.jcim.7b00083.
- C. Lee, W. Yang and R. G. Parr, Development of the Colle-Salvetti correlation-energy formula into a functional of the electron density, Phys. Rev. B: Condens. Matter Mater. Phys., 1988, 37(2), 785–789, DOI:10.1103/PhysRevB.37.785.
- A. D. Becke, Density-functional thermochemistry. III. The role of exact exchange, J. Chem. Phys., 1993, 98(7), 5648–5652, DOI:10.1063/1.464913.
- P. J. Stephens, F. J. Devlin, C. F. Chabalowski and M. J. Frisch, Ab initio calculation of vibrational absorption and circular dichroism spectra using density functional force fields, J. Phys. Chem., 1994, 98(45), 11623–11627, DOI:10.1021/j100096a001.
- W. Küchle, M. Dolg, H. Stoll and H. Preuss, Energy-adjusted pseudopotentials for the actinides. Parameter sets and test calculations for thorium and thorium monoxide, J. Chem. Phys., 1994, 100(10), 7535–7542, DOI:10.1063/1.466847.
- X. Cao and M. Dolg, Segmented contraction scheme for small-core actinide pseudopotential basis sets, THEOCHEM, 2004, 673(1–3), 203–209, DOI:10.1016/j.theochem.2003.12.015.
- A. Bergner, M. Dolg, W. Küchle, H. Stoll and H. Preuß, Ab initio energy-adjusted pseudopotentials for elements of groups 13–17, Mol. Phys., 1993, 80(6), 1431–1441, DOI:10.1080/00268979300103121.
- J. M. L. Martin and A. Sundermann, Correlation consistent valence basis sets for use with the Stuttgart–Dresden–Bonn relativistic effective core potentials: The atoms Ga–Kr and In–Xe, J. Chem. Phys., 2001, 114(8), 3408–3420, DOI:10.1063/1.1337864.
- R. Ditchfield, W. J. Hehre and J. A. Pople, Self-consistent molecular-orbital methods. IX. An extended Gaussian-type basis for molecular-orbital studies of organic molecules, J. Chem. Phys., 1971, 54(2), 724–728, DOI:10.1063/1.1674902.
- T. H. Dunning Jr., Gaussian basis functions for use in molecular calculations. IV. The representation of polarization functions for the first row atoms and hydrogen, J. Chem. Phys., 1971, 55(8), 3958–3966, DOI:10.1063/1.1676685.
- W. J. Hehre, R. Ditchfield and J. A. Pople, Self-consistent molecular orbital methods. XII. Further extensions of Gaussian-type basis sets for use in molecular orbital studies of organic molecules, J. Chem. Phys., 1972, 56(5), 2257–2261, DOI:10.1063/1.1677527.
- P. C. Hariharan and J. A. Pople, The influence of polarization functions on molecular orbital hydrogenation energies, Theor. Chim. Acta, 1973, 28, 213–222, DOI:10.1007/BF00533485.
- M. M. Francl, W. J. Pietro and W. J. Hehre, Self-consistent molecular orbital methods. XXIII. A polarization-type basis set for second-row elements, J. Chem. Phys., 1982, 77(7), 3654–3665, DOI:10.1063/1.444267.
- M. S. Gordon, J. S. Binkley, J. A. Pople, W. J. Pietro and W. J. Hehre, Self-consistent molecular-orbital methods. 22. Small split-valence basis sets for second-row elements, J. Am. Chem. Soc., 1982, 104(10), 2797–2803, DOI:10.1021/ja00374a017.
- T. Clark, J. Chandrasekhar, G. W. Spitznagel and P. V. R. Schleyer, Efficient diffuse function-augmented basis sets for anion calculations. III. The 3-21+G basis set for first-row elements, Li–F, J. Comput. Chem., 1983, 4(3), 294–301, DOI:10.1002/jcc.540040303.
- G. W. Spitznagel, T. Clark, P. V. R. Schleyer and W. J. Hehre, An evaluation of the performance of diffuse function-augmented basis sets for second row elements, Na-Cl, J. Comput. Chem., 1987, 8(8), 1109–1116, DOI:10.1002/jcc.540080807.
- V. A. Rassolov, M. A. Ratner, J. A. Pople, P. C. Redfern and L. A. Curtiss, 6-31G* basis set for third-row atoms, J. Comput. Chem., 2001, 22(9), 976–984, DOI:10.1002/jcc.1058.
- G. Scalmani and M. J. Frisch, Continuous surface charge polarizable continuum models of solvation. I. General formalism, J. Chem. Phys., 2010, 132(11), 144110, DOI:10.1063/1.3359469.
- T. Saue, R. Bast, A. S. P. Gomes, H. J. A. Jensen, L. Visscher, I. A. Aucar, R. Di Remigio, K. G. Dyall, E. Eliav, E. Fasshauer, T. Fleig, L. Halbert, E. D. Hedegård, B. Helmich-Paris, M. Iliaš, C. R. Jacob, S. Knecht, J. K. Laerdahl, M. L. Vidal, M. K. Nayak, M. Olejniczak, J. M. H. Olsen, M. Pernpointner, B. Senjean, A. Shee, A. Sunaga and J. N. P. van Stralen, The DIRAC code for relativistic molecular calculations, J. Chem. Phys., 2020, 152(20), 204104, DOI:10.1063/5.0004844.
- H. J. A. Jensen, R. Bast, T. Saue, L. Visscher, V. Bakken, K. G. Dyall, S. Dubillard, U. Ekström, E. Eliav, T. Enevoldsen, E. Faßhauer, T. Fleig, O. Fossgaard, A. S. P. Gomes, T. Helgaker, J. Henriksson, M. Iliaš, C. R. Jacob, S. Knecht, S. Komorovský, O. Kullie, J. K. Lærdahl, C. V. Larsen, Y. S. Lee, H. S. Nataraj, M. K. Nayak, P. Norman, G. Olejniczak, J. Olsen, Y. C. Park, J. K. Pedersen, M. Pernpointner, R. D. Remigio, K. Ruud, P. Sałek, B. Schimmelpfennig, A. Shee, J. Sikkema, A. J. Thorvaldsen, J. Thyssen, J. van Stralen, S. Vil-laume, O. Visser, T. Winther and S. Yamamoto, Dirac, a relativistic ab initio electronic structure program, Release DIRAC16, 2016, Available from: https://dirac.chem.vu.nl (accessed July 2020).
- C. Adamo and V. Barone, Toward chemical accuracy in the computation of NMR shieldings: the PBE0 model, Chem. Phys. Lett., 1998, 298(1–3), 113–119, DOI:10.1016/S0009-2614(98)01201-9.
- T. Yanai, D. P. Tew and N. C. Handy, A new hybrid exchange–correlation functional using the Coulomb-attenuating method (CAM-B3LYP), Chem. Phys. Lett., 2004, 393(1–3), 51–57, DOI:10.1016/j.cplett.2004.06.011.
- J. Thyssen, Development and applications of methods for correlated relativistic calculations of molecular properties, PhD thesis, University of Southern Denmark, 2001.
- R. Bast, A. S. P. Gomes, T. Saue, L. Visscher, H. J. A. Jensen, I. A. Aucar, V. Bakken, K. G. Dyall, S. Dubillard, U. Ekström, E. Eliav, T. Enevoldsen, E. Faßhauer, T. Fleig, O. Fossgaard, L. Halbert, E. D. Hedegård, T. Helgaker, B. Helmich-Paris, J. Henriksson, M. Iliaš, C. R. Jacob, S. Knecht, S. Komorovský, O. Kullie, J. K. Lærdahl, C. V. Larsen, Y. S. Lee, N. H. List, H. S. Nataraj, M. K. Nayak, P. Norman, G. Olejniczak, J. Olsen, J. M. H. Olsen, A. Papadopoulos, Y. C. Park, J. K. Pedersen, M. Pernpointner, J. V. Pototschnig, R. Di Remigio, M. Repiský, K. Ruud, P. Sałek, B. Schimmelpfennig, B. Senjean, A. Shee, J. Sikkema, A. Sunaga, A. J. Thorvaldsen, J. Thyssen, J. van Stralen, M. L. Vidal, S. Villaume, O. Visser, T. Winther and S. Yamamoto, DIRAC21, Zenodo, 2021.
- S. Huzinaga and C. Arnau, Virtual orbitals in Hartree-Fock theory, Phys. Rev. A: At., Mol., Opt. Phys., 1970, 1(5), 1285–1288, DOI:10.1103/PhysRevA.1.1285.
- D. M. Potts, C. M. Taylor, R. K. Chaudhuri and K. F. Freed, The improved virtual orbital-complete active space configuration interaction method, a “packageable” efficient ab initio many-body method for describing electronically excited states, J. Chem. Phys., 2001, 114(6), 2592–2600, DOI:10.1063/1.1337053.
- K. G. Dyall, Relativistic double-zeta, triple-zeta, and quadruple-zeta basis sets for the actinides Ac–Lr, Theor. Chem. Acc., 2007, 117, 491–500, DOI:10.1007/s00214-006-0175-4.
- K. G. Dyall, Relativistic and nonrelativistic finite nucleus optimized double zeta basis sets for the 4p, 5p and 6p elements, Theor. Chem. Acc., 1998, 99, 366–371, DOI:10.1007/s002140050349.
- K. G. Dyall, Relativistic and nonrelativistic finite nucleus optimized double zeta basis sets for the 4p, 5p and 6p elements (Theor Chem Acc (1998) 99:366-371): addendum, Theor. Chem. Acc., 2002, 108, 365, DOI:10.1007/s00214-002-0396-0.
- K. G. Dyall, Relativistic quadruple-zeta and revised triple-zeta and double-zeta basis sets for the 4p, 5p, and 6p elements, Theor. Chem. Acc., 2006, 115, 441–447, DOI:10.1007/s00214-006-0126-0.
- L. Visscher and K. G. Dyall, Dirac-Fock atomic electronic structure calculations using different nuclear charge distributions, At. Data Nucl. Data Tables, 1997, 67(2), 207–224, DOI:10.1006/adnd.1997.0751.
- I. Angeli and K. P. Marinova, Table of experimental nuclear ground state charge radii: An update, At. Data Nucl. Data Tables, 2013, 99(1), 69–95, DOI:10.1016/j.adt.2011.12.006.
- B. Fricke and J. T. Waber, Calculation of isomer shift in Mössbauer spectroscopy, Phys. Rev. B: Solid State, 1972, 5(9), 3445–3449, DOI:10.1103/PhysRevB.5.3445.
- M. Filatov, On the calculation of Mössbauer isomer shift, J. Chem. Phys., 2007, 127(8), 084101, DOI:10.1063/1.2761879.
- S. Knecht, S. Fux, R. V. Meer, L. Visscher, M. Reiher and T. Saue, Mössbauer spectroscopy for heavy elements: a relativistic benchmark study of mercury, Theor. Chem. Acc., 2011, 129, 631–650, DOI:10.1007/s00214-011-0911-2.
- R. S. Mulliken, Electronic population analysis on LCAO–MO molecular wave functions. I, J. Chem. Phys., 1955, 23(10), 1833–1840, DOI:10.1063/1.1740588.
- J. P. Gustafsson, Visual MINTEQ ver. 3.1, 2014, Available from: https://vminteq.com (accessed May 2024).
Footnote |
| † Electronic supplementary information (ESI) available. See DOI: https://doi.org/10.1039/d4cp01149j |
| This journal is © the Owner Societies 2024 |