
 Open Access Article
 This Open Access Article is licensed under a Creative Commons Attribution-Non Commercial 3.0 Unported Licence
Low-energy electron distributions from the photoionization of liquid water: a sensitive test of electron mean free paths
Titouan
Gadeyne
 ab,
Pengju
Zhang
*a,
Axel
Schild
a and
Hans Jakob
Wörner
*a
ab,
Pengju
Zhang
*a,
Axel
Schild
a and
Hans Jakob
Wörner
*a
aLaboratory for Physical Chemistry, ETH Zürich, Vladimir-Prelog-Weg 2, 8093 Zürich, Switzerland. E-mail: pengju.zhang@phys.chem.ethz.ch; hwoerner@ethz.ch
bDépartement de Chimie, École Normale Supérieure, PSL University, 75005 Paris, France
First published on 6th January 2022
Abstract
The availability of accurate mean free paths for slow electrons (<50 eV) in water is central to the understanding of many electron-driven processes in aqueous solutions, but their determination poses major challenges to experiment and theory alike. Here, we describe a joint experimental and theoretical study demonstrating a novel approach for testing, and, in the future, refining such mean free paths. We report the development of Monte-Carlo electron-trajectory simulations including elastic and inelastic electron scattering, as well as energy loss and secondary-electron production to predict complete photoelectron spectra of liquid water. These simulations are compared to a new set of photoelectron spectra of a liquid-water microjet recorded over a broad range of photon energies in the extreme ultraviolet (20–57 eV). Several previously published sets of scattering parameters are investigated, providing direct and intuitive insights on how they influence the shape of the low-energy electron spectra. A pronounced sensitivity to the escape barrier is also demonstrated. These simulations considerably advance our understanding of the origin of the prominent low-energy electron distributions in photoelectron spectra of liquid water and clarify the influence of scattering parameters and the escape barrier on their shape. They moreover describe the reshaping and displacement of low-energy photoelectron bands caused by vibrationally inelastic scattering. Our work provides a quantitative basis for the interpretation of the complete photoelectron spectra of liquids and opens the path to fully predictive simulations of low-energy scattering in liquid water.
Introduction
Understanding low-energy electron production and transport in liquid water is a significant goal for several areas of research.1,2 A free electron travelling through the liquid is likely to scatter with water molecules, and such collisions can involve loss of kinetic energy for the electron, as well as generation of secondary electrons by impact ionization of the molecules. These processes rapidly result in a population of low-energy electrons in the liquid following its ionization. This situation is of importance for radiation therapy, as radiation damage to biomolecules is largely attributed to slow electrons resulting from such ionization cascades.3,4 Achieving predictive simulations of low-energy electron scattering in liquids could also prove useful in the photoelectron spectroscopy of liquids and solutes, as electrons emitted from a condensed phase are likely to have experienced scattering events before being detected, potentially shifting peak positions from their actual values, distorting peak shapes, and generating a strong background of scattered electrons at low energies resulting from the aforementioned mechanisms.5–7As of yet, no consensus exists on scattering cross sections and mean free paths for electrons travelling through liquid water, particularly in the low kinetic energy range where both theory and experiment become less reliable. Although diverse approaches have been developed to estimate these parameters, the lack of direct experimental data for the liquid phase impedes the assessment of the reliability of such estimates. Evaluating the quality of these cross sections is particularly important for any study aiming to fit scattering simulations to experimental data to retrieve information about e.g. the initial kinetic energy distribution of emitted electrons in water. This was done in the past for the distribution of solvated-electron binding energies,8 and the obtained distribution was different than the Gaussian observed in spectra taken with higher photon energies6 and data recorded with water clusters,9 suggesting that the simulation procedure was not apt to produce accurate results.
We therefore argue that comparison of simulations to more experimental input is paramount to assess whether or not a given scattering model is able to yield reliable predictions.
In this work, we develop a Monte-Carlo trajectory simulation of low-energy electron (<50 eV) transport and production, and use it to make the first predictions of full photoelectron spectra of liquid water including the low-energy electron background. The results are compared to experimental spectra obtained using a state-of-the-art apparatus, combining a table-top monochromatized source of high-harmonic radiation,10 a liquid microjet, and a magnetic photoelectron spectrometer.11 We herein compare simulated spectra to experiment, and explore the performance of several choices of scattering parameters.
Direct experimental measurements of electron mean free paths and differential scattering cross sections are not yet feasible for liquid water, which motivates the search for alternative ways to estimate these quantities. Ab initio calculations are not tractable for the liquid phase, and the usual methodology for estimating these parameters theoretically is to use a dielectric model of water, although another method based on the spherical complex optical potential (SCOP) was recently used and yielded similar results.12 Many studies have reported values for electron inelastic mean free paths (IMFP) and cross sections for liquid water within the dielectric formalism using different algorithms.13–19 They agree well with each other for fast electrons, but not in the low-energy range we are interested in. These estimations are known to be very approximate for low kinetic energies due to the numerous assumptions involved in the calculations, and often capture only electronic energy loss channels, while vibrational or phonon excitations are expected to be of importance for low-energy electrons. Several attempts have been made at simulating electron transport in water using such parameters,14,17 but the comparison of the results to experimental data has so far remained scarce, if present at all.
Scattering parameters for liquid water have also been estimated by scaling gas-phase cross sections with the density of liquid water. This is expected to be a crude model, as intermolecular interactions are not captured. A perhaps more interesting source of data are the experimental measurements for amorphous ice.20 It was recently argued that, within experimental error, there should be no noticeable difference between these values and those for the liquid phase.21 Again, comparison to more experimental input is required to see whether these values really are able to yield accurate simulations. Our present results suggest that this is not the case.
Finally, scattering parameters have been inferred by combining ab initio calculations of electron scattering with water clusters and Monte-Carlo simulations to reproduce experimental observables. In a previous work,22 we determined the elastic angular differential cross section (ADCS) through quantum-scattering calculations, which allowed us to retrieve the physical (event-by-event) EMFP and the IMFP through a non-linear fit of measured effective attenuation lengths (EAL) and photoemission angular distributions (PAD) reported in the literature.23,24 This set of EMFP and IMFP parameters was successfully used in modelling the first attosecond time-resolved experiments in the liquid phase.25,26
We herein propose a new approach to testing reported scattering parameters, by using them to simulate the complete photoelectron spectra of liquid water, including, for the first time, the low-energy electron background. This electron background is mostly composed of primary photoelectrons that lost energy during inelastic collisions with water molecules, and of secondary electrons emitted by impact ionization of water molecules by primary electrons.27 Therefore, it inherently contains information on electron energy loss and secondary electron production. Our high-harmonic setup enables us to use several ionizing photon energies, thereby probing scattering mechanisms over a wide range of electron kinetic energies. An accurate simulation of low-energy electron transport in water should be able to reproduce such data, and, therefore, the comparison can be used as a benchmarking tool to assess the validity of the scattering parameters used as input. This is a necessary step to be taken before using Monte-Carlo simulations to analyze experimental results. Most importantly, the simulation can give direct insight on how the shape of the electron distribution will respond to a change in the scattering model, allowing for a better, more direct and intuitive understanding of electron scattering in the liquid phase.
Experiment
Photoelectron spectra of liquid water were recorded with a time-of-flight electron spectrometer.11 A scheme of the experimental setup is presented in Fig. 1a. Liquid water was introduced in a high-vacuum chamber through a 25 μm diameter microjet, where it was irradiated with extreme-ultraviolet (XUV) pulses originating from high-harmonic generation (HHG) of laser light. HHG was driven in neon (32 mbar) by a near-infrared laser pulse of ≈1.5 mJ and ≈30 fs duration centered at 800 nm with a repetition rate of 1 kHz. The XUV pulses were provided by a time-preserving monochromator,10 which allowed for the selection of a single harmonic order.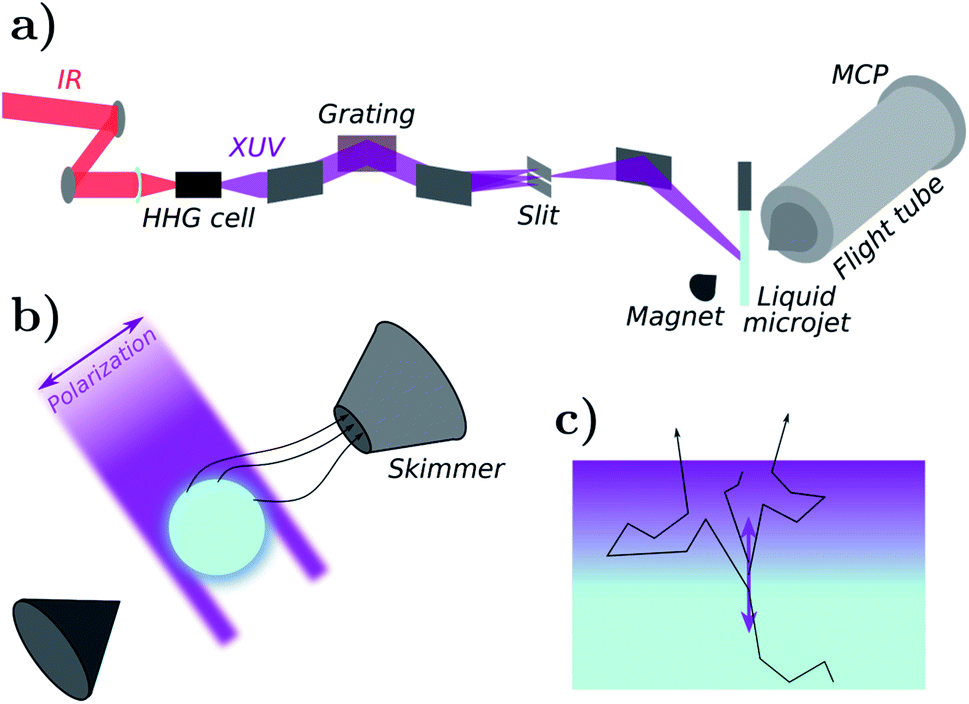 | ||
| Fig. 1 Photoelectron spectroscopy experiment. (a) Scheme of the experimental setup. (b) Experimental microjet geometry. (c) Semi-infinite flat-surface geometry used in simulations. | ||
Electrons emitted from the liquid jet were recorded by a magnetic-bottle photoelectron spectrometer, consisting of a permanent magnet (1 T) holding a conical iron tip, a 910 mm-long flight tube equipped with a solenoid that generates a homogeneous magnetic field of 1 mT along the flight tube. The permanent magnetic field near the liquid microjet allows to guide the emitted electrons towards the skimmer of the flight tube. A fast response (≈150 ps) photoelectron detector consisting of a pair of microchannel plates (MCP) in Chevron configuration and a metallic anode is installed at the end of the flight tube. The raw MCP signals are recorded via an amplitude-to-digital (ADC) converter after ≈10 times amplification through a home-built fast pre-amplifier.
Without applying any bias potential on the skimmer and the flight tube, the spectrometer was first calibrated by photoionization of argon with various harmonics (H11 to H45), which led to a determination of the XUV energy to within ±0.06 eV. NaCl was added to the water at a concentration of 50 mmol L−1 to reduce the electrokinetic charging effect of the jet. A bias potential of +0.50 V was applied to the liquid jet to simultaneously compensate the effects of the residual streaming potential and that of the vacuum-level offset between the jet and the spectrometer.28 As a result, the measured kinetic energies appear as counted from the vacuum level of the liquid.
In order to reliably compare simulated spectra to experimental measurements, it is necessary to evaluate the detection efficiency of our experimental apparatus as a function of the kinetic energy of the electron. It is well-known that the detection efficiency of a magnetic bottle spectrometer is relatively constant for photoelectron kinetic energies between 5 and 100 eV.29 In order to avoid possible errors coming from the unknown detection efficiency of the slower electrons (<1 eV), as well as to separate the liquid- and gas-phase contributions in the spectrum, a bias potential of −15 V was applied to the liquid jet. The measured spectra were corrected for the applied potential.
In general, a large number of photoelectrons are easily created via ionization of a liquid sample. The Coulomb repulsion between photoelectrons can cause so-called space-charge effects, which can severely affect the determination of the ionization potentials of liquid samples and the spectral profiles. To quantitatively assess the influence of this effect, the electron count rate was estimated via setting a constant threshold in our home-made data acquisition software during the measurement. The count rate below which space-charge effects can be safely neglected for the present measurements was estimated as 20 counts/shot.
Theory and simulation
Monte-Carlo propagation procedure
We used classical-trajectory Monte-Carlo simulations to describe electron transport. Such calculations are expected to be quantitatively accurate for kinetic energies above ≈10 eV, where quantum-interference effects have been shown to become negligible.30 In this approximation, electrons travel in straight lines through a homogeneous medium in between scattering events. We developed the simulation by expanding on our previous code, CLstunfti, which included elastic scattering only.22,31Elastic collisions were associated with an elastic mean free path (EMFP) λE and inelastic ones with an inelastic mean free path (IMFP) λI. The propagation length r between two successive events for an electron with kinetic energy E is sampled from an exponential distribution
 | (1) |
 | (2) |
At each step, the probability of the scattering event being inelastic is given by λE(E)/(λE(E) + λI(E)). Once the type of scattering event is determined, the necessary parameters (deflection angle, energy transfer, etc.) are sampled as will be discussed in the next sections. In the case of an electron-impact ionization event, in which a water molecule is ionized, a new trajectory is created corresponding to the emitted secondary electron.
The simulation uses a simple semi-infinite flat-surface geometry (see Fig. 1c). Although our experimental geometry is that of a cylindrical microjet (see Fig. 1b), we do not expect this difference to significantly affect the simulated spectra, at least with respect to the amplitude of the effects we wish to discuss in this work. This is further supported by calculations shown in Appendix C.
Trajectories are started in the liquid (z < 0), and those escaping the surface (z = 0) are stopped and counted as part of the simulated photoelectron spectrum. Since our experimental setup features a magnetic field to guide emitted electrons towards the entrance of the flight tube, we assumed that all escaped electrons were detected, regardless of their emission angle relative to the surface.
Finally, we assumed that electrons having escaped the liquid do not suffer additional collisions with molecules from the gas-phase surrounding the liquid jet. Since the density of scatterers is much lower in the vapour than in the liquid, most of the observed scattering effects should be captured by our simulations. When measuring photoelectron spectra of the gas phase with our setup, the secondary electron background is almost nonexistent,5 confirming the small amount of inelastic collisions taking place in the vapour.
Physical model
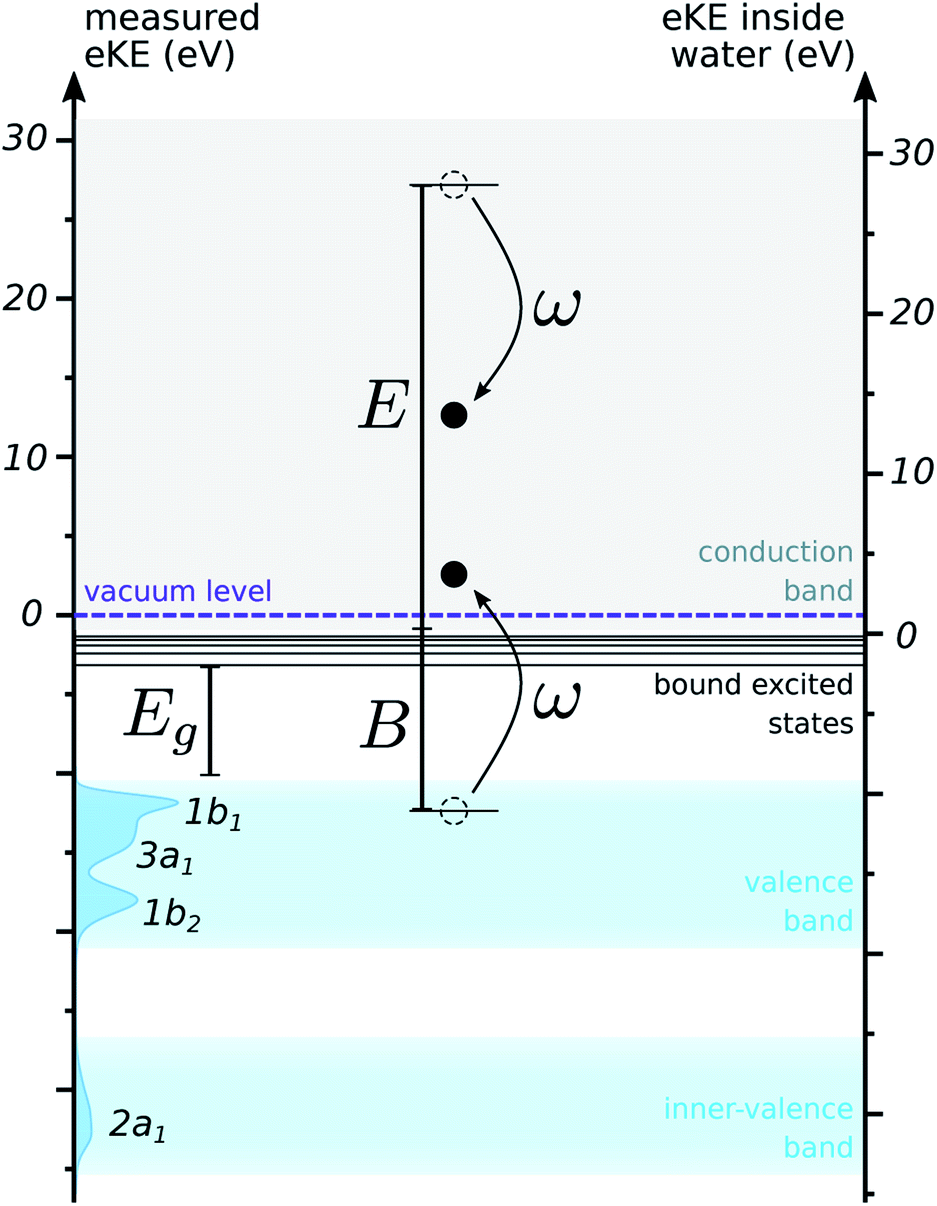 | ||
| Fig. 2 Band diagram for liquid water. The left axis shows the eKE as measured in experiment, and features the DOS used for the simulations. Peaks in the DOS are labelled with the corresponding orbitals of the water molecule. The right axis shows the eKE inside water, differing from the previous one by the electron affinity (slightly exaggerated here for illustrative purposes). An electron impact ionization event with energy transfer ω is depicted. | ||
In order to compare the two ways of counting energies, we need to know the depth of the conduction band with respect to the vacuum level, which is also known as the electron affinity. No consensus exists on this value, but studies indicate a value below 1 eV.32–34 We used an estimate of 0.2 eV for this quantity, corresponding to a recent theoretical value for bulk liquid water.32 Electrons below this energy are trapped in the conduction band below the vacuum level. Such trajectories cannot escape the liquid and therefore will not contribute to the detected spectrum: in the simulation, they can be terminated.
The attenuation of XUV light of photon energy Ep in water is well described by an exponential decay with a characteristic length L given by the complex refractive index n + iκ of the medium as
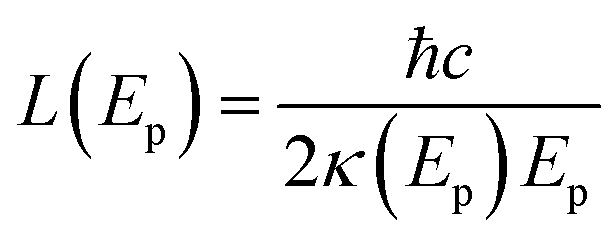 | (3) |
Initial angles were sampled based on an extrapolation of PAD measurements on small water clusters, which we expect to reproduce the emission distribution in a local liquid water environment. The procedure used is detailed in Appendix B. These angles are defined with respect to the polarization direction of the XUV light.
Initial kinetic energies were sampled according to the density of states (DOS) for the outer- and inner-valence bands of liquid water. This DOS was approximated by a background-subtracted photoelectron spectrum of liquid water recorded with a high photon energy (harmonic 31 of 800 nm, 48 eV). As will be discussed in more detail below, the effect of scattering on the shape of the distribution of kinetic energies is expected to be small for fast electrons. This is confirmed by recent spectra, in which the shape and binding energies of the photoelectron peaks is not significantly changed for photon energies larger than ≈20 eV.5,7 Therefore, we expect the energy distribution of such spectra to decently reflect the initial distribution of kinetic energies, and to be a good estimate for the DOS of the medium. This distribution is pictured along the left axis in Fig. 2.
The EMFP is related to the momentum-transfer (also known as transport) mean free path (MTMFP). The EMFP is suited for a physical, event-by-event description of the scattering mechanism, in which angular deflections are sampled according to a specific angular differential cross section. The MTMFP corresponds to a simplified scattering model, in which angular deflections are assumed to be isotropic.
Here, as in our previous work,22 we sampled elastic scattering angles from angular differential cross sections (ADCS) obtained from quantum calculations on water heptamers. They are described in Appendix D. This framework allows to account for quantum effects in elastic collisions, by using the ADCS for scattering by a cluster of several molecules. Such effects are expected to become particularly important for slow electrons, with a de Broglie wavelength spanning over several water molecules. Additionally, the integral of the computed ADCS can be used to determine an ab initio prediction of the EMFP and MTMFP (see ESI of ref. 22).
In Fig. 3a, we show several proposed values for the EMFP (in blue) and the MTMFP (in green). The EMFPs based on recommended data for water vapour,36 theoretical results for liquid water,12 results from our fitting of experimental PAD and EAL,22 and the values derived from the present ADCS all exhibit the same linear behaviour, though they do not agree quantitatively. We expect these estimates to reflect the purely elastic EMFP, which is the quantity we aim to input in our simulation.
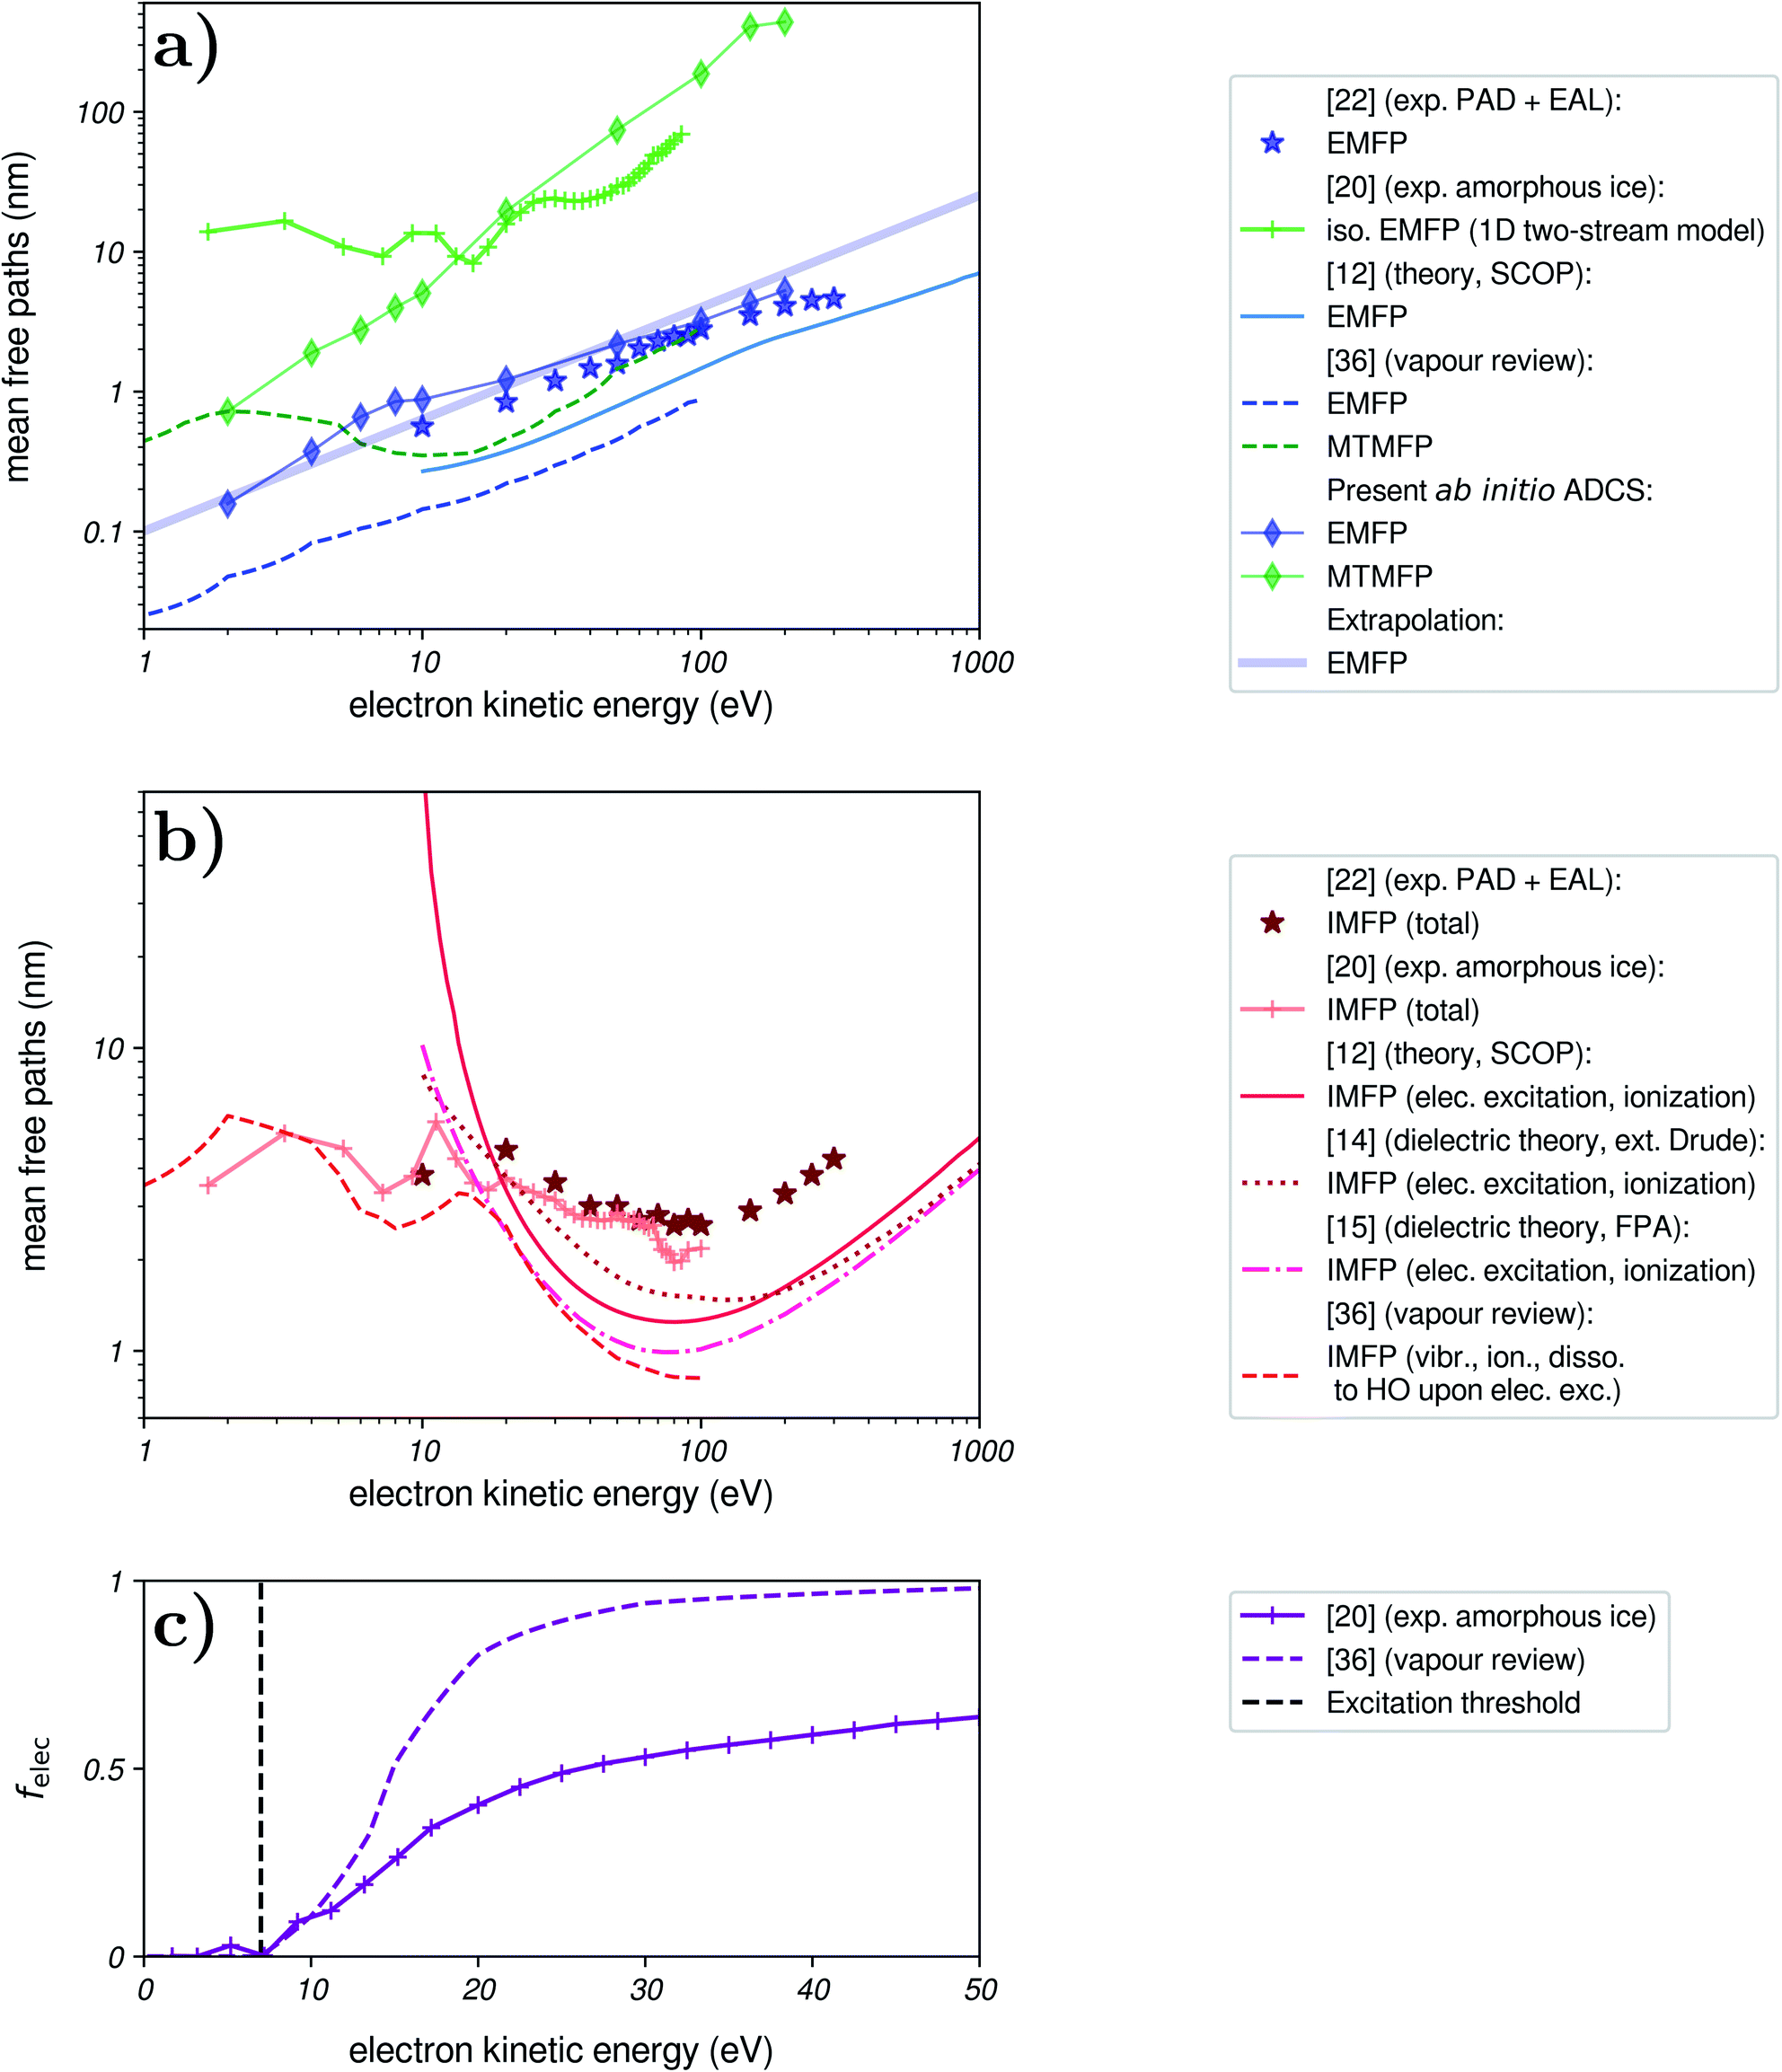 | ||
| Fig. 3 Scattering parameters for an electron travelling through liquid water. (a) Proposed EMFP and MTMFP. (b) Proposed IMFP. (c) Fraction of electronically inelastic scattering events, as opposed to vibrationally inelastic ones. | ||
The reported cross sections measured in amorphous ice20 are harder to interpret. Indeed, the authors made use of a one-dimensional two-stream approximation, in which the only angle-dependent information is given by a single (forward–backward) anisotropy factor. Extending this model to a three-dimensional picture is not straightforward, and most importantly elastic cross sections are reported with a zero anisotropy factor. Hence, this data is related to the isotropic component of elastic scattering. It has been interpreted as a MTMFP in the past,21 but this interpretation has, to our knowledge, no rigorous basis. The associated EMFP can then be expected to be smaller than the reported MTMFP judging by the EMFP/MTMFP ratio from our ADCS, but definitely exhibits a different behaviour than other estimates below ≈20 eV.
Based on the close agreement between the EMFP from our present ab initio ADCS and the EMFP from our previous fitting of experimental PAD and EAL (diamonds and stars in Fig. 3a, respectively), we use the analytical extrapolation shown as a thick blue line for the EMFP in this work. This EMFP also captures the general trend of the reported datasets.
We implemented inelastic scattering with a single IMFP λI(E), coupled with a branching factor felec(E) giving the probability of the scattering event being associated with an electronic channel (as opposed to a vibrational one). In principle, the IMFP to use in a simulation depends on the ADCS for inelastic events, as explained in the elastic case. Here however, quantum calculations of ADCS are impeded by the large number of possible inelastic channels, and we had to resort to using a simplified model for implementing angular deflections in inelastic events, following previous Monte-Carlo simulations of electron transport,14,37 based on experimental observations in the gas phase. For vibrational and electronic excitations, the primary electron is assumed not to be deflected, owing to the small momentum transfers associated with such events, and to the lack of experimental ADCS data. For impact ionizations, slow primary electrons (<50 eV) are experimentally found to be scattered mostly forward, thus their polar deflection angle was sampled uniformly between 0 and π/4. Secondary electrons are emitted isotropically in this regime. IMFP were used assuming that this treatment of angular deflections was reasonable.
In Fig. 3b, we show several reported IMFP. For use in our simulation, we wish to include a total IMFP that includes most inelastic channels. Theoretical IMFP are generally limited to electronic channels, and therefore exhibit a sharp rise when approaching the excitation threshold of water (7 eV). Dielectric models agree with each other at high kinetic energies,15 but below ≈102 eV the reported values differ, depending on the algorithms and approximations used. The IMFP for amorphous ice agrees reasonably well with our fitting of experimental EAL and PAD, and with the vapour data below 10 eV. Here, the IMFP for water vapour was built from the recommended cross sections for vibrational excitation, impact ionization, and dissociation to OH, which is expected to mostly follow impact excitation.36 Surprisingly, our fitting of experimental EAL does not agree with theoretical results at high energies, where they are expected to become reliable. As discussed in ref. 22, this might be due to an underestimation of the EAL in ref. 23. Notably, the IMFP of amorphous ice20 does also not merge with the theoretical predictions at high energies, a discrepancy that appears to be unresolved so far.
In addition to the IMFP, we input the fraction of electronically inelastic events felec(E). It is given by
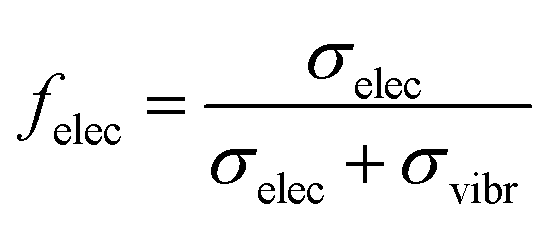 | (4) |
In Fig. 3c, we present this fraction, as obtained from vapour and amorphous-ice cross sections. These two sources give notably different results, with a rapid closing of vibrational channels between ≈10–20 eV for vapour, while they remain important in ice up to high kinetic energies. The origin of this discrepancy remains unclear, but it should be noted that energy losses above ≈1 eV were not directly detected in the ice measurements20 and hence cumulatively described by a single cross section.
The ice dataset features electronic channels even below the excitation threshold: they are negligible with respect to vibrational ones, and likely correspond to dissociative electron attachment (DEA) based on the comparison to gas-phase data. In our simulations, this channel is not included, as we derived differential cross sections from a dielectric model based on optical data: this channel is not optically observable, as it inherently requires an electron impact to occur, and therefore our cross sections do not include it. However, given the low amplitude of the associated cross section, it can be neglected in good approximation.
For both vibrational and electronic channels, we derived a singly-differential cross section (SDCS) to sample the amount of energy ω lost by the primary electron. In order to obtain these SDCS, we used a dielectric model of liquid water. This theory is known to be a relatively coarse approximation at low kinetic energies, but we expect that the relative intensities in the SDCS can be used as a reasonable guess for modelling energy loss in the absence of precise experimental data.
The dielectric approach is built around the energy-loss function (ELF) 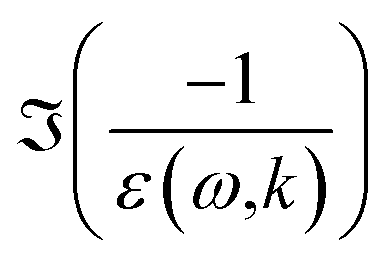 , which represents the probability that an electron transfers energy ω and momentum k. In this expression, ε(ω,k) = ε1(ω,k) + iε2(ω,k) is the dielectric function of liquid water. Experimental measurements of the full ELF are very scarce, but its value in the optical limit (no momentum transfer, k = 0) has already been measured by several methods. The general workflow is then to extend this optical ELF to non-zero k.
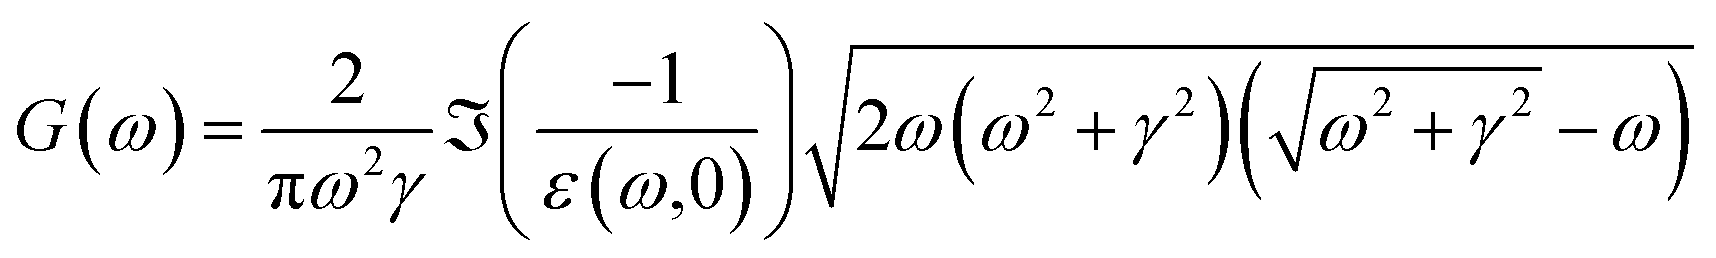
For this purpose, several algorithms exist. We chose to use the Mermin–Penn algorithm, as described by Nguyen-Truong.13,38 This extension procedure is based on the Lindhard dielectric function for a free electron gas, with damping included through the Mermin modification of this function. This applies successfully to free-electron-like materials, but should be regarded as an approximation for liquid water. Attractive features of this algorithm are the built-in ω − k relation based on a physical model, and the fact that it was recently modified to include the presence of an energy gap in the extension procedure, for application to liquid water.13
A detailed description of the process used and of the obtained ELF is given in Appendix A. Importantly, regions of the ELF associated with electronic and vibrational energy loss are well separated.
From the ELF, differential scattering cross sections (or inverse mean free paths, since the density of the medium is accounted for in this approach) for an electron travelling with kinetic energy E can be obtained using the formula (given in atomic units, ℏ = me = e2/4πε0 = 1)
 | (5) |
This expression is equivalent to using the first Born approximation. This applies well at high kinetic energies, but is not expected to be very accurate in the low-energy region. One of the reasons is the increasing importance of exchange and correlation effects at these velocities. The Ochkur correction for electron exchange can be introduced in the previous expression by multiplying with (1 − k2/E + k4/E2),13 and was used for computing the electronic cross sections. Formulae for the second-order Born approximation are not available within this formalism for low kinetic energies, and most of the other corrections used in the literature are very heuristic, though contributions have been made towards the inclusion of more accurate exchange–correlation effects for scattering in the condensed phase.39,40 Therefore, we kept this level of approximation.
In practice, sampling both the energy and momentum transfers from a three-dimensional differential cross section is impractical. Therefore, as done in other simulation codes, scattering angles were sampled separately, and we actually sampled energy transfers from the SDCS
 | (6) |
 are obtained from the kinetic energy-momentum relation E = K2/2 where K is the momentum of the free electron.
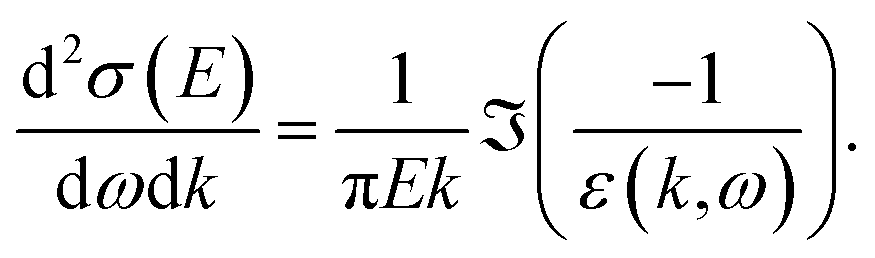
These SDCS are shown in Fig. 4 for several electron kinetic energies. They are expected to account for all optically accessible energy-loss channels. In particular, peaks corresponding to bending and stretching modes of water can be observed in the vibrational SDCS, as well as peaks due to phonons associated with very small transfers (ω < 0.1 eV). It should be noted that we only aim to use the relative intensities in the SDCS for sampling energy transfers. Their overall amplitude is not used, as it is captured by the IMFP.
 | ||
| Fig. 4 Singly-differential cross sections for inelastic scattering. Top: SDCS for electronically inelastic events, for incident kinetic energies E = 10, 20, 30, 50 and 100 eV. The black vertical line marks the excitation threshold for liquid water. Bottom: SDCS for vibrationally inelastic events, for E = 1, 2 and 5 eV. | ||
An important point to address is the domain of energy transfers [ω−, ω+] allowed for an electron travelling inside water with kinetic energy E. In vibrational scattering, the electron can a priori lose all of its energy. Thus, [ω−, ω+] = [0, E], and ω is sampled with the relative amplitudes given by the DCS within this interval. In practice, an upper boundary of 2 eV was used for vibrational scattering, in order to select only the corresponding portion of the ELF. The vibrational SDCS have negligible amplitude beyond ≈1 eV.
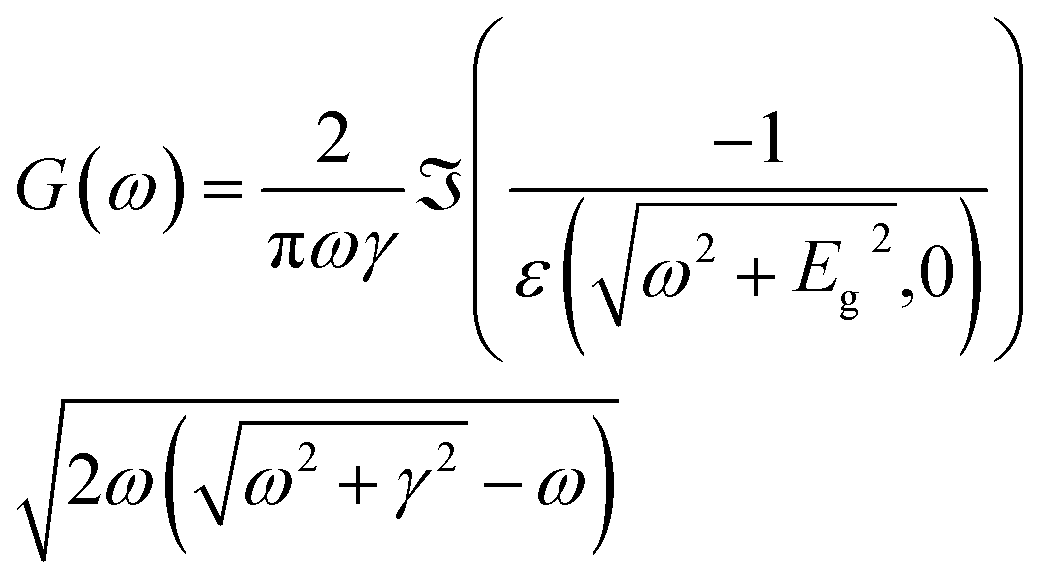
For electronically inelastic scattering, the situation is much less straightforward, and no strong consensus exists in the community. First, the minimum energy transfer has to be set to the value of the excitation gap in the ELF, ω− = Eg = 7 eV. For estimating the maximum transfer, it has been suggested that when most of the energy loss can be attributed to single-electron ionizations, indistinguishability of the two resulting electrons should be considered. This seems reasonable for liquid water, as calculations of cross sections show that most of the inelastic events correspond to impact ionizations.12,19 Assuming that the bound electron starts at rest and has binding energy B from the bottom of the conduction band, the maximum energy loss should be ω+ = (E + B)/2, to ensure that the first electron remains the fastest one. However, our model does not partition the ELF into different channels that could be associated with different binding energies, and using a single binding energy for all transfers is not physically correct for a liquid with a band-like DOS. Studies have suggested to use a mean binding energy:19 this is a convenient choice for integrating the cross sections and calculating e.g. the IMFP, as it allows to keep a reasonable integration range. However, this does not provide a good physical picture for the simulation, as it neglects some transfers that should be allowed by exciting electrons with higher binding energies. Overall, reconciling the total ELF picture with a microscopic interpretation in terms of ionization events from a structured DOS is a difficult task.
Therefore, we tried to account for every possible transfer, by using ω+ = E (for E > Eg). With this choice, we overestimate the total electronic energy loss, since for some cases there will be no bound electrons in the DOS that can satisfy the indistinguishability condition, but we also ensure that we do not miss any possible energy transfer.
The initial binding energy for the secondary electron was sampled according to the DOS of water, within the interval [B−, B+]. B+ was set to ω, to ensure that the secondary electron is indeed promoted above the bottom of the conduction band. B− was set to 2ω − E, to ensure that the first electron remains the fastest one for indistinguishability. This is a crude model, but it allows to sample binding energies continuously, and takes into account the density of states of the medium.
Secondary electrons are not only produced by impact ionization. Recently, intermolecular coulombic decay (ICD) has been identified in liquid water.42 This relaxation channel occurs upon photoionization of the inner valence band of water, and produces slow secondary electrons, that contribute to our experimental spectra. However, including such a channel is difficult for two reasons. First, one needs to know the ICD efficiency, i.e. the fraction of 2a1-ionized molecules that will relax via ICD, to know how many electrons are generated by this process. This is the subject of ongoing research in our group. Second, one needs to know the initial kinetic-energy distribution of ICD electrons. As will be demonstrated by our simulations, significant reshaping of the electron distribution occurs in the low-energy region of the spectrum, therefore one cannot reliably use the detected ICD spectrum as the input distribution. Obtaining this distribution is actually one of the many applications that an accurate electron scattering simulation procedure could have. Future efforts could model such channels to further disentangle the total distribution of electrons.
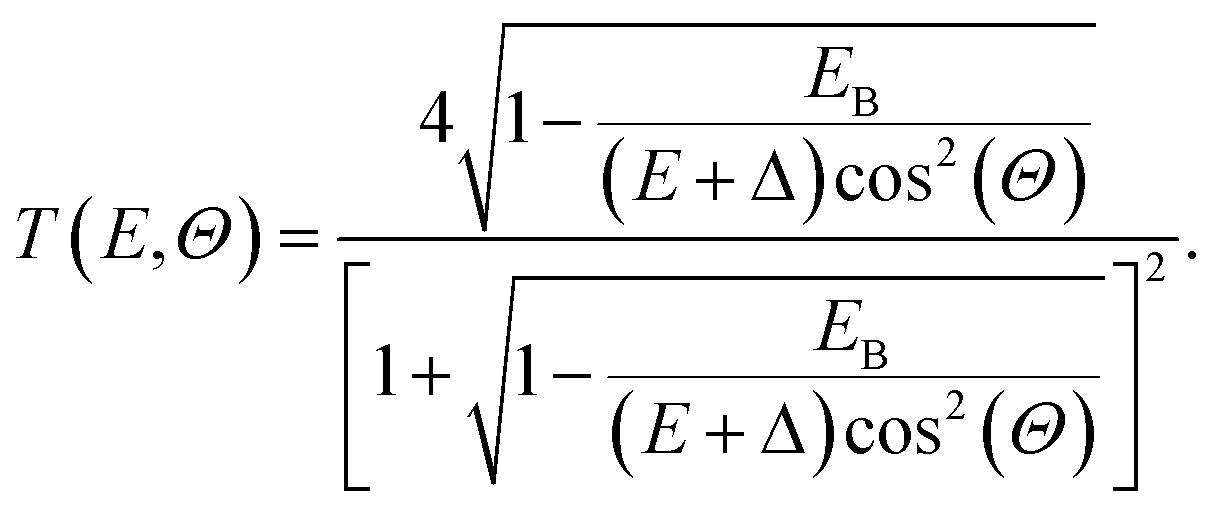 | (7) |
In practice, all escaping trajectories were detected, and then weighted by T(E,Θ) to account for this transmission probability. This probability is responsible for a rapid decrease of the detected electrons near 0 eV: indeed, electrons whose kinetic energies are only slightly above the vacuum level can only escape in a restricted angle domain, and are therefore less likely to contribute to the detected spectrum.
Results and discussion
In the following figures, we compare experimental photoelectron spectra to the results of the simulation for N = 106 primary trajectories. The simulated spectra are shown as stacked histograms. The total amplitude of the histograms can thus directly be compared with the experimental spectra, whereas the area shown in a given color represents the relative contributions of electrons generated by different processes. The green part represents primary electrons that escaped the liquid without experiencing inelastic scattering. These are therefore located at their original position on the energy axis, and reflect the initial distribution of kinetic energies. The blue part contains primary electrons that escaped after losing some energy in inelastic collisions. Finally, the red part contains secondary electrons, that were emitted by impact ionization of water molecules through primary electrons. Third-generation electrons are also included, but were found to come in negligible amounts for this range of kinetic energies. Experimental spectra are shown as black lines. Both simulated and experimental distributions are normalized to an integral of 1 for comparison.Influence of the EMFP
We start by investigating the influence of the EMFP on our simulated electron distributions. As elastic processes are not involved in energy loss, it might not be obvious that the EMFP can play a role in determining the shape of the low-energy spectra. Nevertheless, the EMFP influences the path length and trajectory structure of electrons in water, which can play on (i) the probability of escaping the liquid, as well as on (ii) the probability to lose energy, since a longer path length also equals to more inelastic scattering events. In the leftmost panel of Fig. 5, we report a simulation using the EMFP extrapolated from reported data (see Fig. 3). In this figure, felec was taken from water vapour and the IMFP is set constant at 3 nm (see later sections).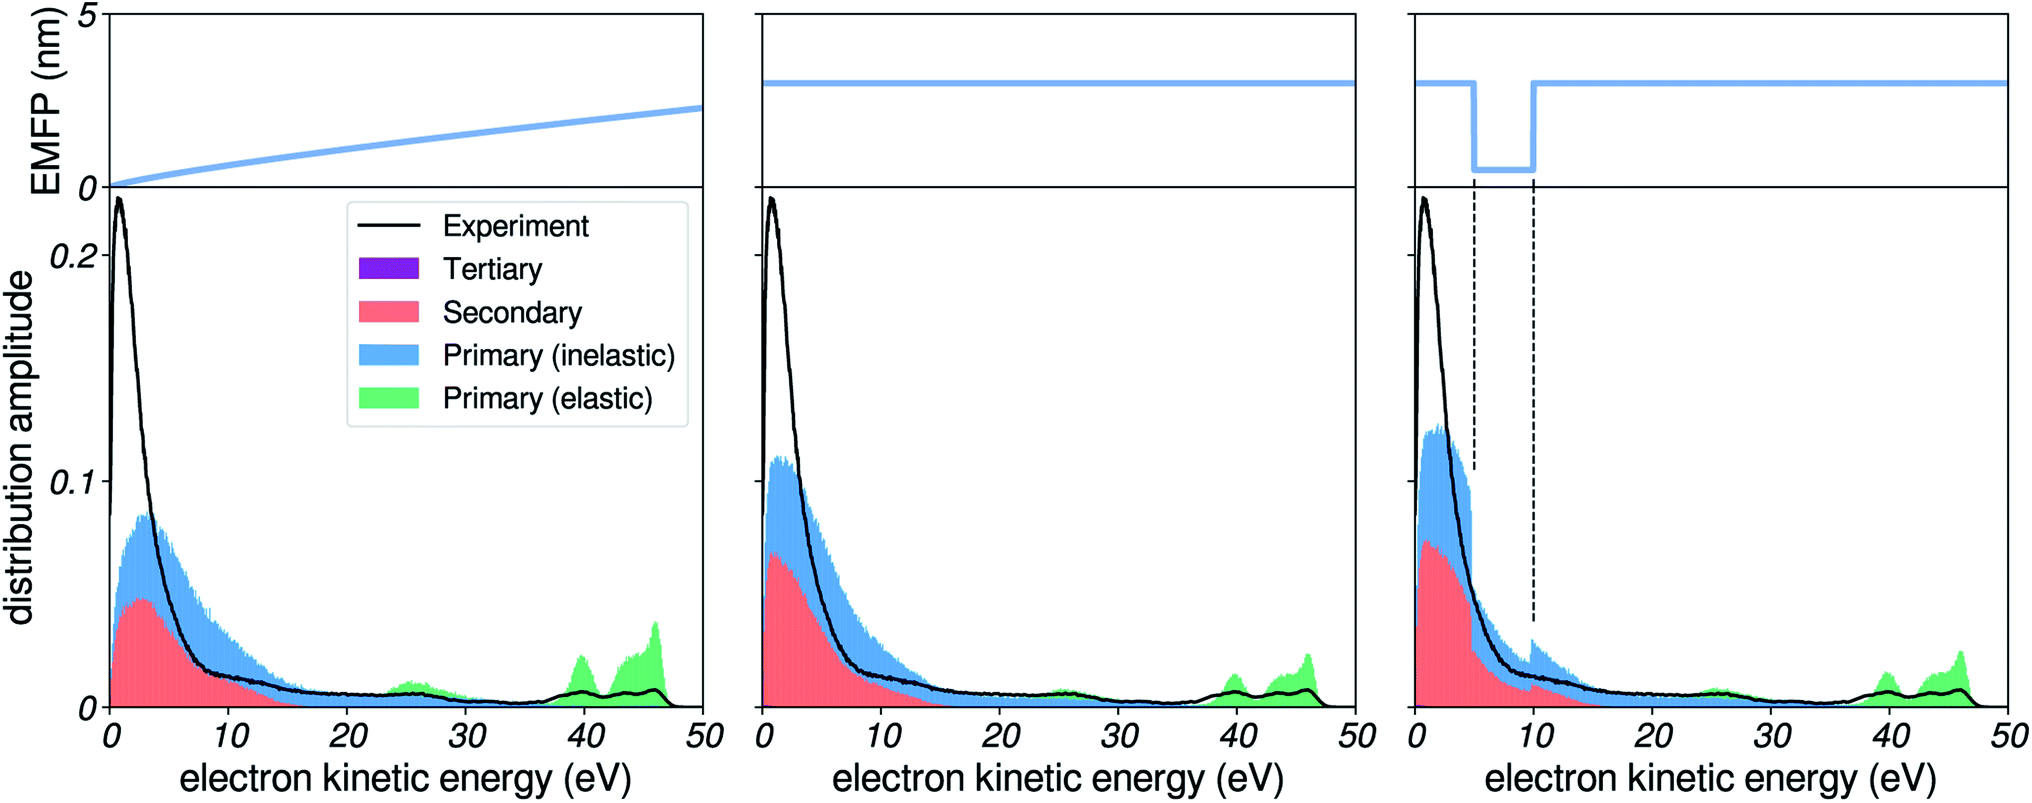 | ||
| Fig. 5 Influence of the EMFP. Comparison of simulated spectra to experimental results, for a photon energy corresponding to harmonic 37 of ≈800 nm (≈57.6 eV), for several choices of EMFP. Left: EMFP extrapolated from reported results (Fig. 3a). Middle: constant 3 nm EMFP. Right: constant EMFP with a local square-shaped minimum. | ||
We notice that the very-low-energy portion of the spectrum is depleted, when compared to the case of a constant EMFP (middle panel): the amplitude of the background with respect to the photoelectron peaks is reduced, and the maximum of the low-energy distribution is shifted. This effect can be interpreted in the following way: when electrons have a very low EMFP (i.e. very slow electrons in the left panel), they move by extremely small steps in the liquid, and their direction of propagation is constantly changed. Therefore, it is more difficult for such electrons to cover large distances through the liquid, and as a consequence they have less chance to escape the surface and be detected. Rather, they will end up experiencing many inelastic collisions and losing all of their energy, eventually falling below the escape barrier of water: as a result the very low-energy region is depleted. In an effort to further illustrate this effect, we show in the rightmost panel the case of a constant EMFP with a local square-shaped minimum. When electrons are in the corresponding energy range, they escape the liquid less efficiently, and as a result the hole is clearly mapped onto the electron distribution, as less electrons are detected there.
In all of the following simulations, we used the extrapolated EMFP shown in Fig. 3, which appears to be a decent guess given the scarcity of estimates for the pure EMFP. It should be noted that for angle-resolved data (e.g. PAD, etc.), the influence of elastic events is of higher importance, since they efficiently broaden the angular distribution of electron trajectories.22
Influence of the IMFP
We herein investigate the sensitivity of the photoelectron spectrum to a change in the shape of the IMFP. Here, felec was taken from water vapour.The present simulation is able to generate an accumulation of low-energy electrons, similar to what is observed in the experimental spectra. In the leftmost panel of Fig. 6, we report results obtained using the extended amorphous ice IMFP.20,21 The shape of this distribution is influenced by the oscillatory behaviour of the amorphous ice IMFP at low energies. This is best evidenced by the comparison to the case of a constant IMFP without any oscillatory structure (middle panel), which produces a rather smooth distribution, cut off at low energies due to the low escape probability of slow electrons. With the amorphous ice IMFP, this distribution is modulated by the oscillations: an excess of electrons is detected when the IMFP has a local maximum, resulting in a shoulder in the distribution and a sharper peak. This behaviour is easily explained: electrons with a higher IMFP lose energy less frequently than others, and as a result there is an enhanced probability of detecting electrons in the corresponding energy range.
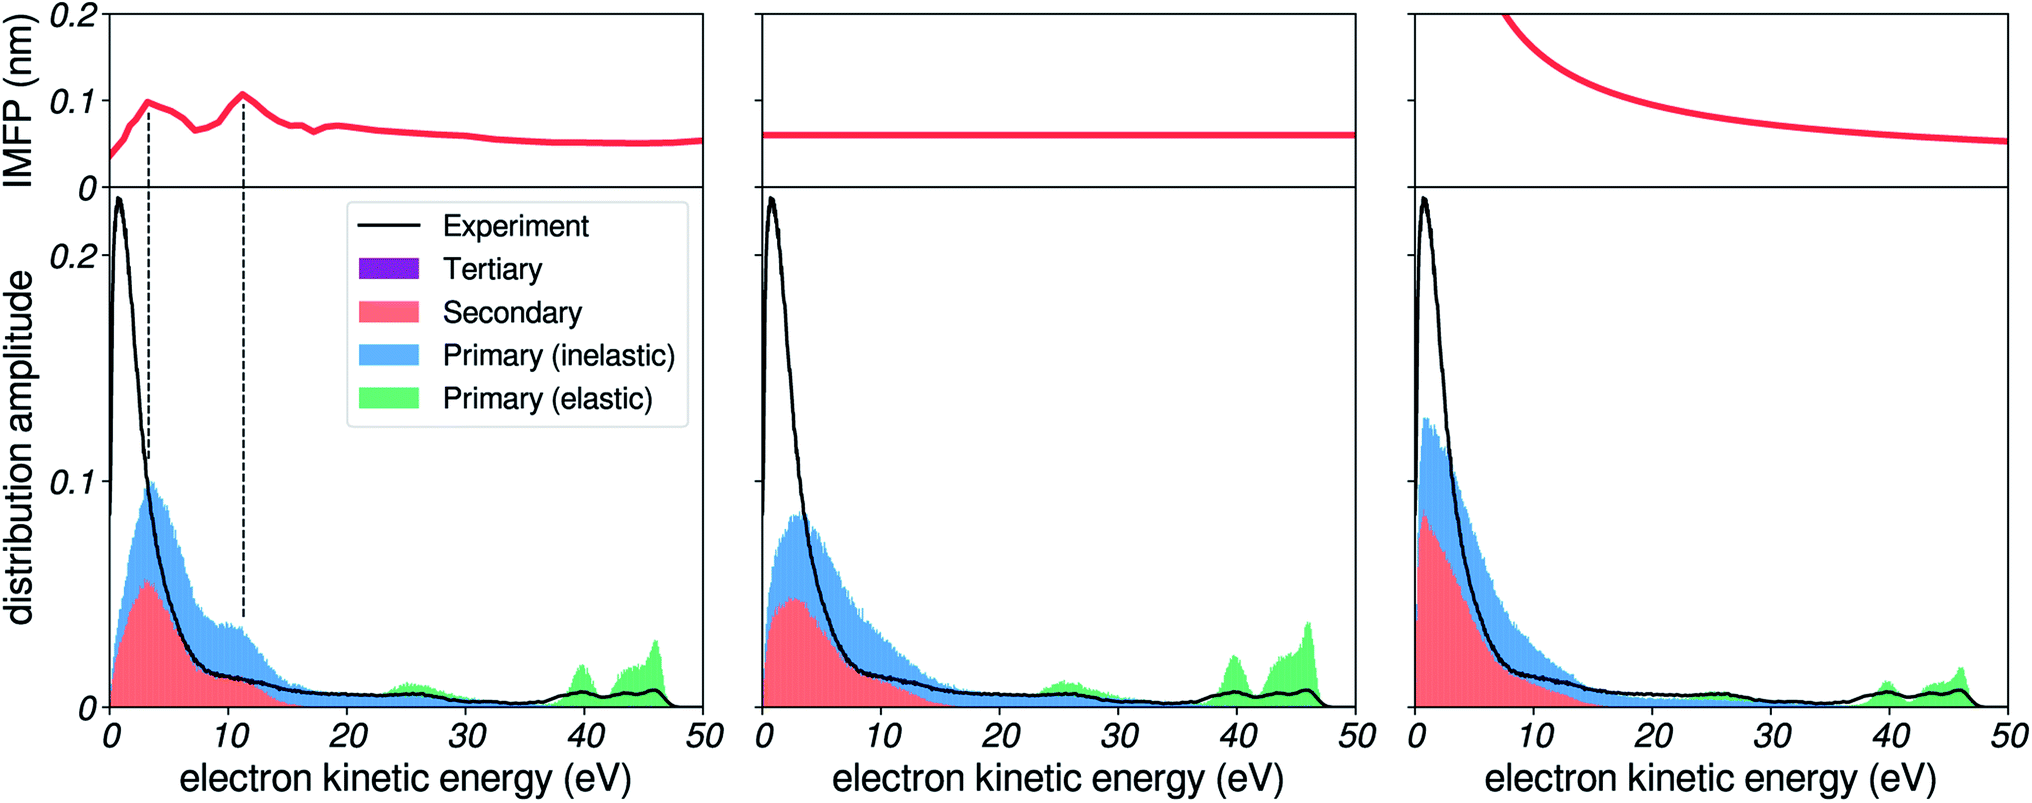 | ||
| Fig. 6 Influence of the IMFP. Comparison of simulated spectra to experimental results, for a photon energy corresponding to harmonic 37 of ≈800 nm (≈57.6 eV), for several IMFP. Left: extended amorphous ice IMFP. Middle: constant 3 nm IMFP. Right: increasing IMFP at low energies. | ||
This specific shape of the low-energy distribution is, however, not observed in our experimental spectra. Instead, a monotonous rise of the background is detected. This suggests that the oscillatory features found in the ice IMFP might not be present in the liquid phase.
In the rightmost panel, we show the results of the simulation for an IMFP that increases at low energies, in an effort to improve the agreement with the experimental data. This comparison demonstrates how the shape of the IMFP influences the distribution of low-energy electrons. First, the general shape of the background has a sharper exponential rise, following the shape of the IMFP for the reason mentioned above. Second, since the difference in IMFP between high and low kinetic energies is increased, the relative amplitudes of the high-energy photoelectron peaks (green portion) and of the low-energy background is also increased. This ratio of amplitudes agrees better with experiment.
Influence of felec
The onset of vibrational channels was found to have an important influence on the structure of the electron background. In Fig. 7, we report results of our simulations for the felec values taken from ice (left), vapour (middle), and for a sharper closing of electronic channels (right). Here, we used the constant 3 nm IMFP mentioned in the previous section, to keep a common reference.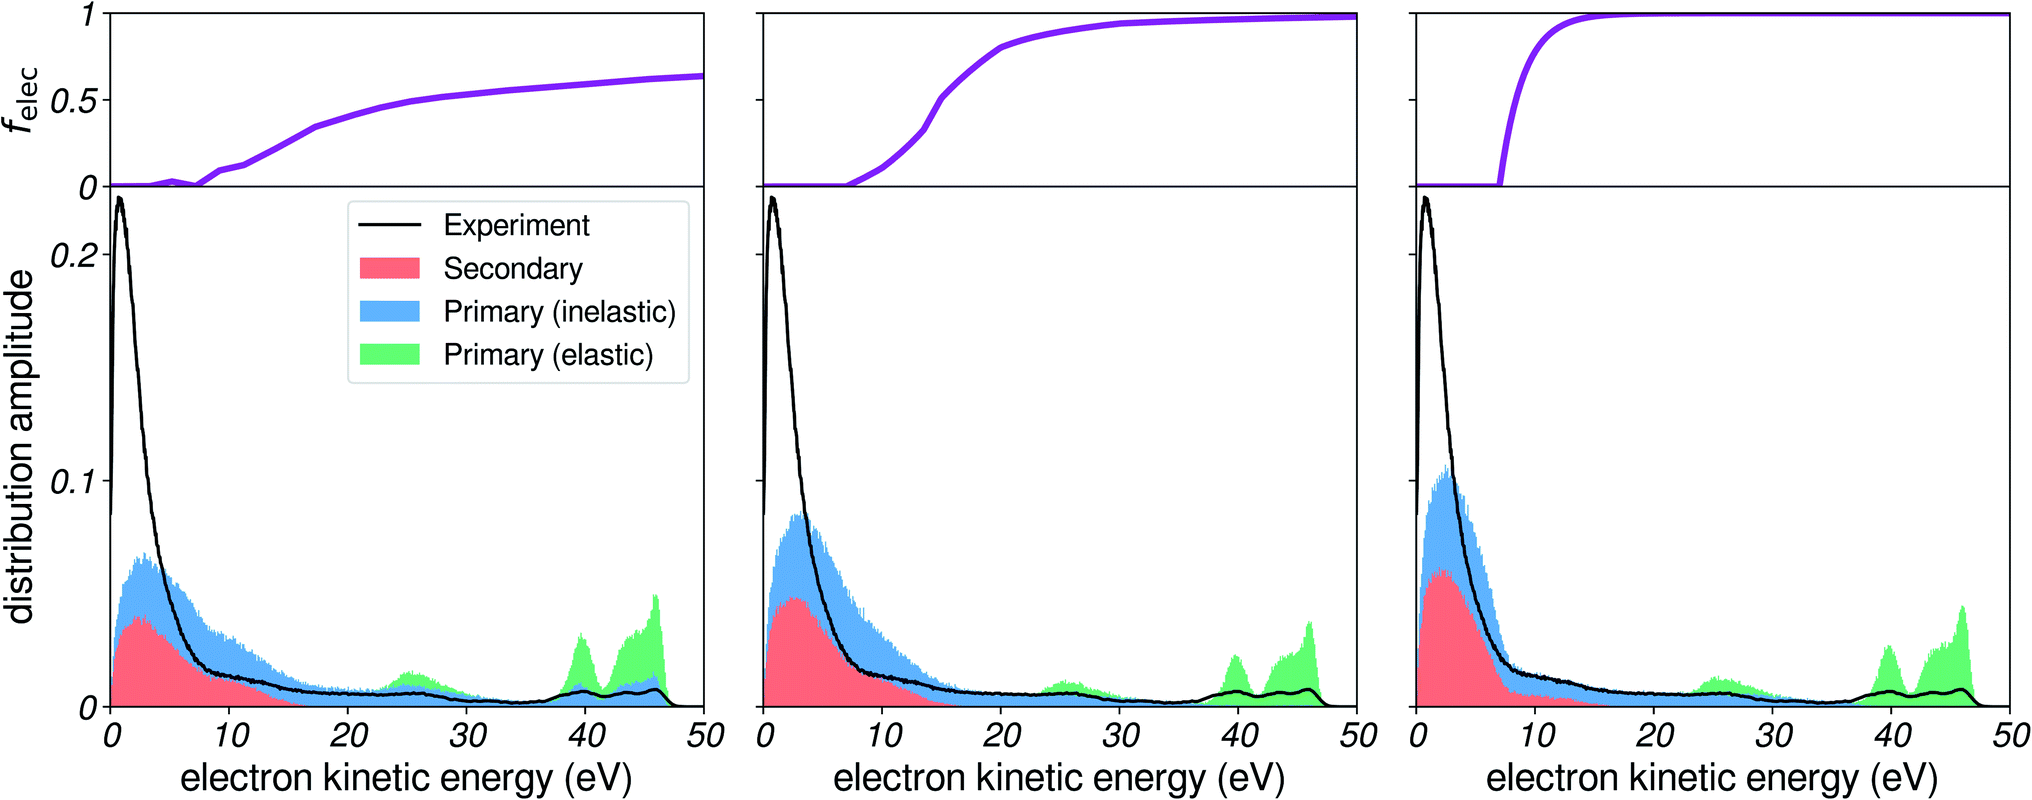 | ||
| Fig. 7 Influence of felec. Comparison of simulated spectra to experimental results for a photon energy corresponding to harmonic 37 of ≈800 nm (≈57.6 eV), using several felec. Left: amorphous ice. Middle: water vapour. Right: suggested sharper closing of electronic channels. | ||
When vibrational channels are dominant, electrons are likely to lose very small amounts of energy, and therefore inelastically scattered electrons (blue portion) remain close to their original position in the spectrum. Conversely, electronic channels efficiently displace electrons to the low-energy distribution, by involving large energy transfers. Therefore, the onset of this distribution is largely determined by felec.
With the values for ice, the distribution of inelastically scattered electrons is broad, and shows some amplitude below initial peak positions, corresponding to electrons that lost a very small amount of energy vibrationally. The values for vapour indicate less influence of vibrational events in the higher part of the spectrum, with a slightly sharper onset of the low-energy distribution. Still, this data does not allow our simulation to reproduce the very sharp rise of the background starting at ≈7 eV. It should be noted that the fraction for water vapour is not straightforward to estimate, as there is a serious lack of direct measurements of impact electron excitation cross sections.36
As a suggestion, we show results for an even sharper closing of electronic channels near the excitation threshold. This example again helps to understand how the spectrum of low-energy electrons acquires its shape. This choice brings the simulation into better agreement with experiment: the background rises sharply below ≈7 eV, and is an almost flat low-amplitude tail at higher kinetic energies. This could suggest that the transition from electronic to vibrational channels in liquid water happens very rapidly near the 7 eV threshold. Interestingly, the experimental distribution really starts to rise below 7 eV, whereas electronic channels have to vanish at 7 eV, according to the excitation gap for liquid water. This could suggest that vibrational channels should be more efficient at causing inelastic scattering than they are in the present model, which could hint at a shorter IMFP, or different SDCS.
In a recent paper,5 our group reported deviations of peak positions towards lower energies in the region of the spectrum located below kinetic energies of ≈10 eV. These shifts can be attributed to the increasing importance of vibrational scattering for slow electrons: these channels will cause small energy losses to the electrons (<1 eV) before detection, effectively displacing the peaks to slightly lower energies, as will be demonstrated in a later section of this article.
Spectra for several photon energies
Fig. 8 shows the comparison of our simulations with experimental spectra measured for different photon energies, corresponding to several harmonic orders. Here, we used the constant 3 nm IMFP, and the suggested sharper felec as it was found to improve the agreement with experiment. The general shape of the spectra is reasonably well simulated, with a clear flat tail at high energies and an accumulation of electrons at low energies. However, the relative amplitudes of the photoelectron peaks and of the low-energy background are not well reproduced: the main peaks are not depleted enough. As mentioned previously, this could hint at an IMFP increasing towards low energies. Another experimental observation supporting this idea is the increasing amplitude of the low-energy distribution with respect to the main peaks when going to higher photon energies: this suggests that faster electrons lose energy more efficiently than slower ones. Nevertheless, it is too early to reach a final conclusion: what our model really evidences is that there is an intricate interplay between many parameters that gives the low-energy electron spectra their shape.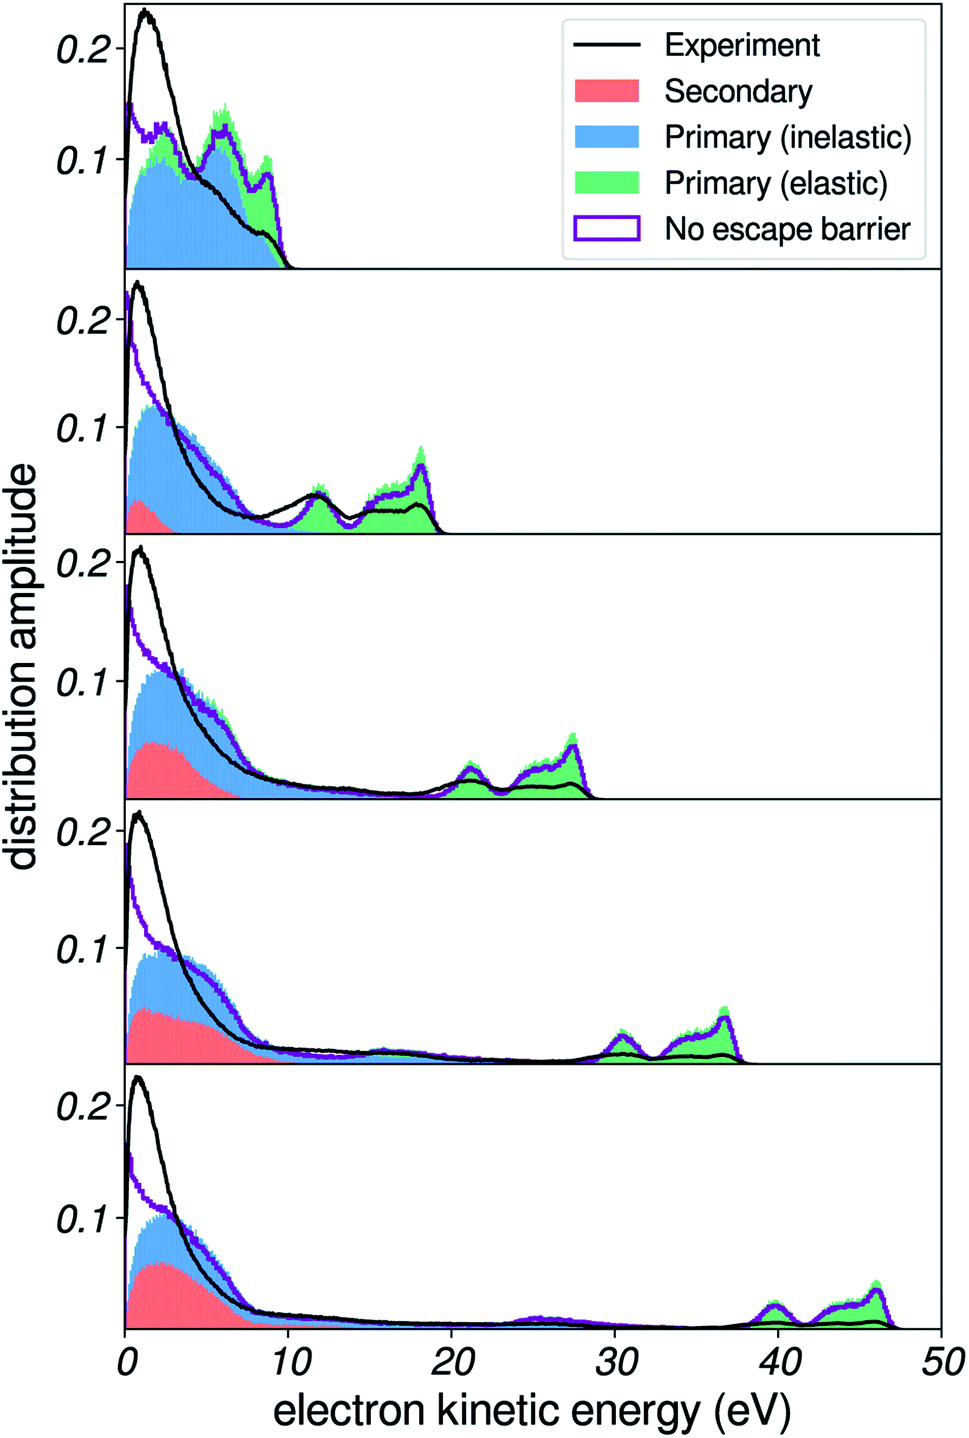 | ||
| Fig. 8 Spectra for several photon energies. Experimental and simulated spectra for five photon energies, corresponding to harmonics 13, 19, 25, 31 and 37 of ≈800 nm (≈20.2, ≈29.6, ≈38.9, ≈48.2, and ≈57.6 eV respectively). | ||
Additionally, we can mention that the low-energy distributions obtained experimentally could contain contributions from secondary electrons emitted by impact ionization of the vapour surrounding the jet. Some electrons could also be coming from ionization of the spectrometer itself: however, since such electrons are born inside the time-of-flight tube, they are not accelerated by the bias voltage and should therefore be located outside the spectrum of the liquid, and their contribution should be very small, if even present.
An interesting observation is the evolution of the low-energy distribution as the ionizing photon energy is varied. These simulations reveal that the fraction of secondary electrons increases with photon energy. This is straightforward to understand, since electrons that have more energy are more subject to losing enough energy to ionize one (or several) molecules. This also explains why the electron background in the spectra taken with harmonic 13 of 800 nm contains no true secondary electrons, since primary electrons are created with less energy than the lowest binding energy for liquid water (≈10 eV). We here obtain for the first time a quantitative estimate of the composition of the low-energy distribution, which demonstrates the previously claimed fact that the name of secondary electron background often used for this feature is misleading terminology.7 It is worth recalling here that our simulated background is most likely missing other contributions, the main one being the aforementioned ICD electrons. Such electrons are experimentally found to have an exponential distribution between 0 and ≈10 eV (ref. 42) and their inclusion could therefore improve the low-energy region of the simulated spectrum. However, one should remember that this population of electrons will only be a small percentage of the total one: at most, it will be equal to the number of primary electrons ejected from the inner-valence band, which has a low DOS in comparison to the outer valence orbitals.
Additionally, we report here as a purple line the simulated distribution without the effect of the escape barrier, to illustrate the kinetic-energy distribution of electrons inside the liquid (referenced to the vacuum level).
These simulations also directly indicate that background subtraction can be non-trivial at low photon energies. Often, a simple exponential decay, or an exponentially modified Gaussian, have been used in fitting procedures. Here, we are able to disentangle the origin of the electrons that make up the spectrum, and we observe that the background of inelastically scattered electrons actually has a structured shape, which causes the total peak to appear shifted. It should be noted that even a perfect subtraction of this background would not allow to recover the exact kinetic-energy distribution of the unscattered electrons: indeed, the mean free paths and cross sections are all kinetic-energy-dependent, which can cause some regions of the distribution to be more depleted than others.
Influence of the surface escape barrier
We now briefly turn to the effect of the surface escape barrier. As mentioned previously, theoretical calculations32 suggest that the value of the electron affinity of water can be different at the surface than in the bulk. Additionally, simulations have shown that the shape of the escape barrier can have a direct influence on the shape of photoelectron spectra at very low energies.17,43 In Fig. 9, we report simulations for several values of the surface potential barrier, for a constant bulk electron affinity of 0.2 eV. The rightmost panel uses a EB = 0.8 eV surface barrier as in previous sections (i.e. electrons are 0.6 eV faster at the surface than in the bulk), whereas the middle and leftmost panels use EB = 0.5 and 0.2 eV respectively. The purple line shows the electron distribution without the effect of the escape barrier applied, and is of course the same in all cases.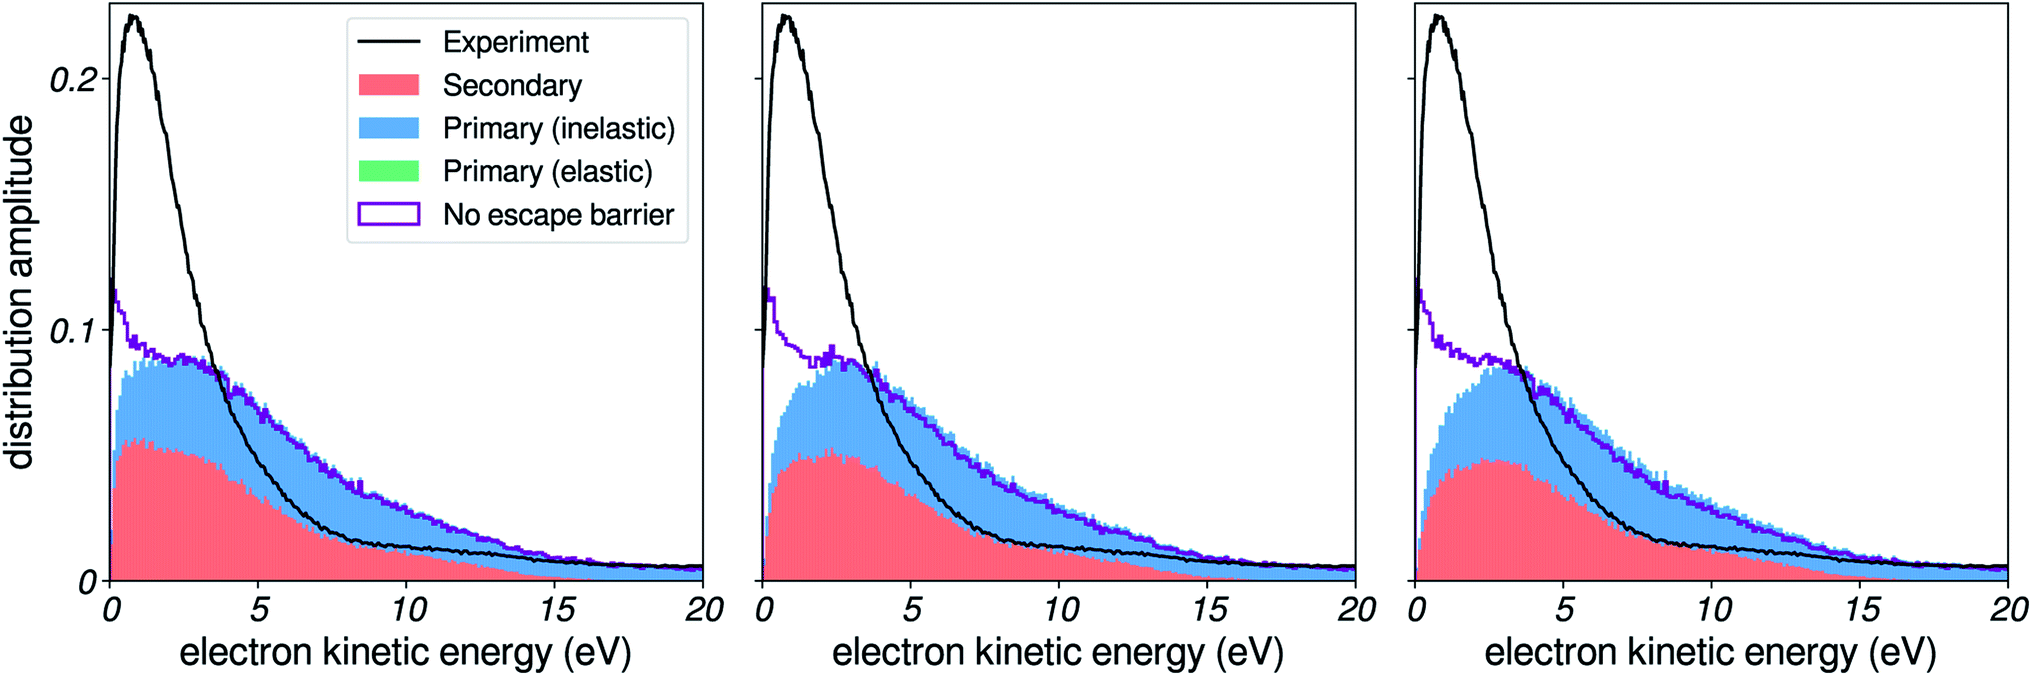 | ||
| Fig. 9 Influence of the escape barrier. Comparison of simulated spectra to experimental results, for a photon energy corresponding to harmonic 37 of ≈800 nm (≈57.6 eV), for several surface escape barriers. Left: 0.2 eV barrier. Middle: 0.5 eV barrier. Right: 0.8 eV barrier. | ||
A noticeable influence of the height of the barrier can be detected: essentially, the higher the escape barrier, the more depletion of the spectrum is induced, and as a consequence the apparent peak position of the background is shifted to higher kinetic energy. This is rather intuitively understood: when the barrier is increased (i.e. electrons are more accelerated at the surface), a bigger fraction of the momentum of the electron needs to be oriented perpendicular to the surface in order to overcome the potential step, thus the acceptance angle range for transmission at the surface is reduced. Interestingly, the very low-energy region agrees better with experiment with the 0.2 eV barrier, which produces a less sharp depletion at very low kinetic energies. This might hint at a lower value for the escape barrier of water than is currently estimated, and demonstrates that yet another physical phenomenon could be probed via in-depth studies of the low-energy background of photoelectron spectra.
Scattering of very low-energy electrons
In this section, we use our simulations to demonstrate the effects of vibrational energy loss on the shape of photoelectron spectra. These include shifting of peak positions, and distortion of the kinetic-energy distributions. In Fig. 10, we present results for a Gaussian initial distribution of kinetic energies (dashed red line) centered at different positions. We used the sharp felec used in the right column of Fig. 7, and a constant 3 nm IMFP.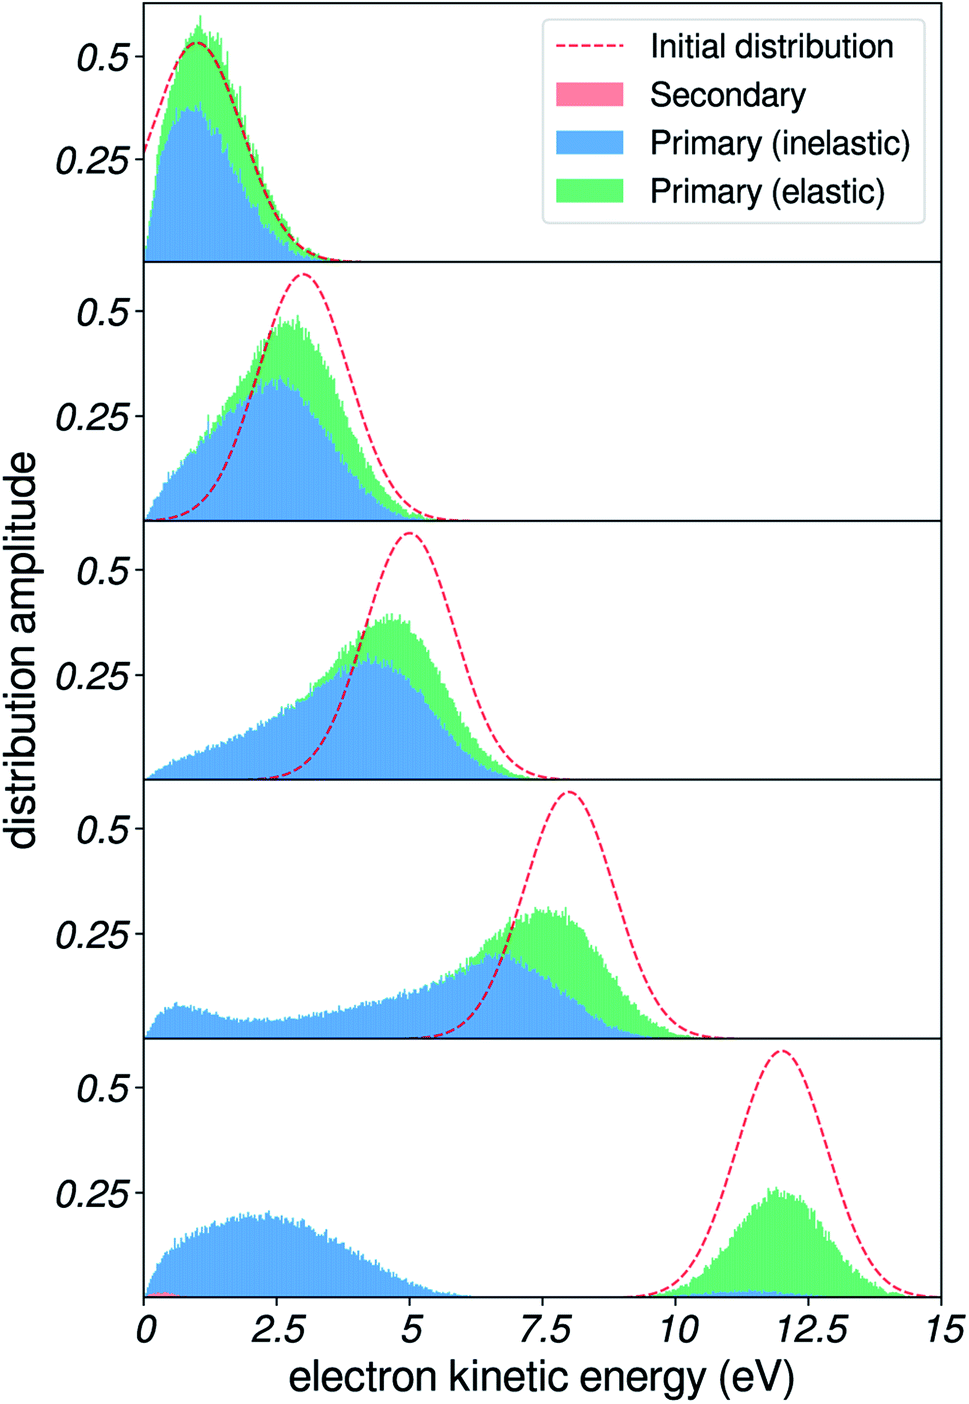 | ||
| Fig. 10 Effects of inelastic scattering on a model photoelectron peak. Result of the simulation on a Gaussian initial distribution of kinetic energies, centered at 1, 3, 5, 8 and 12 eV. | ||
When the Gaussian-shaped initial distribution is positioned at a high kinetic energy (i.e. well above the excitation gap of 7 eV), electronic channels dominate. The resulting peak is observed at its initial position in the spectrum. As we move the initial distribution to lower energies, a background of vibrationally scattered electrons builds up near the main peak, and produces a shift of the apparent position of the detected peak, in agreement with our recent observations for the valence peaks of liquid water.5
These spectra are similar to experimental spectra of solvated electrons in liquid water. Spectra taken at high photon energies (i.e. initial distribution of electrons above the excitation threshold of water) evidence a Gaussian-shaped distribution of binding energies.6,9 In contrast, spectra measured with smaller photon energies yield distorted lineshapes,6,8 due to inelastic-scattering effects. In future developments, such spectra could also be used as benchmarks to validate or even adjust scattering parameters at very low kinetic energies. Photoelectron spectroscopy of solutes with small binding energies could also be a source of similar spectra.
Conclusions and outlook
We have developed a simulation of electron elastic and inelastic scattering as a means to predict complete photoelectron spectra of liquid water for the first time. Experimental spectra were recorded using a high-harmonic source and a liquid-water microjet, and compared to our simulations. This approach gives unprecedented insights into the composition of the low-energy electron spectra and their sensitivity to the scattering parameters used as input, therefore showing considerable promise as a benchmarking tool for the critical assessment of electron-scattering parameters. Computational techniques such as machine learning could be used in the future to fit scattering parameters to experimental spectra, in an effort to establish reliable electron scattering data at low kinetic energies and thereby advance our understanding of the fundamental underlying physical processes.The comparison of such simulations to additional experimental photoelectron spectra promises important advances. For example, electron–electron coincidence maps42 contain information on how to model secondary electron generation upon electron impact ionization and attosecond time-resolved photoelectron spectroscopy25,26,44 is sensitive to electron mean free paths.45 We demonstrated how this method allowed us to disentangle the structure of the low-energy electron spectra, and how it can help to understand scattering-induced electron energy losses in the condensed phase.
We argue that the comparison to experimental photoelectron spectra and/or other experimental observables should be used as a performance assessment tool for future simulations of electron transport and production in liquids, most importantly before any attempt to retrieve information from such simulations. Overall, we demonstrate the many far-reaching possibilities that an accurate scattering model will provide, and a large part of the reasoning developed herein extends beyond the special case of liquid water and holds for other liquids or insulators. Our work therefore represents an important first step towards predictive simulations of electron scattering in liquid water.
Appendix A – ELF extension using the MPA
Formulae for the MPA
The formulae used in the MPA are reproduced for completeness here. See ref. 13 and 38 for more information.In the normal MPA, the ELF is obtained from the integral
 | (8) |
For the normal MPA, the G function is
 | (9) |
 | (10) |
 | (11) |
In these expressions, γ is a phenomenological damping coefficient. For extending the electronic part of the ELF, we used the value γ = 0.01 eV, which was kindly communicated by Nguyen-Truong. For extending the vibrational part of the ELF, this value did not allow to correctly fit the narrow peaks in the OELF, and we therefore used γ = 0.001 eV.
For the modified MPA, the G function is
 | (12) |
 | (13) |
 | (14) |
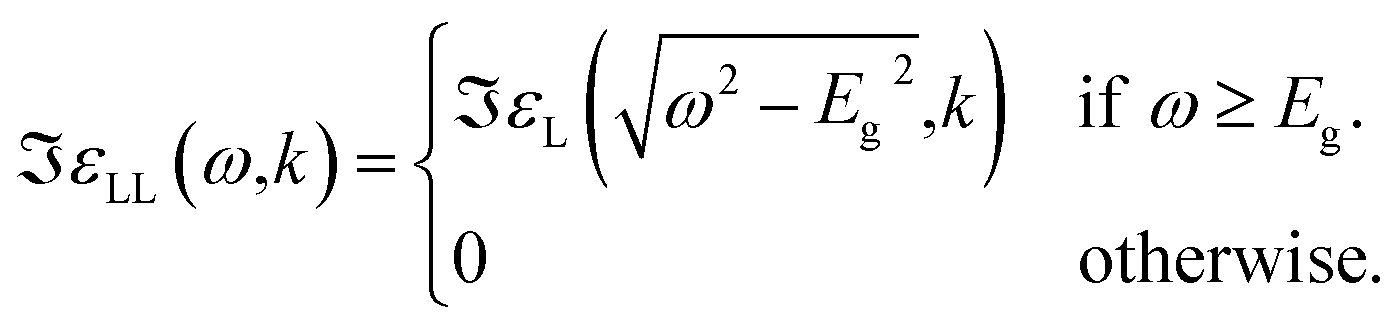
Optical ELF
The OELF was obtained from three sources, suited for three different energy domains. From 1.2 × 10⁻⁷ eV to 7 eV, the OELF was built from complex refractive index n(ω) + iκ(ω) measurements,46 using the relations15| ε1(ω,k = 0) = n2(ω) − κ2(ω) | (15) |
| ε2(ω,k = 0) = 2n(ω)κ(ω) | (16) |
 | (17) |
From 7 eV to 100 eV, we used recent inelastic X-ray scattering measurements of the OELF.35 From 100 eV to 405 keV, we used the mass photoabsorption coefficient μ(ω) from the FFAST database,47 and the formula
 | (18) |
 | ||
| Fig. 11 ELF for liquid water. Top: OELF for liquid water. Each color corresponds to one of the three sources described in the text. The green line indicates the 7 eV excitation gap above which the electronic part of the OELF is located. Bottom: ELF for liquid water extended using the MPA. The first plot shows the portion corresponding to electronic energy loss. The second plot shows the portion attributed to vibrational energy loss. | ||
The internal consistency of the optical data was tested using the Kramers–Kronig and f sum rules. They hold up to 4.67% and 5.16% error, respectively.
Vibrational and electronic ELF
When extending the OELF of water to non-zero k, most algorithms tend to overestimate the ELF at the energy gap: the electronic part of the ELF will get extended to non-zero values below ω = 7 eV, in disagreement with the rare experimental values for the full ELF.48 For this reason, we used the improved MPA proposed by Nguyen-Truong, which includes the presence of a gap in the extension procedure, and is able to efficiently extend the OELF in good agreement with experiment.13 In this case, the OELF was set to zero below 7 eV. This works well for extending the electronic part of the ELF, which is located above the gap. The resulting portion of the ELF, corresponding to electronic energy losses, is shown in the second plot of Fig. 11.For extending the vibrational part of the ELF however, this method is not suited, as it assumes a zero ELF below 7 eV. For this part, we used the normal MPA, also proposed by Nguyen-Truong.38 This time, the whole OELF was used. The resulting portion of the ELF is shown in the third plot of Fig. 11.
Appendix B – parameters for photoemission
The initial angles for electron trajectories need to be sampled from the PAD for photoionization of bulk liquid water. For symmetry reasons, these PAD are given by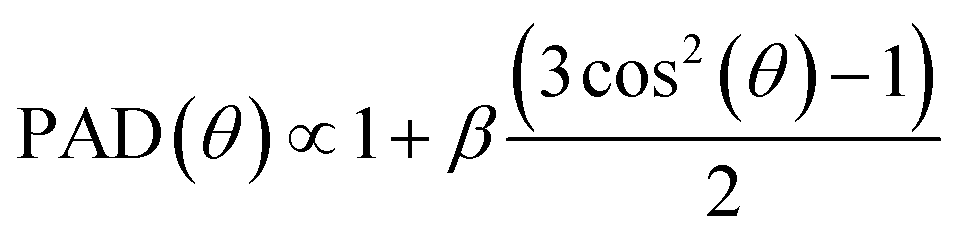 | (19) |
This coefficient has been measured experimentally in small water clusters, for several ionizing photon energies, and for each of the three valence orbitals of water.49 In Fig. 12, we reproduce some of these values.
 | ||
| Fig. 12 β parameter for photoemission. Experimental β anisotropy coefficient as a function of emitted electron kinetic energy, for n = 1, 6 and 20 water clusters and for the three valence orbitals of water. Results reproduced from ref. 49. The red line is the analytical extrapolation used in our simulation. | ||
The β coefficient is found to converge rapidly with cluster size, with values not changing significantly for n larger than ≈6. For such small clusters, we expect the effects of scattering of emitted electrons with molecules to be small, and therefore assume the converged β to decently reproduce the angular emission distributions from a local liquid water environment.
Importantly, the significant differences in β values from one orbital to another observed for the monomer are found to vanish for clusters larger than a few molecules. Therefore, the β values were chosen only according to the kinetic energy of the photoelectron, and regardless of the orbital it was emitted from.
Since few data points are available for large clusters, we did an analytical extrapolation of the converged β values by following the trend observed for the smaller clusters. The resulting curve is shown in red, and has the analytical expression
| β(E) = 1 − e−(E − 3)/13 + 0.05, | (20) |
For each trajectory with kinetic energy E, the initial angle was sampled by computing the corresponding β(E) from this curve, and by using eqn (19) as probability distribution.
Appendix C – geometry approximations
Our experimental cylindrical geometry is slightly more complex than that of a single locally semi-infinite flat surface, as the polarization of the ionizing light is taken into account for the photoemission step of the simulation. Indeed, the portion of the jet facing the incoming light has this polarization parallel to the surface, while the portion facing the skimmer has it orthogonal to the surface, and all intermediate cases exist. Therefore, when detecting electrons coming from all around the jet, the total spectrum should essentially be a weighted sum of spectra obtained for different angles of the polarization relative to a semi-infinite flat-surface.50 However, we found that this polarization direction did not have an important influence on the simulated spectra, at least when compared to the effects that we demonstrate in this work. Here, we show simulated spectra for three cases, corresponding to 0, 45 and 90° orientations of the polarization. Other simulations showed a small dependence of spectra on polarization angle (see ESI of ref. 8), and another study concluded that flat-surface and cylindrical experiments produced essentially identical results.50 Therefore, we kept the simpler semi-infinite flat-surface geometry, with the polarization set orthogonal to the surface.We also chose to use a constant exponential distribution for sampling starting depths, in order to reduce computational costs. Also, this enables us to focus more on scattering-induced effects. The choice of 10 nm for the exponential tail is motivated by reported values for the EAL, which are around 2–3 nm: the probing depth for electrons that have scattered inelastically multiple times has to be a few times this EAL. Actually, changing the sampling depth has little effects on our simulated distributions: in Fig. 13, we demonstrate that the distribution is essentially unchanged in the two limiting cases.
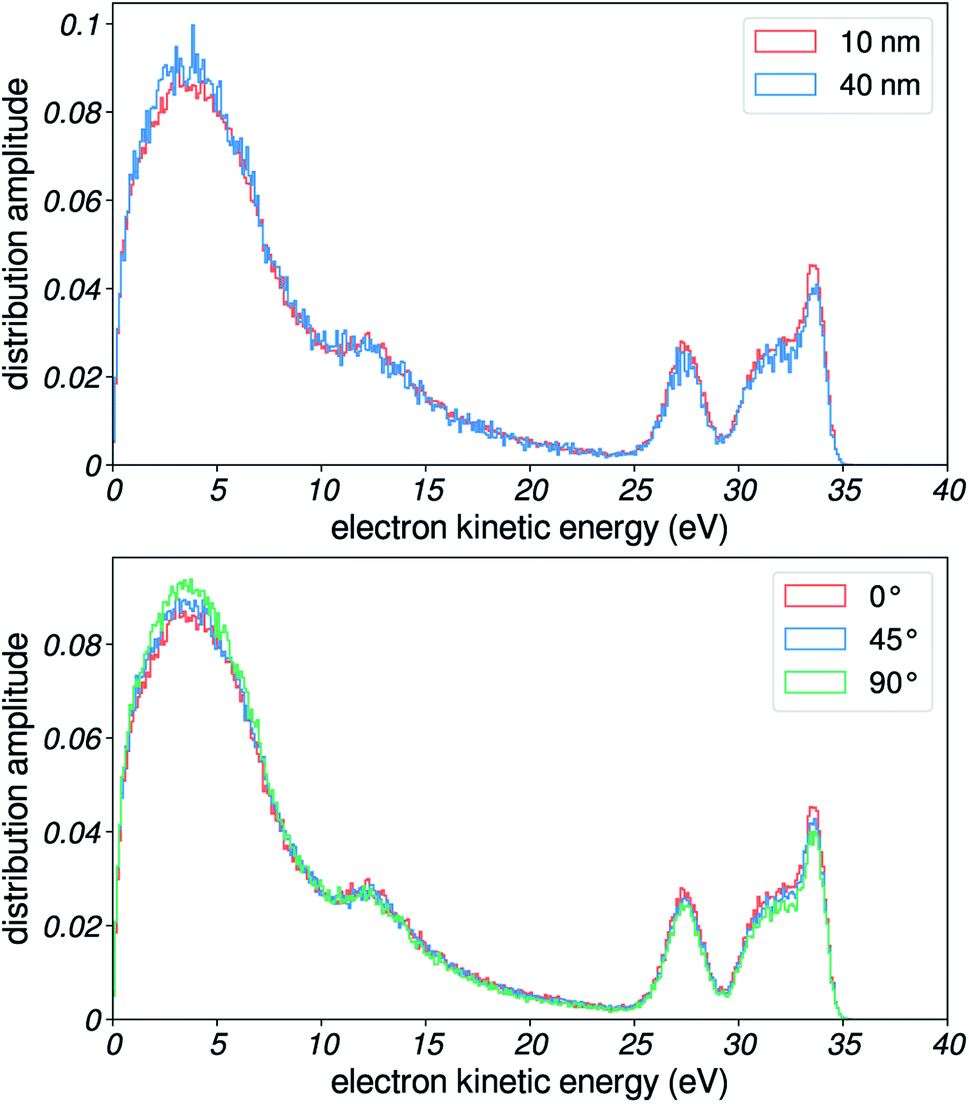 | ||
| Fig. 13 Effects of sampling depth and polarization orientation. Left: simulated distributions for two limiting values of exponential tail for sampling initial depth. Right: simulated distributions for three angles of the polarization with respect to the normal to the water surface. | ||
These geometry approximations are useful for focusing our analysis on scattering-induced effects.
Appendix D – elastic ADCS
We approximate the elastic ADCS for liquid water by computing the ADCS for water clusters with the programs Quantemol51 for electron kinetic energies below 10 eV and with ePolyScat52,53 otherwise, using the program PolyDCS54 for post-processing. The nuclear configurations of the clusters were taken from ref. 55 and the electronic structure was computed with the program package Gaussian,56 using Hartree–Fock theory and a cc-pVTZ basis set. For the simulations we used the results for the water heptamer as a good compromise between numerical accuracy and convergence of the ADCS with cluster size towards the bulk ADCS. Fig. 14 shows that ADCS, scaled to unity in forward scattering direction. | ||
| Fig. 14 ADCS for elastic scattering ADCS resulting from quantum calculations on water heptamers, normalized to the forward peak. Below 10 eV, Quantemol was used. Above 10 eV, ePolyScat was used. In both cases, the results were post-processed in PolyDCS. | ||
Data availability
All relevant data is displayed in the figures of this article.Author contributions
T. G. developed the methodology, performed the calculations and wrote the initial draft of the manuscript. P. Z. carried out the experimental measurements with the support of T. G. A. S. contributed his Monte-Carlo-simulation code including elastic scattering and provided theoretical guidance. H. J. W. proposed and supervised the whole project. All authors discussed the results and contributed to the final version of the manuscript.Conflicts of interest
There are no competing interests to declare.Acknowledgements
The École Normale Supérieure, Paris (http://www.chimie.ens.fr/?q=en) is gratefully acknowledged for T. Gadeyne's fellowship. We thank ETH Zürich for financial support. AS also thanks the Swiss National Science Foundation for supporting this research with an Ambizione grant (Grant No. 174![[thin space (1/6-em)]](https://www.rsc.org/images/entities/char_2009.gif) 212). The calculations were run on the Euler cluster of ETH Zürich.
212). The calculations were run on the Euler cluster of ETH Zürich.
References
- B. C. Garrett, D. A. Dixon, D. M. Camaioni, D. M. Chipman, M. A. Johnson, C. D. Jonah, G. A. Kimmel, J. H. Miller, T. N. Rescigno and P. J. Rossky, et al., Role of water in electron-initiated processes and radical chemistry: issues and scientific advances, Chem. Rev., 2005, 105(1), 355–390 CrossRef CAS PubMed.
- E. Alizadeh, T. M. Orlando and L. Sanche, Biomolecular damage induced by ionizing radiation: the direct and indirect effects of low-energy electrons on DNA, Annu. Rev. Phys. Chem., 2015, 66, 379–398 CrossRef CAS PubMed.
- H. Nikjoo, D. Emfietzoglou, T. Liamsuwan, R. Taleei, D. Liljequist and S. Uehara, Radiation track, DNA damage and response—a review, Rep. Prog. Phys., 2016, 79(11), 116601 CrossRef CAS PubMed.
- C.-R. Wang, J. Nguyen and Q.-B. Lu, Bond Breaks of Nucleotides by Dissociative Electron Transfer of Nonequilibrium Prehydrated Electrons: A New Molecular Mechanism for Reductive DNA Damage, J. Am. Chem. Soc., 2009, 131(32), 11320–11322 CrossRef CAS PubMed.
- C. F. Perry, I. Jordan, P. Zhang, A. von Conta, F. B. Nunes and H. J. Wörner, Photoelectron Spectroscopy of Liquid Water with Tunable Extreme-Ultraviolet Radiation: Effects of Electron Scattering, J. Phys. Chem. Lett., 2021, 12(11), 2990–2996 CrossRef CAS PubMed.
- J. Nishitani, Y.-I. Yamamoto, C. W. West, S. Karashima and T. Suzuki, Binding energy of solvated electrons and retrieval of true UV photoelectron spectra of liquids, Sci. Adv., 2019, 5(8), eaaw6896 CrossRef CAS PubMed.
- S. Malerz, F. Trinter, U. Hergenhahn, A. Ghrist, H. Ali, C. Nicolas, C.-M. Saak, C. Richter, S. Hartweg, L. Nahon, C. Lee, C. Goy, D. M. Neumark, G. Meijer, I. Wilkinson, B. Winter and S. Thürmer, Low-energy constraints on photoelectron spectra measured from liquid water and aqueous solutions, Phys. Chem. Chem. Phys., 2021, 23(14), 8246–8260 RSC.
- D. Luckhaus, Y.-I. Yamamoto, T. Suzuki and S. Ruth, Genuine binding energy of the hydrated electron, Sci. Adv., 2017, 3(4), e1603224 CrossRef PubMed.
- V. Svoboda, R. Michiels, A. C. LaForge, F. Stienkemeier, P. Slavíček and H. J. Wörner, Real-time observation of water radiolysis and hydrated electron formation induced by extreme-ultraviolet pulses, Sci. Adv., 2020, 6(3), eaaz0385 CrossRef CAS PubMed.
- A. von Conta, M. Huppert and H. J. Wörner, A table-top monochromator for tunable femtosecond XUV pulses generated in a semi-infinite gas cell: experiment and simulations, Rev. Sci. Instrum., 2016, 87(7), 073102 CrossRef CAS PubMed.
- I. Jordan, M. Huppert, M. A. Brown, J. A. van Bokhoven and H. J. Wörner, Photoelectron spectrometer for attosecond spectroscopy of liquids and gases, Rev. Sci. Instrum., 2015, 86(12), 123905 CrossRef CAS PubMed.
- N. Sinha and B. Antony, Mean free paths and cross sections for electron scattering from liquid water, J. Phys. Chem. B, 2021, 125(21), 5479–5488 CrossRef CAS PubMed.
- H. T. Nguyen-Truong, Low-energy electron inelastic mean free paths for liquid water, J. Phys.: Condens. Matter, 2018, 30(15), 155101 CrossRef PubMed.
- D. Emfietzoglou, P. George and H. Nikjoo, Monte Carlo Electron Track Structure Calculations in Liquid Water Using a New Model Dielectric Response Function, Radiat. Res., 2017, 188(3), 355–368 CrossRef CAS PubMed.
- M. A. Flores-Mancera, J. S. Villarrubia and M.-J. L. Guerda, Electron Inelastic Mean Free Paths for LiF, CaF2, Al2O3, and Liquid Water from 433 keV down to the Energy Gap, ACS Omega, 2020, 5(8), 4139–4147 CrossRef CAS PubMed.
- R. Garcia-Molina, I. Abril, I. Kyriakou and D. Emfietzoglou, Inelastic scattering and energy loss of swift electron beams in biologically relevant materials, Surf. Interface Anal., 2017, 49(1), 11–17 CrossRef CAS.
- K. Mehnaz, L. H. Yang, Y. B. Zou, B. Da, S. F. Mao, H. M. Li, Y. F. Zhao and Z. J. Ding, A comparative study on Monte Carlo simulations of electron emission from liquid water, Med. Phys., 2020, 47(2), 759–771 CrossRef PubMed.
- H. Shinotsuka, B. Da, S. Tanuma, H. Yoshikawa, C. J. Powell and D. R. Penn, Calculations of electron inelastic mean free paths. XI. Data for liquid water for energies from 50 eV to 30 keV, Surf. Interface Anal., 2017, 49(4), 238–252 CrossRef CAS PubMed.
- P. de Vera, I. Abril and R. Garcia-Molina, Excitation and ionisation cross sections in condensed-phase biomaterials by electrons down to very low energy: application to liquid water and genetic building blocks, Phys. Chem. Chem. Phys., 2021, 23(9), 5079–5095 RSC.
- M. Michaud, A. Wen and L. Sanche, Cross sections for low-energy (1–100 eV) electron elastic and inelastic scattering in amorphous ice, Radiat. Res., 2003, 159(1), 3–22 CrossRef CAS PubMed.
- S. Ruth, Electron Scattering in Liquid Water and Amorphous Ice: A Striking Resemblance, Phys. Rev. Lett., 2020, 124(20), 205501 CrossRef PubMed.
- A. Schild, M. Peper, C. Perry, D. Rattenbacher and H. J. Wörner, Alternative Approach for the Determination of Mean Free Paths of Electron Scattering in Liquid Water Based on Experimental Data, J. Phys. Chem. Lett., 2020, 11(3), 1128–1134 CrossRef CAS PubMed.
- Y.-I. Suzuki, K. Nishizawa, N. Kurahashi and T. Suzuki, Effective attenuation length of an electron in liquid water between 10 and 600 eV, Phys. Rev. E: Stat., Nonlinear, Soft Matter Phys., 2014, 90(1), 010302 CrossRef PubMed.
- S. Thürmer, R. Seidel, M. Faubel, W. Eberhardt, J. C. Hemminger, S. E. Bradforth and B. Winter, Photoelectron Angular Distributions from Liquid Water: Effects of Electron Scattering, Phys. Rev. Lett., 2013, 111(17), 173005 CrossRef PubMed.
- I. Jordan, M. Huppert, D. Rattenbacher, M. Peper, D. Jelovina, C. Perry, A. von Conta, A. Schild and H. J. Wörner, Attosecond spectroscopy of liquid water, Science, 2020, 369(6506), 974–979 CrossRef CAS PubMed.
- H. J. Wörner, A. Schild, D. Jelovina, I. Jordan, C. Perry, T. T. Luu and Z. Yin, Attosecond dynamics in liquids, 2020, arXiv preprint arXiv:2009.04913.
- M. Faubel, B. Steiner and J. P. Toennies, Photoelectron spectroscopy of liquid water, some alcohols, and pure nonane in free microjets, J. Chem. Phys., 1997, 106(22), 9013–9031 CrossRef CAS.
- C. F. Perry, P. Zhang, F. B. Nunes, I. Jordan, A. von Conta and H. J. Wörner, Ionization Energy of Liquid Water Revisited, J. Phys. Chem. Lett., 2020, 11(5), 1789–1794 CrossRef CAS PubMed.
- K. Alexander, M. Jan, M. Wilke, M. Alexandre, N. Engel, R. Al-Obaidi, C. Richter, R. Golnak, I. Y. Kiyan and E. F. Aziz, Time-of-flight electron spectrometer for a broad range of kinetic energies, Rev. Sci. Instrum., 2013, 84(2), 023106 CrossRef PubMed.
- D. Liljequist, A study of errors in trajectory simulation with relevance for 0.2–50eV electrons in liquid water, Radiat. Phys. Chem., 2008, 77(7), 835–853 CrossRef CAS.
- https://gitlab.com/axelschild/CLstunfti .
- A. P. Gaiduk, T. A. Pham, M. Govoni, F. Paesani and G. Galli, Electron affinity of liquid water, Nat. Commun., 2018, 9(1), 247 CrossRef PubMed.
- J. V. Coe, A. D. Earhart, M. H. Cohen, G. J. Hoffman, H. W. Sarkas and K. H. Bowen, Using cluster studies to approach the electronic structure of bulk water: reassessing the vacuum level, conduction band edge, and band gap of water, J. Chem. Phys., 1997, 107(16), 6023–6031 CrossRef CAS.
- J. Stähler, J.-C. Deinert, D. Wegkamp, S. Hagen and M. Wolf, Real-Time Measurement of the Vertical Binding Energy during the Birth of a Solvated Electron, J. Am. Chem. Soc., 2015, 137(10), 3520–3524 CrossRef PubMed.
- H. Hayashi and N. Hiraoka, Accurate Measurements of Dielectric and Optical Functions of Liquid Water and Liquid Benzene in the VUV Region (1–100 eV) Using Small-Angle Inelastic X-ray Scattering, J. Phys. Chem. B, 2015, 119(17), 5609–5623 CrossRef CAS PubMed.
- Mi-Y. Song, H. Cho, G. P. Karwasz, V. Kokoouline, Y. Nakamura, J. Tennyson, A. Faure, N. J. Mason and Y. Itikawa, Cross Sections for Electron Collisions with H2O, J. Phys. Chem. Ref. Data, 2021, 50(2), 023103 CrossRef CAS.
- B. Grosswendt and E. Waibel, Transport of low energy electrons in nitrogen and air, Nucl. Instrum. Methods, 1978, 155(1), 145–156 CrossRef CAS.
- H. T. Nguyen-Truong, Penn Algorithm Including Damping for Calculating the Electron Inelastic Mean Free Path, J. Phys. Chem. C, 2015, 119(14), 7883–7887 CrossRef CAS.
- D. Emfietzoglou, I. Kyriakou, R. Garcia-Molina, I. Abril and H. Nikjoo, Inelastic cross sections for low-energy electrons in liquid water: exchange and correlation effects, Radiat. Res., 2013, 180(5), 499–513 CrossRef CAS PubMed.
- D. Emfietzoglou, I. Kyriakou, R. Garcia-Molina and I. Abril, Inelastic mean free path of low-energy electrons in condensed media: beyond the standard models, Surf. Interface Anal., 2017, 49(1), 4–10 CrossRef CAS.
- D. Emfietzoglou, Inelastic cross sections for electron transport in liquid water: a comparison of dielectric models, Radiat. Phys. Chem., 2003, 66(6), 373–385 CrossRef CAS.
- P. Zhang, C. Perry, T. T. Luu, D. Matselyukh and H. J. Wörner, Observation of intermolecular Coulombic decay in liquid water, 2021, arXiv:2103.15014 [physics].
- T. E. Gartmann, B. L. Yoder, R. Signorell and L. Ban, Low-Energy Electron Escape from Liquid Interfaces: Charge and Quantum Effects, Phys. Rev. Lett., 2020, 124(1), 013402 CrossRef PubMed.
- A. Jain, R. Heider, M. Wagner, A. Duensing, T. Gaumnitz, I. Jordan, J. Ma, J. Riemensberger, M. Mittermair, W. Helml, R. Kienberger and H. J. Wörner, Attosecond-streaking spectroscopy on a liquid-water microjet, CLEO-Europe, 2017, paper CF_6_4.
- D. Rattenbacher, I. Jordan, A. Schild and H. J. Wörner, Nonlocal mechanisms of attosecond interferometry and implications for condensed-phase experiments, Phys. Rev. A, 2018, 97(6), 063415 CrossRef CAS.
- D. J. Segelstein, The complex refractive index of water, Thesis, University of Missouri–Kansas City, 1981.
- C. T. Chantler, K. Olsen, R. A. Dragoset, J. Chang, A. R. Kishore, S. A. Kotochigova and D. S. Zucker, X-Ray Form Factor, Attenuation and Scattering Tables, 2005 Search PubMed.
- N. Watanabe, H. Hayashi and Y. Udagawa, Bethe Surface of Liquid Water Determined by Inelastic X-Ray Scattering Spectroscopy and Electron Correlation Effects, Bull. Chem. Soc. Jpn., 1997, 70(4), 719–726 CrossRef CAS.
- S. Hartweg, B. L. Yoder, G. A. Garcia, L. Nahon and R. Signorell, Size-Resolved Photoelectron Anisotropy of Gas Phase Water Clusters and Predictions for Liquid Water, Phys. Rev. Lett., 2017, 118(10), 103402 CrossRef PubMed.
- G. Olivieri, K. M. Parry, C. J. Powell, D. J. Tobias and M. A. Brown, Simulated photoelectron intensities at the aqueous solution–air interface for flat and cylindrical (microjet) geometries, Phys. Chem. Chem. Phys., 2017, 19(9), 6330–6333 RSC.
- J. Tennyson, D. B. Brown, J. J. Munro, I. Rozum, H. N. Varambhia and N. Vinci, Quantemol-N: an expert system for performing electron molecule collision calculations using the R-matrix method, J. Phys.: Conf. Ser., 2007, 86, 012001 CrossRef.
- F. A. Gianturco, R. R. Lucchese and N. Sanna, Calculation of low-energy elastic cross sections for electron-CF4 scattering, J. Chem. Phys., 1994, 100(9), 6464–6471 CrossRef CAS.
- A. P. P. Natalense and R. R. Lucchese, Cross section and asymmetry parameter calculation for sulfur 1s photoionization of SF6, J. Chem. Phys., 1999, 111(12), 5344–5348 CrossRef CAS.
- N. Sanna and F. A. Gianturco, Differential cross sections for electron/positron scattering from polyatomic molecules, Comput. Phys. Commun., 1998, 114(1), 142–167 CrossRef CAS.
- B. Temelso, K. A. Archer and G. C. Shields, Benchmark structures and binding energies of small water clusters with anharmonicity corrections, J. Phys. Chem. A, 2011, 115(43), 12034–12046 CrossRef CAS PubMed.
- M. J. Frisch, G. W. Trucks, H. B. Schlegel, G. E. Scuseria, M. A. Robb, J. R. Cheeseman, G. Scalmani, V. Barone, B. Mennucci, G. A. Petersson, H. Nakatsuji, M. Caricato, X. Li, H. P. Hratchian, A. F. Izmaylov, J. Bloino, G. Zheng, J. L. Sonnenberg, M. Hada, M. Ehara, K. Toyota, R. Fukuda, J. Hasegawa, M. Ishida, T. Nakajima, Y. Honda, O. Kitao, H. Nakai, T. Vreven, J. A. Montgomery Jr, J. E. Peralta, F. Ogliaro, M. Bearpark, J. J. Heyd, E. Brothers, K. N. Kudin, V. N. Staroverov, R. Kobayashi, J. Normand, K. Raghavachari, A. Rendell, J. C. Burant, S. S. Iyengar, J. Tomasi, M. Cossi, N. Rega, J. M. Millam, M. Klene, J. E. Knox, J. B. Cross, V. Bakken, C. Adamo, J. Jaramillo, R. Gomperts, R. E. Stratmann, O. Yazyev, A. J. Austin, R. Cammi, C. Pomelli, J. W. Ochterski, R. L. Martin, K. Morokuma, V. G. Zakrzewski, G. A. Voth, P. Salvador, J. J. Dannenberg, S. Dapprich, A. D. Daniels, Ö. Farkas, J. B. Foresman, J. V. Ortiz, J. Cioslowski and D. J. Fox, Gaussian 09 Revision D.01, Gaussian Inc., Wallingford CT, 2009 Search PubMed.
| This journal is © The Royal Society of Chemistry 2022 |