
 Open Access Article
 This Open Access Article is licensed under a Creative Commons Attribution-Non Commercial 3.0 Unported Licence
Unveiling ultrafast dynamics in bridged bimetallic complexes using optical and X-ray transient absorption spectroscopies†
Michael W.
Mara
 *ab,
Brian T.
Phelan
a,
Zhu-Lin
Xie
a,
Tae Wu
Kim
a,
Darren J.
Hsu
b,
Xiaolin
Liu
c,
Andrew J. S.
Valentine
c,
Pyosang
Kim
ab,
Xiaosong
Li
c,
Shin-ichi
Adachi
de,
Tetsuo
Katayama
fg,
Karen L.
Mulfort
*a and
Lin X.
Chen
*ab
*ab,
Brian T.
Phelan
a,
Zhu-Lin
Xie
a,
Tae Wu
Kim
a,
Darren J.
Hsu
b,
Xiaolin
Liu
c,
Andrew J. S.
Valentine
c,
Pyosang
Kim
ab,
Xiaosong
Li
c,
Shin-ichi
Adachi
de,
Tetsuo
Katayama
fg,
Karen L.
Mulfort
*a and
Lin X.
Chen
*ab
aChemical Sciences and Engineering Division, Argonne National Laboratory, Lemont, Illinois 60437, USA. E-mail: mulfort@anl.gov
bDepartment of Chemistry, Northwestern University, Evanston, Illinois 60208, USA. E-mail: michael.mara@northwestern.edu; l-chen@northwestern.edu
cDepartment of Chemistry, University of Washington, Seattle, Washington 98195, USA
dInstitute of Materials Structure Science, High Energy Accelerator Research Organization (KEK), 1-1 Oho, Tsukuba, Ibaraki 305-0801, Japan
eDepartment of Materials Structure Science, School of High Energy Accelerator Science, The Graduate University for Advanced Studies, 1-1 Oho, Tsukuba, Ibaraki 305-0801, Japan
fJapan Synchrotron Radiation Research Institute, Kouto 1-1-1, Sayo, Hyogo 679-5198, Japan
gRIKEN SPring-8 Center, 1-1-1 Kouto, Sayo, Hyogo 679-5148, Japan
First published on 21st January 2022
Abstract
In photosynthetic systems employing multiple transition metal centers, the properties of charge-transfer states are tuned by the coupling between metal centers. Here, we use ultrafast optical and X-ray spectroscopies to elucidate the effects of metal–metal interactions in a bimetallic tetrapyridophenazine-bridged Os(II)/Cu(I) complex. Despite having an appropriate driving force for Os-to-Cu hole transfer in the Os(II) moiety excited state, no such charge transfer was observed. However, excited-state coupling between the metal centers is present, evidenced by variations in the Os MLCT lifetime depending on the identity of the opposite metal center. This coupling results in concerted coherent vibrations appearing in the relaxation kinetics of the MLCT states for both Cu and Os centers. These vibrations are dominated by metal–ligand contraction at the Cu/Os centers, which are in-phase and linked through the conjugated bridging ligand. This study shows how vibronic coupling between transition metal centers affects the ultrafast dynamics in bridged, multi-metallic systems from the earliest times after photoexcitation to excited-state decay, presenting avenues for tuning charge-transfer states through judicious choice of metal/ligand groups.
Introduction
Natural photosynthetic systems utilize multiple precisely-arranged chromophores to facilitate long-range electron transfer networks that cooperatively work to absorb photons, generate long-lived charges, and oxidize water molecules. Inspired by such designs in nature, many artificial photosynthetic systems have been constructed to achieve photoinduced sequential, unidirectional and long-distance electron transfer for simultaneous oxidation and reduction reactions at both ends of the charge-transfer chain.1–6 Transition metal complexes (TMCs) have been used as building blocks in artificial photosynthetic systems to function as light sensitizers and catalytic centers for converting sunlight to electricity and fuels. The latter process frequently involves transformation of natural resources, such as water and carbon dioxide, to hydrogen and hydrocarbons, requiring multiple redox equivalents. Thus, connecting mostly single photon events in light absorption to photocatalytic reactions has been a key challenge in solar fuel generation. One strategy is to build a complete photoredox cycle with two or more metal centers acting cooperatively with the optimal sequence of events in both time and space. Metal-to-ligand and ligand-to-metal charge-transfer (MLCT, LMCT) excited states are particularly active in electron transfer towards the conversion of light to electricity or chemical fuels due to their capability in separating holes and electrons and directing them to catalytic centers.Despite the importance of the TMC excited states, their trajectories on excited-state potential energy surfaces (PESs) are still unclear and under-investigated, particularly in terms of transient nuclear geometry and the corresponding electron density shifts at the earliest stage after their creation. Knowledge limited to the thermally equilibrated energetics of the excited states is insufficient to predict the outcome of photochemical reactions; instead, a complete TMC excited-state charge-transfer trajectory must include interplays of electronic and nuclear motions before thermalization. Such interplays have been investigated experimentally using femtosecond optical pump-probe spectroscopy to probe the motion of coherent vibrational wavepackets.7–11 However, the results from optical studies alone can be convoluted since multiple TMC moieties in the systems often have overlapping absorption spectra in the ground and excited states. X-ray transient absorption (XTA) spectroscopy using femtosecond X-ray pulses generated at X-ray free electron laser (XFEL) sources can probe local electronic and nuclear structures of the metal centers with elemental specificity and sub-picosecond time resolution. Thus, XTA provides detailed excited-state structural information of the individual transition metal centers on the time scale of charge transfer and vibrational motion, yielding a more complete picture of the TMC excited-state PES.
Recently, several studies have focused on using transient X-ray methods to directly probe the nuclear vibrational motion and their impacts on electronic structures of TMCs towards further understanding their PESs.12–16 The majority of these focused on monometallic TMCs, while many natural and artificial photosynthetic systems require multiple metal-centered building blocks linked via bridging groups to perform light-harvesting and catalytic functions. The bridging ligands additionally can play an important role in coupling between the metal centers, as a site for charges to reside during electron or energy transfer between metal centers, and to manipulate the charge-separation mechanism (e.g., sequential or superexchange versus Dexter or through-bond transfer.) Therefore, key aspects of multiple transition metal systems were not addressed in previous studies, including electronic coupling between the metal centers and the effect of the bridging groups on the early-time charge-transfer dynamics, necessitating the investigation of simple molecular systems employing two or more metal centers. Some examples are complexes utilizing the tetrapyrido[3,2-a:2′,3′-c:3′′,2′′-h:2′′′,3′′′-j] phenazine (tpphz) ligand, originally reported by Knapp et al.17 and Bolger et al.18,19 The tpphz ligand fosters directional charge transfer through a lower energy intra-ligand charge-transfer (ILCT) state, enabling metal-to-metal charge transfer (MMCT) in (bpy)2Os(II)-tpphz-Ru(II)(bpy)2 (bpy = 2,2′-bipyridine),20,21 (bpy)2Co(III)-tpphz-Ru(II)(bpy)2,22 (tbbpy)2Ru(II)-tpphz-Rh(I)(Cp*)Cl (Cp* = pentamethylcyclopentadienyl, tbbpy = 4,4′-di-tert-butyl-2,2′-bipyridine),23 and (mesPhen)Cu(I)-tpphz-Ru(II)(bpy)2 (mesPhen = 2,9-dimesityl-1,10-phenanthroline, abbreviated CuRu) complexes.24 These studies mostly focused on the ILCT and MMCT processes, which occur on the ps time scale, with no emphasis on the sub-ps dynamics. Bimetallic complexes bridged by tpphz present an excellent opportunity to investigate how electronic coupling between metal centers and ligands can tune excited-state energetics, dynamics, pathways, and ultimately photocatalytic outcomes.
Here, we investigate the ultrafast excited-state dynamics of (bpy)2Os(II)-tpphz-Cu(I)(mesPhen) (OsCu) along with its derivatives using optical transient absorption (OTA) and XTA spectroscopies. We hypothesize that (1) the excited-state Os(II) moiety could be influenced by the connection with the Cu(I), (2) a possible hole transfer may occur from the MLCT state of Os(II) center to Cu(I) center, similar to that observed previously in CuRu,24 and (3) the tpphz may play an important role in electronic coupling between the metal centers. Using OTA in conjunction with XTA, we investigated the ultrafast dynamics of the Cu and Os MLCT states, with the element-specific nature of XTA serving to disentangle the properties of the two metals centers. Probing the photogenerated vibrational wavepackets reveals how this vibrational coupling is tuned by the metal centers and the bridging ligand. These studies demonstrate how metal centers can be coupled via ligand design to enhance or attenuate desirable metal–metal interactions, paramount in the rational design of TMCs optimized for application in photosynthesis and photocatalysis.
Experimental
Synthesis
The synthesis of CuOs was achieved in a similar method for the synthesis of the previously reported CuRu complex.24 Full details and structural characterization were recently reported by our group elsewhere.25 Briefly, starting from [Os(bpy)2Cl2], reaction with 1,10-phenanthroline-5,6-dione (phendione) followed by counterion exchange yielded [Os(bpy)2(phendione)](PF6)2. This intermediate was used in a condensation reaction with 5,6-diamino-1,10-phenanthroline and produced the tpphz-ligated complex [Os(bpy)2(tpphz)](PF6)2. Lastly, the Cu(I) center was installed by the HETPHEN approach26–29 where [Os(bpy)2(tpphz)](PF6)2 was treated with one equivalent of [Cu(mesPhen)(CH3CN)2](PF6), generating the target complex CuOs.Optical transient absorption spectroscopy
Femtosecond optical transient absorption spectroscopy (OTA) experiments were performed as described previously, with time resolution of ∼500 fs.30,31 Impulsive stimulated Raman scattering (ISRS) experiments with a 540 nm pump were performed using a previously-reported11 regeneratively-amplified Ti:sapphire laser system (Solstice Ace, Spectra-Physics) outputting a 10 kHz train of 800 nm, 35 fs, 0.65 mJ pulses. The fundamental was split using a 50% reflective beamsplitter to pump two laboratory-constructed non-collinear optical parametric amplifiers (NOPA). The reflected portion was used to generate the pump pulse, centered at 540 nm with about 30 nm full-width at half-maximum (FWHM) and compressed using a fused-silica prism compressor to about 35 fs. The transmitted portion was used to generate the probe pulse, centered at 580 nm with about 100 nm FWHM and compressed using the multiphoton intrapulse interference phase scan method with a spatial light modulator (MIIPSBox640, Biophotonics Solutions) to about 10 fs at the sample position. The pump polarization was set to 54.7° (magic angle) with respect to that of the probe with 50 nJ per pulse at the sample. The pump was chopped at 200 Hz using a mechanical chopper and the probe was directed along an optical delay stage (ILS300LM, Newport) to vary the pump-probe time delay. The probe and signal were detected with a spectrograph coupled with a EMCCD camera (Shamrock/Newton, Andor) using a laboratory-written LabVIEW program (National Instruments). The instrument response was measured to be less than 40 fs by cross correlation in a 5 μm BBO crystal (United Crystals Inc.) placed at the sample position.ISRS measurements with a 640 nm pump were performed using a Yb:KGW regenerative amplifier (Light Conversion, Pharos-10 W) generating 1030 nm fundamental pulses at 10 kHz repetition rate with a pulse width of 200 fs. The fundamental beam was split into two pulses using a 90/10 beam splitter to produce a visible pump and a broadband probe pulse. The high-power beam pumped a laboratory-built NOPA to generate the pump pulses centered at 640 nm with 25 nm bandwidth.32 The pump pulses were compressed with a chirped mirror pair (Laser Quantum, DCM-12) and a fused silica wedge pair (Newport) to 32 fs FWHM at the sample position, which was characterized by second harmonic generation frequency-resolved optical gating (SHG-FROG) with a 5 μm thick Beta Barium Borate (BBO) crystal (United Crystals Inc.). For broadband probe, the low-power beam was focused in a 3 mm thick YAG window (EKSMA) by a 10 cm plano-convex lens to generate a white light continuum (WLC) spanning 520–850 nm. The WLC was subsequently compressed by a chirped mirror pair (Laser Quantum, DCM-9). The pump and probe beams were focused on the sample in a 1 mm pathlength quartz cuvette using a 25 cm concave mirror. The optical time delay between pump and probe pulses was controlled by a motorized linear stage (Newport, XMS160-S). To measure the TA spectra, the “pump-on” and “pump-off” probe spectra were obtained using a chopper operating at 500 Hz and detected with a spectrometer (Andor, Kymera 328i) and a sCMOS camera (Andor, Zyla-5.5). The TA measurements were carried out with the pump polarization set to 54.7° with respect to the probe polarization to eliminate polarization-dependent signals.
Nanosecond transient absorption spectroscopy (nsTA) experiments were performed using a previously-reported regeneratively-amplified Nd:YAG laser system with an optical parametric generator (PL2210/PG403, Ekspla) coupled with a supercontinuum laser (STM-1-UV, Leukos).24 The 1 kHz fundamental of the amplifier was frequency-tripled internally and the repetition rate was down counted yielding a 500 Hz train of 355 nm, 25 ps, 300 μJ pulses that pumped the optical parametric generator, tuned to output 500 or 625 nm, 25 ps, 20–50 μJ pump pulses. The pump pulses were focused to about 200 μm diameter at the sample with about 200–1000 nJ per pulse. The supercontinuum laser, triggered by the 1 kHz master clock from the amplifier, output a 1 kHz train of broadband (400–1600 nm), 600 ps, 15 μJ probe pulses. A 950 nm shortpass filter was used to filter the residual fundamental (1064 nm) from the probe pulses, which were then focused to about 150 μm diameter at the sample. The probe and signal were collimated and focused into a 2150i Acton series spectrograph (Princeton Instruments) coupled with a Spyder3 SG-14 CCD camera (Teledyne Dalsa). Three DG535 digital delay generators (Stanford Research Systems), triggered by the 1 kHz master clock from the amplifier, adjusted the timing of the supercontinuum probe and triggered the camera. The probe spectra and transient signal were recorded and calculated using a laboratory-written program (LabVIEW 2014, National Instruments). The transient spectra were collected by averaging signal for a total of 1.5–4 s per time delay.
X-ray transient absorption spectroscopy
The ultrafast XTA experiments were performed in an XFEL facility at BL3 (ref. 33) of SACLA, Japan34 using the SPINNETT system35 and the total fluorescence detection scheme. The XFEL beam was monochromatized by two Si(111) channel-cut crystals with a (+, −, −, +) geometry and focused down by Be compound refractive lenses.36CuOs was dissolved in nitrogen-purged acetonitrile at 10 mM concentration and flowed as a smooth liquid jet through a ∼100 μm diameter nozzle in a liquid circulating system. The laser pump pulse (at 500 or 625 nm) was adjusted to spatially and temporally overlap with the X-ray probe pulse. The laser pulses were generated by a Ti:sapphire laser system coupled with an optical parametric amplifier (HE-TOPAS, Coherent), to induce the MLCT transitions of the Cu or Os center. To determine the optimal pump laser pulse energy for the highest possible excited-state population with minimal multi-photon processes, “power titration” scans (signal intensity vs. laser pulse energy) were performed and a pulse energy of 14 μJ was chosen (Fig. S1†). The arrival timing between the X-ray and optical pulses was recorded using the timing diagnostics based on the X-ray beam splitting scheme.37,38 In the jitter correction, an interval bin width of 50 fs was used. The overall experimental time resolution was evaluated to ∼130 fs FWHM by a Gaussian fit of the first derivative of Cu K-edge and Os LIII-edge time scans at 8.9865 and 10.871 keV, respectively (Fig. S2†), where the largest transient signal was observed in the difference XANES spectrum.Computational methods
DFT calculations on CuOs were performed using the Gaussian 16 (ref. 39) package. We used the ωB97X-D functional40 with the LanL2DZ effective core potential (ECP) and corresponding basis set41 on Cu and Os atoms and 6-31G(d) on light atoms. The functional was chosen because it is a long-range corrected hybrid density functional and includes dispersion corrections that are important in accurate treatment of charge-transfer states and π–π interactions, respectively.40 Solvent effects (acetonitrile) were considered using the polarizable continuum model (PCM).42 The optimized structures were confirmed as true minima by frequency calculations.Results
UV-vis spectra
The structures and UV-vis spectra of CuOs, OsOs, Cu, and Os are displayed in Fig. 1. Both Cu and Os have pronounced absorption bands centered between 400–500 nm with the Os absorbance coefficient twice that for Cu. Cu has a weak tail extending to 600–650 nm, while Os has a much stronger absorption tail extending past 700 nm. The absorption of CuOs is compared with the sum of the absorption from Os and Cu (Fig. S3†), showing that the CuOs absorption predominantly consists of the sum of the contributions from the individual MLCT bands. Similarly, the absorption of OsOs is compared with the sum of contributions from two Os (Fig. S3†), though in this case the sum of contributions does not reproduce the OsOs spectrum as accurately.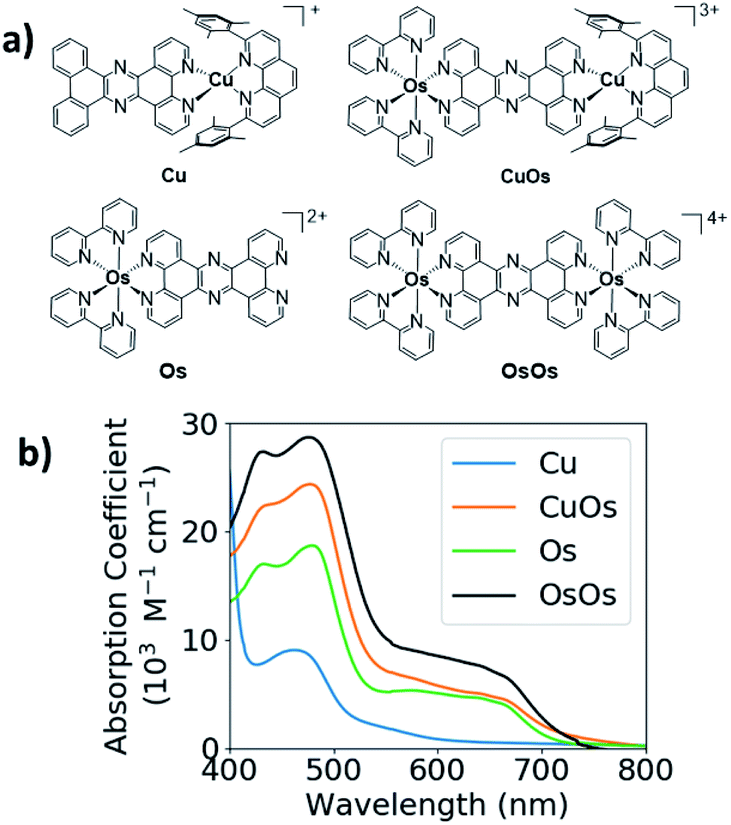 | ||
| Fig. 1 (a) Structures of Os, Cu, CuOs, and OsOs; (b) UV-vis spectra of Os, Cu, and CuOs and OsOs. | ||
Optical transient absorption spectra
OTA measurements with ∼500 fs time resolution were performed on Os, OsOs, and CuOs with excitation at 500 nm and 625 nm. OTA spectra of CuOs with 500 nm excitation are shown in Fig. 2a; the OTA spectra for the other compounds and excitation wavelengths are in the ESI (Fig. S4 to S10†). The CuOs OTA spectra exhibit a strong ground-state bleach (GSB) centered around 490 nm, along with excited-state absorption (ESA) features red of the GSB. Within the 0–10 ps window, these ESA features appear between 575–800 nm, while at later times the onset of the ESA blue-shifts to ∼550 nm. Additionally, when excited at 500 nm, CuOs exhibits ESA centered at 630 nm at time delays less than 10 ps that blue-shifts to 600 nm and decays between 10–100 ps; this feature is not observed in the OTA spectra of any of the Os and OsOs complexes, nor in the CuOs OTA spectra with 625 nm excitation. The time constants for the excited-state dynamics were extracted via global kinetic analysis and are given in Table 1. Global kinetic fitting for all OTA spectra were modelled with the product of a step function and a sum of exponentials convolved with a Gaussian IRF. CuOs is best fit to four components (the first representing two response-limited processes). This kinetics model was used to extract the decay-associated spectra, shown in Fig. 2b. CuOs exhibits a rise time of ∼300 fs (which corresponds to a mixture of 100 and 600 fs components observed in the ISRS experiments, vide infra, but here obscured by the 500 fs Gaussian instrument response). τ3 represents additional blue-shifting of the ESA, while τ4 reflects decay of the ESA centered at 600 nm. Finally, τ5 represents excited-state decay with loss of the GSB. Neither τ1,τ2, nor τ4 are observed in CuOs following 625 nm excitation, nor are they observed in OsOs or Os. The intermediate time constant, τ3 ≈ 2–4 ps, did not vary much among the complexes, though τ5 depended strongly on the presence of a second metal opposite Os, with τ5 ≈ 14 ns in Os (no second metal), 1.3–1.5 ns in CuOs, and 0.3 ns in OsOs.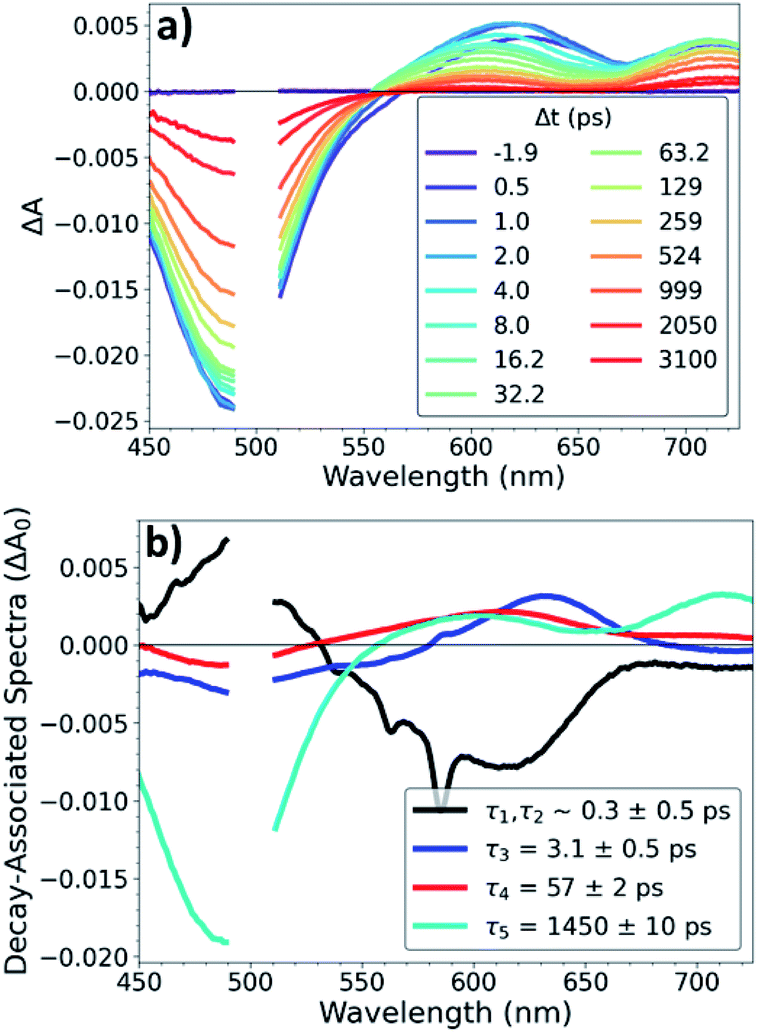 | ||
| Fig. 2 (a) OTA spectra and (b) decay-associated spectra of CuOs following 500 nm excitation. | ||
| Complex (pump wavelength) | τ 1 (ps) | τ 2 (ps) | τ 3 (ps) | τ 4 (ps) | τ 5 (ps) |
|---|---|---|---|---|---|
| a Additional weak components from rotational diffusion, aggregation, or small impurities; not included here. b From ISRS measurement. c From nsOTA measurements. d Additional long-lived impurity, minor. | |||||
| CuOs (500 nm)d | 0.09 ± 0.05b | 0.63 ± 0.05b | 2.7 ± 0.4 | 49 ± 7 | 1540 ± 90 |
| CuOs (625 nm)d | — | — | 2.4 ± 0.4 | — | 1240 ± 90 |
| Os (500 nm)a | — | — | 2.8 ± 0.4 | — | 14![[thin space (1/6-em)]](https://www.rsc.org/images/entities/char_2009.gif) 780 ± 50c 780 ± 50c |
| Os (625 nm)a | — | — | 3.1 ± 0.3 | — | 14000 ± 400c |
| OsOs (625 nm)d | — | — | 1.7 ± 0.4 | — | 297.2 ± 0.8 |
To investigate the interplays between the electron-nuclear motions in the TMC excited states, we searched for vibrational motions that may transiently distort nuclear structures and cause consequent electronic perturbations. In a molecular ensemble of TMCs, such vibrational motions could only be captured using femtosecond laser pulses much shorter than the vibrational periods to trigger the excited-state formation and probe the molecular responses. In order to characterize vibrational modes that are active in the excited state, ISRS measurements were performed. Subtracting the population dynamics revealed oscillatory signals in the fit residuals that presumably arise from coherent wavepacket motions. Following excitation at 540 nm, the CuOs spectra and residuals are shown in Fig. S11 and S12,† respectively, and the Fourier transform of the residuals are shown in Fig. 3; time constants are shown in Table S1.† Time constants of ∼100 and 600 fs are observed, which appeared as a ∼300 fs rise in the OTA spectra in Fig. 2. The Fourier transform power spectra of the residual signals revealed multiple vibrational modes as a result of photoexcitation, including a ∼50 cm−1 component observed near 600 nm and ∼240 and ∼430 cm−1 components observed from less than 575 nm to 650 nm (with nodes between 610–620 nm). All peaks have widths of ∼25–30 cm−1 FWHM. Additional ISRS measurements were performed using a 640 nm pump, but no vibrational coherence signals were observed that could be assigned to CuOs. The detailed assignments for some of these modes will require additional data from XTA and quantum mechanical calculations as described below.
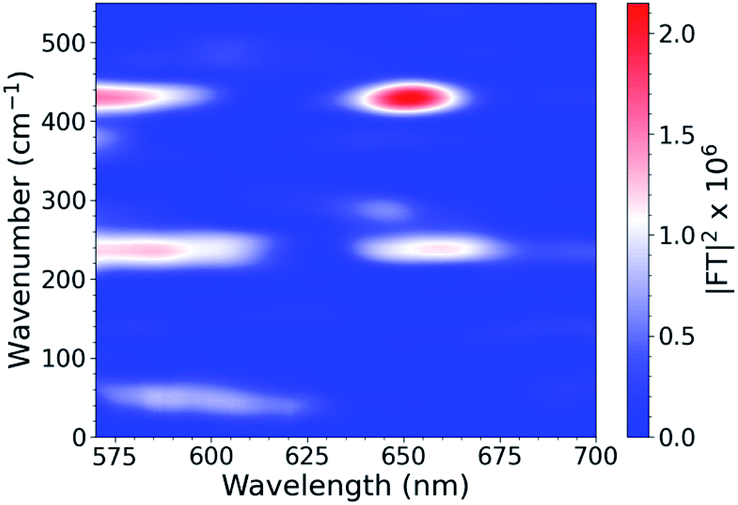 | ||
| Fig. 3 ISRS spectra of CuOs following 540 nm excitation. | ||
X-ray transient absorption spectra
Cu K-edge XANES and XTA spectra of CuOs following 500 nm excitation are shown in Fig. 4a. Like in similar Cu(I) bis-phenanthroline complexes, 1s → 4p electronic transitions are observed on the rising edge between 8.986–8.988 keV.43 Upon photoexcitation, a depletion in the rising edge intensity is observed, reflecting a shift in the edge to higher energy as Cu(II) species forms as a result of the MLCT transition. This shift coincides with a slight increase in intensity at ∼8.978 keV, which reflects the appearance of a quadrupole-allowed 1s → 3d transition that is only present in the Cu(II) 3d9 species. Similar spectral changes are observed with 625 nm excitation (Fig. S13†), albeit with much weaker XTA signals reflecting a low but non-zero absorption coefficient of the Cu MLCT band at longer wavelengths. The Os LIII-edge (Fig. 4b) consists of 2p → 5d dipole-allowed transitions. Photoexcitation at 500 nm induces a shift in the white line (10.875 keV) to higher energy, along with the appearance of a new 2p → 5d transition on the rising edge at ∼10.871 keV. Similar to Cu, excitation at 625 nm produced comparable difference signals at the Os LIII edge (Fig. S13†).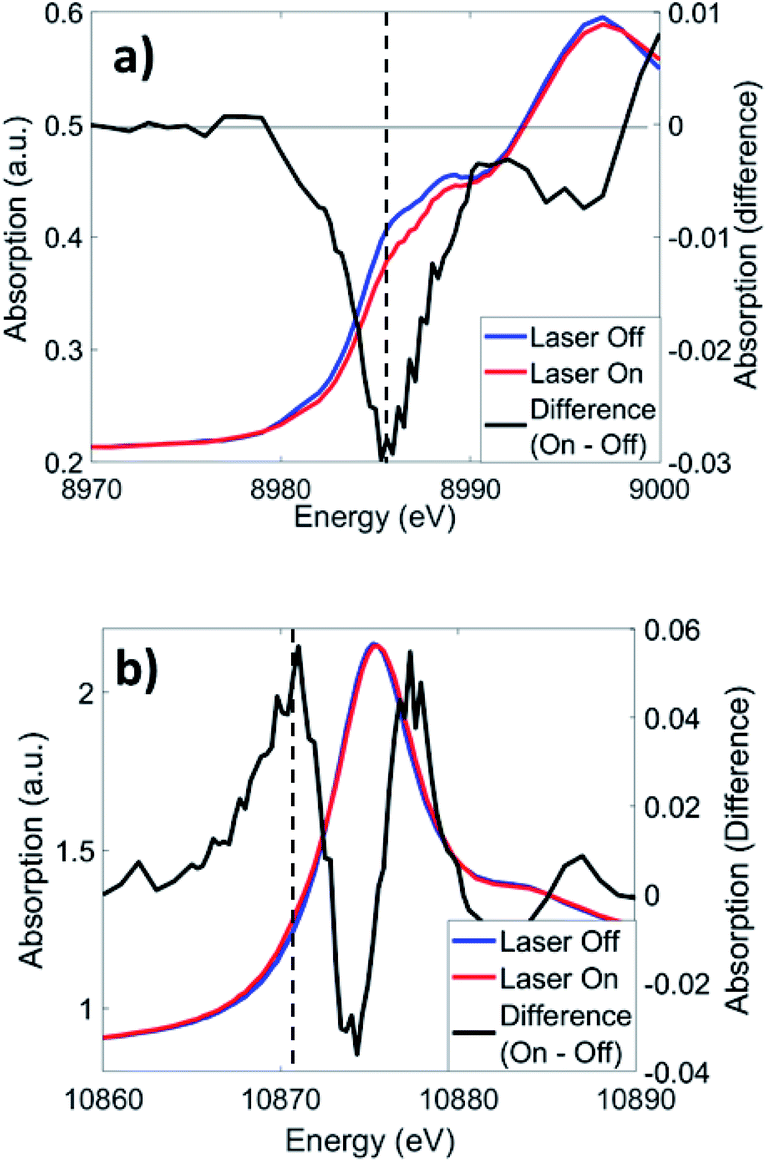 | ||
| Fig. 4 XTA spectra of CuOs at the (a) Cu K-edge and (b) Os LIII-edge at 2 ps and 0.7 ps time delays, respectively, following 500 nm excitation. Dotted lines indicate the energies used for kinetics traces in Fig. 5. | ||
The MLCT state rise and decay kinetics were measured at X-ray photon energies corresponding to the maximal difference signals at the Cu K-edge (8.986 keV, negative) and Os LIII-edge (10.871 keV, positive) (Fig. 5a). Kinetics were fit with a sequential triexponential function convolved with a Gaussian instrument response function of 130 fs FWHM (Fig. S2†), with the response accounting for the response-limited portion of the rise. The longest decay time constant (τ3) was fixed to the excited-state decay constant extracted from kinetic traces with ∼150 ps range (Fig. S14†). Fit parameters are given in Table 2. The longer rise of the difference signals for Cu and Os have similar time constants of 0.42 and 0.46 ps respectively, followed by decay time constant of 0.71 and 0.83 ps, respectively. The excited-state decay constant of 49 ps at the Cu K-edge is comparable to τ4 in the femtosecond OTA measurements of CuOs upon 500 nm photoexcitation. The longest excited-state decay constant observed at the Os LIII-edge in the experimental time window is much longer than the 150 ps range collected, consistent with τ5 from the OTA measurements. A more detailed analysis of the dynamics is presented in the Discussion.
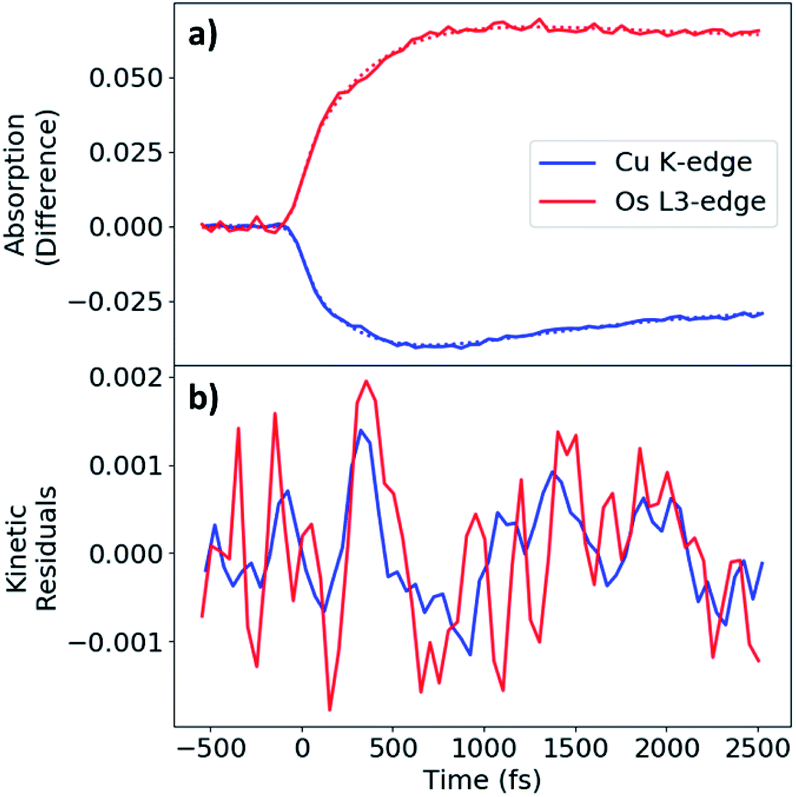 | ||
| Fig. 5 (a) Kinetics traces for CuOs measured at Cu K (8.986 keV, blue) and Os LIII (10.871 keV, red) edges. Experimental data and fits shown as solid and dotted lines, respectively. (b) Filtered kinetic residuals, with Os residual inverted for comparison. | ||
| τ 1 (ps) | A 1 | τ 2 (ps) | A 2 | τ 3 (ps) | A 3 | |
|---|---|---|---|---|---|---|
| a Cu and Os kinetic preexponential factors have different signs to account for the negative and positive difference signals, respectively. | ||||||
| Cu | 0.42 | 0.087 | 0.71 | −0.075 | 50 | −0.029 |
| Os | 0.46 | −0.086 | 0.83 | 0.044 | ≫150 | 0.063 |
During the experimental data acquisition, we noticed certain features in the rise of both the Cu and Os kinetics that would not fit adequately with multiple exponential functions in the time delay range of 200–600 fs. These “kink”-looking features were reproduced in different sets of data taken on different days and at both Cu K-edge and Os LIII-edge signals. After subtraction of the fit traces, the residuals of the data, shown in Fig. 5b, revealed that the “kink”-looking features were actually weak oscillatory signals at both the Cu and Os edges. Note that the sign of the Os residuals in Fig. 5b are sign flipped to facilitate comparison. The positive signal at the Os L3-edge originated from the vacant 5d orbital in Os(III) to enable an additional 2p to 5d transition, while the negative signal at the Cu K-edge reflects the formation of the Cu(II) species as the ground state Cu(I) species depletes. Thus, the increase of the Os(III) and decrease of Cu(I) residuals at 300 fs delay time reflect decreased electron density at both metal centers. Conversely, the decrease of the Os(III) signal and increase of the Cu(I) signal at ∼600 fs delay time reflect the gain of electron density at both metal centers. Thus, the depletion and gain of the electron density for both metal centers are in phase. The Cu residuals are modelled by a damped sine function corresponding to a vibrational mode with a frequency of ∼40 cm−1, as shown in Fig. 6a below (fit parameters in Table S2†).
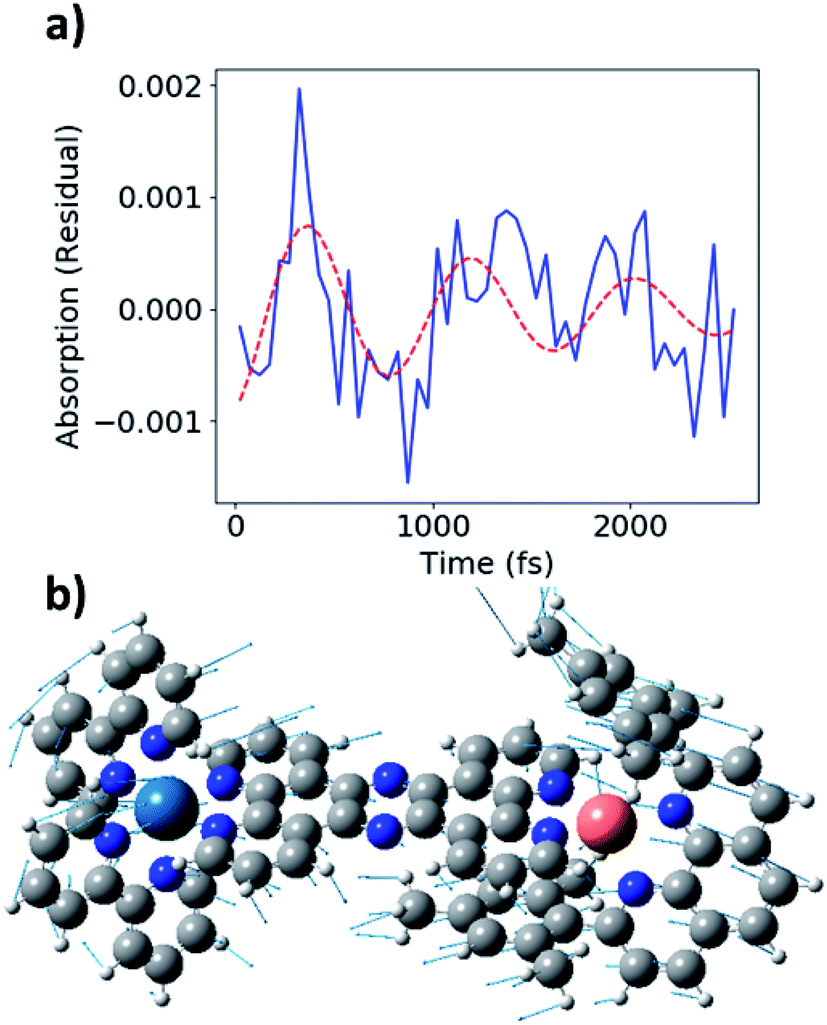 | ||
| Fig. 6 (a) Fit of Cu K-edge residual (blue) with ∼40 cm−1 damped sine function (red, dashed). (b) Image of 58 cm−1 vibrational mode from DFT calculations. | ||
Discussion
Tuning of MLCT lifetimes through metal–metal coupling
The UV-vis spectra of Cu and CuOs have absorption bands centered around 400–500 nm, with Os and CuOs exhibiting an additional band in the 550–700 nm region and tailing past 700 nm. The 400–500 nm band is assigned as various transitions to 1MLCT states, analogous to that observed for [Cu(dmp)2]+ (dmp = 2,9-dimethyl-1,10-phenanthroline),44 while the 550–700 nm band in the Os-containing complexes is assigned as direct excitation to 3MLCT states.20,21,45 There is little to no ground-state electronic coupling between the Cu and Os building blocks in CuOs, which is demonstrated by the sum of the Cu and Os absorption spectra reproducing the CuOs absorption spectrum well (Fig. S3†). This agrees with the similar Os redox potentials between OsOs and CuOs from cyclic voltammetry (Fig. S15 and Table S3†). Curiously, the UV-vis of OsOs is more poorly reproduced by the sum of two Os contributions, so ground-state electronic coupling may be more prominent in that case.The appearance of the pre-edge feature in the Cu K-edge XTA spectrum indicates the transient formation of Cu(II), as does the increase in edge energy, which has been assigned as a net oxidation of the Cu center in numerous XTA measurements on Cu bis-phenanthrolines.44,46–49 The Os LIII-edge XTA difference signal is also consistent with transient oxidation of the Os(II) center. The Os center in the ground state complex is Os(II) low-spin in a nominally octahedral coordination symmetry with filled t2g orbitals. Photoexcitation of the Os center removes one of these electrons, enabling a new absorption band into the t2g hole, as was observed in the Os LIII-edge XTA of a similar Os complex.50 Both the Cu K-edge and Os LIII-edge XTA spectra are consistent with net oxidation of the metal centers from MLCT excitation.
The excited-state lifetimes for Os, CuOs, and OsOs are given in Table 1. τ5 corresponds to decay of the Os 3MLCT state, consistent with the long lifetime observed in the Os LIII-edge kinetics. Addition of a second transition metal center to Os reduces the lifetime from 14 ns to 1.5 ns for CuOs and 300 ps for OsOs. While the UV-vis spectra show minimal electronic coupling in the ground state, these results demonstrate the dependence of the excited-state lifetime on the presence of this additional metal center, suggesting stronger coupling in the excited state. A similar decrease in excited-state lifetime was observed upon the addition of Pd to Ru-tpphz.51 MO diagrams of the HOMO, LUMO, and LUMO+1 are shown in Fig. S16.† Both the LUMO and LUMO+1 reflect significant electron delocalization across the bridging tpphz ligand. Regardless of the sample or excitation wavelength, an intermediate component is observed in the OTA with a lifetime of τ3 ≈ 2–4 ps, which is consistent with ILCT previously observed in both Ru/Os tpphz20 and Cu/Ru tpphz complexes.24 Therefore, at early times, regardless of which metal charge-transfer state is excited, the MLCT electron becomes delocalized across the tpphz ligand, spanning the distance of the Cu and Os centers, within a few ps. This delocalization facilitates Cu/Os coupling; most likely, the interactions between the two metal centers increase spin–orbit coupling, resulting in faster Os 3MLCT decay when a second heavy metal is present.
Importance of kinetic factors in excited-state electron transfer
Cyclic voltammetry indicates that there is 360 mV driving force for hole transfer from the Os(III) in the Os-centered MLCT state to the Cu(I) center. Therefore, CuOs should exhibit MMCT upon photoexcitation of the Os MLCT state, similar to that exhibited for CuRu, where MMCT occurred on the timescale of 10s of picoseconds.24 For CuRu and CuOs, elucidating MMCT pathways from OTA data is difficult due to the largely overlapping signals from the MLCT states. CuRu exhibited a <100 ps decay in the Ru MLCT state measured by XTA, limited by the time resolution of the synchrotron source of the previous study. Despite the previous experimental limitations, this process correlated directly with a rise in the Cu(II) species, indicating that the hole transferred from Ru(III)* to Cu(I). While the driving force for the analogous hole transfer from the MLCT state of the Os center in CuOs is approximately the same as that for some of the investigated CuRu complexes, there are no anticorrelated time constants in the Cu and Os XTA kinetics. The lack of anticorrelated dynamics suggests that no significant population of an MMCT state is ever formed in the delay time window of the experiment.In tetrahedral Cu(I) complexes, including Cu bis-phenanthrolines and the heteroleptic complex studied here, the Cu MLCT lifetime is shortened by solute–solvent interactions, particularly in coordinating solvents.44 The CuRu complex that exhibited MMCT24 had methyl-substituents at the 3,6-tpphz positions, which hindered solute–solvent interactions, resulting in a >1 ns excited-state lifetime. However, the Cu(I) center in CuOs has only H atoms at these positions, so it is prone to rapid quenching by acetonitrile, resulting in a short Cu excited-state lifetime and relaxation back to the ground state on or faster than the time scale of MMCT. With 500 nm excitation, CuOs exhibits a time constant τ4 ≈ 60 ps which is not observed with 625 nm excitation, or in any complex without a Cu center. This is consistent with the ∼50 ps time constant observed in the Cu K-edge kinetics. That this component was observed only with 500 nm excitation, where a mixture of Cu and Os MLCT excitation occurs, suggests that this corresponds to decay of the Cu MLCT state. A lifetime of 60 ps is consistent with that observed for 2,9-unsubstituted (mesPhen)Cu(I)-tpphz and (mesPhen)Cu(I)-tpphz-Cu(I)(mesPhen) complexes in acetonitrile.24
There are two likely possibilities for the absence of MMCT in CuOs. First, it is possible the MMCT is too slow to occur before the Os excited state decays back to the ground state. Second, it is possible that MMCT does occur, but only accumulates a small population that is limited by the short Cu excited-state lifetime, analogous to the mixed Cu-tpphz-Cu complex with methyl substituents near one Cu and H substituents near the second Cu (CuH2–CuMe2 from ref. 24). It is difficult to determine which of these two scenarios occurs, but given the similar redox properties to the CuRu and mixed Cu-tpphz-Cu complexes, it seems likely that the Cu center relaxes too quickly for the MMCT process to be observed spectroscopically in CuOs.
Concerted vibrational motions in Cu and Os MLCT states
Excited-state vibrational coherences have been observed in copper bis-phenanthroline complexes, with the observed Raman features corresponding to low frequency normal modes involving the typical structural relaxation that occurs in the excited state, namely Cu–N bond contraction and pseudo Jahn–Teller flattening distortion.15,52,53 As discussed above, ISRS measurements reveal low frequency vibrational modes of 50, 240, and 430 cm−1. Normal mode analysis on the ground-state potential energy surface indicates that these features likely correspond to similar structural relaxation processes, specifically M–N bond contraction for the 50 and 240 cm−1 features and contraction of the aromatic core of the phenanthroline moieties in the tpphz bridging ligand for 430 cm−1 (Fig. S17–S19†). The 430 cm−1 mode is comparable to that observed in a similar Ru-tpphz-Pd complex.51 Additionally, the M–N bond contraction modes are delocalized across the entire molecule and involve in-phase M–N contraction at both the Cu and Os centers. While only one of the two metal centers is formally excited with absorption of a single photon, the nature of these normal modes suggests that the two metal centers undergo correlated dynamics in the first 1–2 ps driven by delocalized vibrations coupled to the distinct Cu and Os MLCT transitions. Since vibrational coherence was not observed when using the 640 nm pump, it is possible that the vibrational modes detected optically (Fig. 3) specifically reflect Cu-centered structural distortions (e.g. phen rocking or flattening motions). Alternatively, the Cu MLCT state may act as a reporter for the delocalized M–N contraction modes where the Cu–N bonds and Os–N bonds oscillate with the same frequency.The OTA measurements of Os, OsOs, and CuOs all exhibited drastically different excited-state lifetimes, varying over two orders of magnitude. Because the longest observed transient signal corresponds to the Os 3MLCT state, this suggest that communication between the Os center and the metal opposite it (if present) greatly affects the Os excited-state decay. The XTA kinetics exhibit a comparable, biphasic rise observed at both the Cu K- and Os LIII-edges, further suggesting that the metal center dynamics are intertwined. Both a response-limited and an ∼400 fs rise time are observed in the XTA kinetics at both metal centers. The response-limited rise reflects the oxidation of the metal centers upon MLCT excitation, manifesting as a blue shift at the Cu K- and Os LIII-edges, as well as the growth of a t2g feature in the latter. As the 400 fs component is not observed in the OTA, it reflects changes centered on the metals themselves. Effective oxidation of the metal centers by MLCT excitation will result in changes in metal–ligand bond distance, as demonstrated in previous ps-resolution XTA measurements on Cu,48 and Os,50 and the 400 fs rise time is tentatively assigned as such bond contraction.
Generally speaking, the rise times observed in XTA that are associated with specific structural changes are equal to the half-periods of the normal modes most related to the structural change occurring in the photoexcited states. In XTA measurements on [Cu(dmp)2]+, an ∼170 fs rise time and corresponding vibrational wavepackets with ∼100 cm−1 frequency were observed on the Cu K rising edge and assigned to Cu–N bond contraction.15 While pseudo Jahn–Teller distortions are also prominent following MLCT photoexcitation, such effects are only clearly observed at the Cu K pre-edge and not on the rising edge as was measured here.15 In another previous ultrafast XTA measurement, we demonstrated that the excited-state rise time was dependent on the substituents of the ligands, increasing by a factor of three when heavy sulfonate groups were appended on the phenanthroline ligands, which lower the frequency of the Cu–N vibrational modes.46
As stated above, the vibrational modes observed in the ISRS measurements involve metal–ligand bond contraction, as well as distortions in the bridging tpphz ligand. In particular, the 50 and 240 cm−1 modes likely represent correlated, in-phase Cu–N and Os–N bond contraction. Both the Cu K-edge and Os LIII-edge XTA kinetics exhibit coherent oscillations consistent with the 50 cm−1 mode observed in the ISRS spectra (Fig. 6a). The Cu and Os oscillations are in-phase (Fig. 5b), consistent with the in-phase metal–ligand contraction predicted in the DFT vibrational mode (Fig. 6b). This vibrational mode, along with the 400 fs rise time observed at each edge, suggest highly correlated Cu and Os dynamics at the earliest times following photoexcitation; the ∼25–30 cm−1 linewidths observed in the ISRS spectra are consistent with the wavepacket dephasing with a time constant of 400 fs, further indicating that the 400 fs rise corresponds to metal–ligand bond contraction. It is worth noting that the 50 cm−1 vibrational mode also consists of tpphz breathing distortions, possibly due to the localization of the MLCT electron on the bridging ligand in the LUMO and LUMO+1. The highly conjugated tpphz ligand serves the role of coupling the two metal centers and tuning the formation of the Cu and Os MLCT states in CuOs. This suggests that coupling metal centers via highly conjugated organic linkers is an avenue for coherent control in complexes containing two or more transition metal centers. These effects may play a major role in biological systems involving multiple transition metals and further investigation is vital towards the rational design of effective transition-metal-based photocatalysts.
Conclusions
Ultrafast electronic and structural dynamics of tpphz-bridged Cu(I)/Os(II) complexes were captured by OTA and XTA measurements during the formation and initial decay of the MLCT states of the two metal centers. Despite favorable redox potentials for the hole transfer from the MLCT state Os(III)*-to-Cu(I), no such process was detected. However, the Os MLCT lifetime exhibited dependence on the identity of the opposite metal center, ranging from >10 ns with no metal present to ∼0.3 ns with a second Os center, suggesting metal–metal coupling in the excited state. XTA measurements show that the MLCT transitions of both Cu(I) and Os(II) centers yields almost the same ∼400 fs rise time, suggesting a correlation between the dynamics of the two metal centers. Furthermore, in-phase vibrational coherence is also evidenced in the time evolution of the XTA signals at both the Cu K- and Os LIII-edges, consistent with oscillations near 50 cm−1 as detected from the ISRS measurements. Similar frequency modes from the normal mode analysis were identified as delocalized vibrations across the tpphz ligand, which coherently controls the metal–metal electronic interactions. These results reveal that metal–metal interactions can be modulated via the bridging ligand over a relatively long distance, and suggests an opportunity to control electronic coupling between metal centers, and thus the excited-state pathways, through judicious choice of the bridging groups.Data availability
The DFT calculated structures are included in the ESI.†Author contributions
L. X. C., K. L. M., and M. W. M. conceived and supervised the project. Z. L. X. synthesized compounds and confirmed structure and purity. M. W. M. performed XTA measurements, analyzed data and wrote the first draft of the manuscript. T. W. K., D. J. H., S. A., T. K. and L. X. C. performed XTA measurements. B. T. P. and P. K. performed OTA/ISRS measurements and analyzed data. X. L. and A. J. S. V. performed DFT calculations under supervision of X. L. B. T. P. and L. X. C. edited manuscript. All authors contributed to manuscript edits.Conflicts of interest
There are no conflicts to declare.Acknowledgements
This work is funded by Chemical, Biological and Geological Sciences Division, Basic Energy Science, Office of Science, the US Department of Energy under contract no. DE-AC02-06CH11357. This research was performed with the approval of the Japan Synchrotron Radiation Research Institute (JASRI; Proposal No. 2019B8022).References
- M. R. Wasielewski, Chem. Rev., 1992, 92, 435–461 CrossRef CAS.
- A. J. Bard and M. A. Fox, Acc. Chem. Res., 1995, 28, 141–145 CrossRef CAS.
- M. W. Kanan and D. G. Nocera, Science, 2008, 321, 1072–1075 CrossRef CAS PubMed.
- X. C. Wang, K. Maeda, A. Thomas, K. Takanabe, G. Xin, J. M. Carlsson, K. Domen and M. Antonietti, Nat. Mater., 2009, 8, 76–80 CrossRef CAS PubMed.
- C. C. L. McCrory, S. H. Jung, J. C. Peters and T. F. Jaramillo, J. Am. Chem. Soc., 2013, 135, 16977–16987 CrossRef CAS PubMed.
- W. J. Ong, L. L. Tan, Y. H. Ng, S. T. Yong and S. P. Chai, Chem. Rev., 2016, 116, 7159–7329 CrossRef CAS PubMed.
- S. Cho, M. W. Mara, X. Wang, J. V. Lockard, A. A. Rachford, F. N. Castellano and L. X. Chen, J. Phys. Chem. A, 2011, 115, 3990–3996 CrossRef CAS PubMed.
- B. C. Paulus, S. L. Adelman, L. L. Jamula and J. K. McCusker, Nature, 2020, 582, 214–218 CrossRef CAS PubMed.
- C. Consani, M. Prémont-Schwarz, A. ElNahhas, C. Bressler, F. vanMourik, A. Cannizzo and M. Chergui, Angew. Chem., Int. Ed., 2009, 48, 7184–7187 CrossRef CAS PubMed.
- P. Kim, M. S. Kelley, A. Chakraborty, N. L. Wong, R. P. Van Duyne, G. C. Schatz, F. N. Castellano and L. X. Chen, J. Phys. Chem. C, 2018, 122, 14195–14204 CrossRef CAS.
- P. Kim, A. J. S. Valentine, S. Roy, A. W. Mills, A. Chakraborty, F. N. Castellano, X. Li and L. X. Chen, J. Phys. Chem. Lett., 2021, 12, 6794–6803 CrossRef CAS PubMed.
- K. Kunnus, M. Vacher, T. C. B. Harlang, K. S. Kjær, K. Haldrup, E. Biasin, T. B. van Driel, M. Pápai, P. Chabera, Y. Liu, H. Tatsuno, C. Timm, E. Källman, M. Delcey, R. W. Hartsock, M. E. Reinhard, S. Koroidov, M. G. Laursen, F. B. Hansen, P. Vester, M. Christensen, L. Sandberg, Z. Németh, D. S. Szemes, É. Bajnóczi, R. Alonso-Mori, J. M. Glownia, S. Nelson, M. Sikorski, D. Sokaras, H. T. Lemke, S. E. Canton, K. B. Møller, M. M. Nielsen, G. Vankó, K. Wärnmark, V. Sundström, P. Persson, M. Lundberg, J. Uhlig and K. J. Gaffney, Nat. Commun., 2020, 11, 634 CrossRef CAS PubMed.
- K. Haldrup, G. Levi, E. Biasin, P. Vester, M. G. Laursen, F. Beyer, K. S. Kjær, T. Brandt van Driel, T. Harlang, A. O. Dohn, R. J. Hartsock, S. Nelson, J. M. Glownia, H. T. Lemke, M. Christensen, K. J. Gaffney, N. E. Henriksen, K. B. Møller and M. M. Nielsen, Phys. Rev. Lett., 2019, 122, 063001 CrossRef CAS PubMed.
- K. S. Kjær, T. B. Van Driel, T. C. B. Harlang, K. Kunnus, E. Biasin, K. Ledbetter, R. W. Hartsock, M. E. Reinhard, S. Koroidov, L. Li, M. G. Laursen, F. B. Hansen, P. Vester, M. Christensen, K. Haldrup, M. M. Nielsen, A. O. Dohn, M. I. Pápai, K. B. Møller, P. Chabera, Y. Liu, H. Tatsuno, C. Timm, M. Jarenmark, J. Uhlig, V. Sundstöm, K. Wärnmark, P. Persson, Z. Németh, D. S. Szemes, É. Bajnóczi, G. Vankó, R. Alonso-Mori, J. M. Glownia, S. Nelson, M. Sikorski, D. Sokaras, S. E. Canton, H. T. Lemke and K. J. Gaffney, Chem. Sci., 2019, 10, 5749–5760 RSC.
- T. Katayama, T. Northey, W. Gawelda, C. J. Milne, G. Vankó, F. A. Lima, R. Bohinc, Z. Németh, S. Nozawa, T. Sato, D. Khakhulin, J. Szlachetko, T. Togashi, S. Owada, S.-i. Adachi, C. Bressler, M. Yabashi and T. J. Penfold, Nat. Commun., 2019, 10, 3606 CrossRef PubMed.
- M. Cammarata, S. Zerdane, L. Balducci, G. Azzolina, S. Mazerat, C. Exertier, M. Trabuco, M. Levantino, R. Alonso-Mori, J. M. Glownia, S. Song, L. Catala, T. Mallah, S. F. Matar and E. Collet, Nat. Chem., 2021, 13, 10–14 CrossRef CAS PubMed.
- R. Knapp, A. Schott and M. Rehahn, Macromolecules, 1996, 29, 478–480 CrossRef CAS.
- J. Bolger, A. Gourdon, E. Ishow and J.-P. Launay, Inorg. Chem., 1996, 35, 2937–2944 CrossRef CAS.
- J. Bolger, A. Gourdon, E. Ishow and J.-P. Launay, J. Chem. Soc., Chem. Commun., 1995, 1799–1800, 10.1039/C39950001799.
- C. Chiorboli, M. A. J. Rodgers and F. Scandola, J. Am. Chem. Soc., 2003, 125, 483–491 CrossRef CAS PubMed.
- C. Chiorboli, C. A. Bignozzi, F. Scandola, E. Ishow, A. Gourdon and J.-P. Launay, Inorg. Chem., 1999, 38, 2402–2410 CrossRef CAS.
- S. E. Canton, K. S. Kjær, G. Vankó, T. B. van Driel, S.-i. Adachi, A. Bordage, C. Bressler, P. Chabera, M. Christensen, A. O. Dohn, A. Galler, W. Gawelda, D. Gosztola, K. Haldrup, T. Harlang, Y. Liu, K. B. Møller, Z. Németh, S. Nozawa, M. Pápai, T. Sato, T. Sato, K. Suarez-Alcantara, T. Togashi, K. Tono, J. Uhlig, D. A. Vithanage, K. Wärnmark, M. Yabashi, J. Zhang, V. Sundström and M. M. Nielsen, Nat. Commun., 2015, 6, 6359 CrossRef CAS PubMed.
- L. Zedler, A. K. Mengele, K. M. Ziems, Y. Zhang, M. Wächtler, S. Gräfe, T. Pascher, S. Rau, S. Kupfer and B. Dietzek, Angew. Chem., Int. Ed., 2019, 58, 13140–13148 CrossRef CAS PubMed.
- D. Hayes, L. Kohler, R. G. Hadt, X. Zhang, C. Liu, K. L. Mulfort and L. X. Chen, Chem. Sci., 2018, 9, 860–875 RSC.
- Z. L. Xie, X. Liu, A. J. S. Valentine, V. Lynch, D. M. Tiede, X. Li and K. L. Mulfort, Angew. Chem., Int. Ed., 2022, 61, e202111764 CAS.
- M. Schmittel and A. Ganz, Chem. Commun., 1997, 999–1000, 10.1039/A701509G.
- M. Schmittel, C. Michel, S.-X. Liu, D. Schildbach and D. Fenske, Eur. J. Inorg. Chem., 2001, 2001, 1155–1166 CrossRef.
- S. De, K. Mahata and M. Schmittel, Chem. Soc. Rev., 2010, 39, 1555–1575 RSC.
- M. Schmittel, L. Ulrich, M. Meder and A. Ganz, Christoph Michel and Markus Herderich, Heterocycl. Commun., 1997, 3, 493–498 CAS.
- S. E. Brown-Xu, M. S. J. Kelley, K. A. Fransted, A. Chakraborty, G. C. Schatz, F. N. Castellano and L. X. Chen, J. Phys. Chem. A, 2016, 120, 543–550 CrossRef CAS PubMed.
- S. Brown-Xu, M. Fumanal, C. Gourlaouen, L. Gimeno, A. Quatela, C. Thobie-Gautier, E. Blart, A. Planchat, F. Riobé, C. Monnereau, L. X. Chen, C. Daniel and Y. Pellegrin, Inorg. Chem., 2019, 58, 7730–7745 CrossRef PubMed.
- A. Grupp, A. Budweg, M. P. Fischer, J. Allerbeck, G. Soavi, A. Leitenstorfer and D. Brida, J. Opt., 2017, 20, 014005 CrossRef.
- K. Tono, T. Togashi, Y. Inubushi, T. Sato, T. Katayama, K. Ogawa, H. Ohashi, H. Kimura, S. Takahashi, K. Takeshita, H. Tomizawa, S. Goto, T. Ishikawa and M. Yabashi, New J. Phys., 2013, 15, 083035 CrossRef.
- T. Ishikawa, H. Aoyagi, T. Asaka, Y. Asano, N. Azumi, T. Bizen, H. Ego, K. Fukami, T. Fukui, Y. Furukawa, S. Goto, H. Hanaki, T. Hara, T. Hasegawa, T. Hatsui, A. Higashiya, T. Hirono, N. Hosoda, M. Ishii, T. Inagaki, Y. Inubushi, T. Itoga, Y. Joti, M. Kago, T. Kameshima, H. Kimura, Y. Kirihara, A. Kiyomichi, T. Kobayashi, C. Kondo, T. Kudo, H. Maesaka, X. M. Maréchal, T. Masuda, S. Matsubara, T. Matsumoto, T. Matsushita, S. Matsui, M. Nagasono, N. Nariyama, H. Ohashi, T. Ohata, T. Ohshima, S. Ono, Y. Otake, C. Saji, T. Sakurai, T. Sato, K. Sawada, T. Seike, K. Shirasawa, T. Sugimoto, S. Suzuki, S. Takahashi, H. Takebe, K. Takeshita, K. Tamasaku, H. Tanaka, R. Tanaka, T. Tanaka, T. Togashi, K. Togawa, A. Tokuhisa, H. Tomizawa, K. Tono, S. Wu, M. Yabashi, M. Yamaga, A. Yamashita, K. Yanagida, C. Zhang, T. Shintake, H. Kitamura and N. Kumagai, Nat. Photonics, 2012, 6, 540–544 CrossRef CAS.
- T. Katayama, S. Nozawa, Y. Umena, S. Lee, T. Togashi, S. Owada and M. Yabashi, Struct. Dyn., 2019, 6, 054302 CrossRef PubMed.
- T. Katayama, T. Hirano, Y. Morioka, Y. Sano, T. Osaka, S. Owada, T. Togashi and M. Yabashi, J. Synchrotron Radiat., 2019, 26, 333–338 CrossRef CAS PubMed.
- T. Katayama, Y. Inubushi, Y. Obara, T. Sato, T. Togashi, K. Tono, T. Hatsui, T. Kameshima, A. Bhattacharya, Y. Ogi, N. Kurahashi, K. Misawa, T. Suzuki and M. Yabashi, Appl. Phys. Lett., 2013, 103, 131105 CrossRef.
- T. Katayama, S. Owada, T. Togashi, K. Ogawa, P. Karvinen, I. Vartiainen, A. Eronen, C. David, T. Sato, K. Nakajima, Y. Joti, H. Yumoto, H. Ohashi and M. Yabashi, Struct. Dyn., 2016, 3, 034301 CrossRef PubMed.
- M. J. Frisch, G. W. Trucks, H. B. Schlegel, G. E. Scuseria, M. A. Robb, J. R. Cheeseman, G. Scalmani, V. Barone, G. A. Petersson, H. Nakatsuji, X. Li, M. Caricato, A. V. Marenich, J. Bloino, B. G. Janesko, R. Gomperts, B. Mennucci, H. P. Hratchian, J. V. Ortiz, A. F. Izmaylov, J. L. Sonnenberg, D. Williams-Young, F. Ding, F. Lipparini, F. Egidi, J. Goings, B. Peng, A. Petrone, T. Henderson, D. Ranasinghe, V. G. Zakrzewski, J. Gao, N. Rega, G. Zheng, W. Liang, M. Hada, M. Ehara, K. Toyota, R. Fukuda, J. Hasegawa, M. Ishida, T. Nakajima, Y. Honda, O. Kitao, H. Nakai, T. Vreven, K. Throssell, J. A. Jr, J. E. Peralta, F. Ogliaro, M. J. Bearpark, J. J. Heyd, E. N. Brothers, K. N. Kudin, V. N. Staroverov, T. A. Keith, R. Kobayashi, J. Normand, K. Raghavachari, A. P. Rendell, J. C. Burant, S. S. Iyengar, J. Tomasi, M. Cossi, J. M. Millam, M. Klene, C. Adamo, R. Cammi, J. W. Ochterski, R. L. Martin, K. Morokuma, O. Farkas, J. B. Foresman, and D. J. Fox, Gaussian 16, Revision C.01, Gaussian, Inc., Wallingford CT, 2016 Search PubMed.
- J.-D. Chai and M. Head-Gordon, Phys. Chem. Chem. Phys., 2008, 10, 6615–6620 RSC.
- P. J. Hay and W. R. Wadt, J. Chem. Phys., 1985, 82, 270–283 CrossRef CAS.
- S. Miertuš, E. Scrocco and J. Tomasi, Chem. Phys., 1981, 55, 117–129 CrossRef.
- M. L. Baker, M. W. Mara, J. J. Yan, K. O. Hodgson, B. Hedman and E. I. Solomon, Coord. Chem. Rev., 2017, 345, 182–208 CrossRef CAS PubMed.
- M. W. Mara, K. A. Fransted and L. X. Chen, Coord. Chem. Rev., 2015, 282–283, 2–18 CrossRef CAS.
- D. Kumaresan, K. Shankar, S. Vaidya and R. H. Schmehl, in Photochemistry and Photophysics of Coordination Compounds II, ed. V. Balzani and S. Campagna, Springer Berlin Heidelberg, Berlin, Heidelberg, 2007, pp. 101–142, DOI:10.1007/128_2007_140.
- M. S. Kelley, M. L. Shelby, M. W. Mara, K. Haldrup, D. Hayes, R. G. Hadt, X. Zhang, A. B. Stickrath, R. Ruppert, J.-P. Sauvage, D. Zhu, H. T. Lemke, M. Chollet, G. C. Schatz and L. X. Chen, J. Phys. B: At., Mol. Opt. Phys., 2017, 50, 154006 CrossRef.
- M. W. Mara, D. N. Bowman, O. Buyukcakir, M. L. Shelby, K. Haldrup, J. Huang, M. R. Harpham, A. B. Stickrath, X. Zhang, J. F. Stoddart, A. Coskun, E. Jakubikova and L. X. Chen, J. Am. Chem. Soc., 2015, 137, 9670–9684 CrossRef CAS PubMed.
- M. W. Mara, N. E. Jackson, J. Huang, A. B. Stickrath, X. Zhang, N. A. Gothard, M. A. Ratner and L. X. Chen, J. Phys. Chem. B, 2013, 117, 1921–1931 CrossRef CAS PubMed.
- J. Huang, O. Buyukcakir, M. W. Mara, A. Coskun, N. M. Dimitrijevic, G. Barin, O. Kokhan, A. B. Stickrath, R. Ruppert, D. M. Tiede, J. F. Stoddart, J.-P. Sauvage and L. X. Chen, Angew. Chem., Int. Ed., 2012, 51, 12711–12715 CrossRef CAS PubMed.
- X. Zhang, S. E. Canton, G. Smolentsev, C.-J. Wallentin, Y. Liu, Q. Kong, K. Attenkofer, A. B. Stickrath, M. W. Mara, L. X. Chen, K. Wärnmark and V. Sundström, J. Am. Chem. Soc., 2014, 136, 8804–8809 CrossRef CAS PubMed.
- M. Wächtler, J. Guthmuller, S. Kupfer, M. Maiuri, D. Brida, J. Popp, S. Rau, G. Cerullo and B. Dietzek, Chem.–Eur. J, 2015, 21, 7668–7674 CrossRef PubMed.
- M. Iwamura, S. Takeuchi and T. Tahara, Acc. Chem. Res., 2015, 48, 782–791 CrossRef CAS PubMed.
- M. Iwamura, S. Takeuchi and T. Tahara, J. Am. Chem. Soc., 2007, 129, 5248–5256 CrossRef CAS PubMed.
Footnote |
| † Electronic supplementary information (ESI) available: Cyclic voltammogram for CuOs/OsOs, remaining OTA/XTA spectra/kinetics, CuOs MO diagrams, calculated CuOs vibrational modes. See DOI: 10.1039/d1sc05034f |
| This journal is © The Royal Society of Chemistry 2022 |