Enzyme mimicking inorganic hybrid Ni@MnO2 for colorimetric detection of uric acid in serum samples†
Jaya Pal and
Tarasankar Pal*
Department of Chemistry, Indian Institute of Technology, Kharagpur-721302, India. E-mail: tpal@chem.iitkgp.ernet.in
First published on 29th August 2016
Abstract
Reliable and inexpensive detection of uric acid in the absence of any peroxide or enzyme is very challenging for the development of a new cost effective clinical method. Herein, we report an easy, cost effective and nonenzymetic method for selective detection and quantification of uric acid using 3,3′,5,5′-tetramethylbenzidine (TMB) and a Ni@MnO2 hybrid nanomaterial. The ultra-long porous core–shell Ni@MnO2 hybrid nanomaterial, obtained from a simple redox transformation reaction between a prickly nickel nanowire and KMnO4 solution, is reported for the first time. The growth mechanism is studied from time-dependent FESEM and TEM images. The hybrid nanomaterial exhibited intrinsic oxidase-like activity that helps catalytic oxidation of TMB (colourless) to a blue colored product which becomes colourless in the presence of uric acid. Moreover, this colorimetric method has been exploited for the assay of serum uric acid in real samples. Our proposed method can detect as low as 0.24 μM of uric acid with a linear range from 1 to 40 μM. Therefore, we believe that this method would be useful for the detection of uric acid in clinical laboratory.
Introduction
Uric acid (2,6,8-trihydroxypurine, UA) is a primary end product of the metabolic breakdown of purine nucleotides in the human body. The normal level of uric acid in human blood is 2.52–7.56 mg dl−1 (0.15–0.45 mM). Higher levels of serum UA (hyperuricemia) can lead to several pathological symptoms such as gout, arthritis, Lesch–Nyhan syndrome, diabetes, renal, cardiovascular, neurological, and kidney related problems.1 Therefore, precise detection of UA concentration in urine and serum is essential for human health. In recent years, different methods have been developed for the detection of UA level by high performance liquid chromatography (HPLC),2–4 capillary electrophoresis,5–7 electrochemical technique,8–10 chemiluminescence,11,12 fluorescence spectroscopy,13,14 UV-vis spectroscopy,15,16 and enzymatic-spectrophotometric methods17,18 and so on. However, most of the methods suffer from problems such as complicated sample preparation, expensive instrumentation, enzyme leaching, sensitivity and limit of detection, which limits practical application outside the laboratory. So, development of a simple and effective method for accurate determination of UA is still challenging. Colorimetric detection technique has always attracted considerable interest mainly for its simplicity, cost-effectiveness and routine analysis. For example, Zhang et al. proposed a colorimetric method for UA determination based on peroxide-like activity of graphitic carbon nitride nanosheet by using uricase enzyme.19 Ye and co-workers also reported colorimetric strategy for detection of uric acid by using uricase and MIL-53(Fe).20 Zhao et al. synthesized BSA-stabilized Au nanocluster for colorimetric recognition of uric acid.21 Nevertheless, in most of the procedures, uricase enzyme, H2O2 and other special reagents are required for UA sensing. Therefore, we searched for new material for sensitive and selective colorimetric detection of UA in absence of any peroxide or enzyme.Manganese dioxide (MnO2) is an attractive material for pseudocapatitors, heavy metal ion adsorption, catalysis and gas sensor due to its low cost, high surface area, strong oxidising/adsorptive ability and good chemical stability.22–25 Recently, MnO2 nanoparticles were found to exhibit intrinsic oxidase like activity due to the presence of lattice oxygen defect.26 Different groups reported that BSA–MnO2 nanoparticles exhibited oxidase-like activity for colorimetric detection of glutathione, goat anti-human IgG etc.27,28 Then, Ye et al. prepared magnetic core–shell Fe3O4@MnO2 nanoflowers for colorimetric detection of phenol.29 More recently, they have developed a novel “off–on” colorimetric sensor for detection of mercury ions using MnO2 nanoparticles.30 These findings open up a new field of application for MnO2 nanoparticles. To the best of our knowledge, there is no report of the oxidase-like activity of MnO2 nanoparticles for colorimetric detection of UA from nonenzymetic pathway.
Herein, we have presented a thermodynamically favourable redox transformation reaction31,32 for the synthesis of hierarchical porous Ni–MnO2 nanoparticles. Additionally, ultralong Ni@MnO2 hybrid nanomaterials were found to possess excellent oxidase like activity and that has been capitalized successfully for nonenzymetic detection of UA, especially for serum sample analysis in absence of H2O2.
Experimental section
Chemicals
All the reagents used in this experiment were of analytical grade. Millipore water was used throughout the course of experiments. Nickel chloride hexahydrate (NiCl2·6H2O), sodium hydroxide, hydrazine hydrate (N2H4·H2O, 90%), potassium permanganate (KMnO4), glucose, ascorbic acid, urea, cholesterol, NaCl, 4-nitrophenol, NaBH4, 1,10-phenanthroline were purchased from E-Merck. 3,3′,5,5′-Tetramethylbenzidine (TMB) and uric acid were purchased from Sisco Research Laboratory, Mumbai, India. All glassware was properly cleaned and dried well before use.Analytical instruments
Powder X-ray diffraction (XRD) was carried out with a BRUKER D8 advance unit using Cu-Kα (λ = 1.54 Å) radiation. All XRD data were analyzed by using (JCPDS) software.X-ray photoelectron spectroscopy (XPS) measurements were performed with VG Scientific ESCALAB MK II spectrometer (UK) equipped with Mg Kα excitation source (1253.6 eV) and a five-channeltron detection system to confirm the elemental state.
Field emission scanning electron microscopy (FESEM) was carried with a FEI NOVA NANOSEM 450.
Mapping analysis was performed with BRUKER EDS microanalyzer attached to the FESEM instrument.
Transmission electron microscopy (TEM) was performed on a JEOL JEM 2010 electron microscope, operating at a voltage of 200 kV on a carbon coated copper grid.
The Brunauer–Emmett–Teller (BET) surface area measurement was executed with an ASAP 2020 V3.01 G from N2 adsorption–desorption isotherms.
All UV-vis absorption spectra were recorded using SPECTRASCAN UV 2600 digital spectrophotometer (Chemito, India).
Raman spectroscopic measurements and surface enhanced Raman scattering (SERS) were taken using a Renishaw Raman Microscope, equipped with a He–Ne laser excitation source emitting at a wavelength of 632.8 nm, and a Peltier cooled (−70 °C) charge coupled device (CCD) camera. A Leica microscope with 50× objective lens was used. The holographic grating with 1800 grooves per mm and the 1 cm−1 slit enabled the spectral resolution.
Synthesis of prickly Ni nanowire
Ultralong prickly Ni nanowires were synthesized using a solution chemistry route. In a typical synthesis, 100 μL of 1 M NaOH solution was mixed with 20 mL nickel chloride (0.025 M) solution under continuous stirring condition. Subsequently, 1 mL 99% N2H4·2H2O was added to the mixture and heated at ∼80 °C on a water bath for 1 h along with the magnetic bar. Finally, a black coloured fluffy product was obtained inside the solution. The as-synthesized product was washed for several times; first with distilled water and then with ethanol by magnetic decantation process and dried in vacuum.Synthesis of porous core-shell like Ni@MnO2 hybrid nanomaterials
Redox transformation method was employed to grow porous MnO2 nanoflakes on prickly Ni nanowires under modified hydrothermal (MHT) condition. Typically, 5 mg of prickly Ni nanowires was dispersed in 10 mL 0.013 M KMnO4 solution. Then the mixture was transferred to a screw capped test tube (10.5 cm in length and 1.5 cm in diameter) and heated for 12 h at 80–90 °C using a tungsten bulb (100 W) in a closed wooden box (6 inch × 6 inch × 7 inch). The resulting product (porous Ni@MnO2) was collected by centrifugation and carefully washed with distilled water and ethanol for several times and then dried in vacuum.Catalytic oxidation of TMB by Ni@MnO2 hybrid nanomaterials
In a typical procedure, 30 μL of 0.01 M 3,3′,5,5′-tetramethylbenzidine (TMB) was added to 2.6 mL acetate buffer solution (0.01 M, pH = 4.4) with subsequent addition of 100 μL of Ni@MnO2 catalyst solution (0.5 mg mL−1). In our experiment total volume of the solution was made to 3 mL with water. Then the reaction mixture was incubated at 30 °C for 10 min. Finally, the absorption spectrum of the reaction mixture was monitored by using a UV-vis spectrophotometer. This experiment was also carried out with other catalysts (Ni and MnO2) for comparative study keeping all other reaction conditions unaltered.Uric acid detection
Typically, 30 μL of 0.01 M TMB solution was introduced to 2.6 mL acetate buffer solution (0.01 M, pH = 4.4) with subsequent addition of 100 μL of Ni@MnO2 catalyst solution (0.5 mg mL−1). After 10 min of incubation, variable concentrations of uric acid solution (1–70 μM) were added into the reaction mixture and the final volume of the solution was 3 mL. Then the solutions were further incubated for another 25 min at 30 °C. UV-vis absorbance spectroscopy was used to detect the successive change in blue color of the reaction mixture with different uric acid concentration. We have performed the same experiment for real serum samples and other organic species for selectivity test of our process for UA detection.Results and discussion
X-ray diffraction analysis
XRD measurement was performed to understand the crystallinity and phase structure of as-synthesized Ni NW and Ni@MnO2 hybrid nanomaterial (Fig. 1a and b). Fig. 1a represents the XRD pattern of prickly Ni NW and all the diffraction peaks can be well indexed to the standard diffraction patterns of Ni (JCPDS File no. 04-0850). Fig. 1b illustrates the XRD pattern of Ni@MnO2 hybrid nanomaterial. The diffraction peaks at 2θ = 18.2, 37.5° and 65.2° can be indexed to (200), (211) and (002) planes, respectively, of α-MnO2 (JCPDS File no. 44-0141) whereas other three peaks at 2θ = 44.5°, 51.9°, and 76.5° correspond to the (111), (200), and (220) planes, respectively, of Ni (JCPDS File no. 04-0850).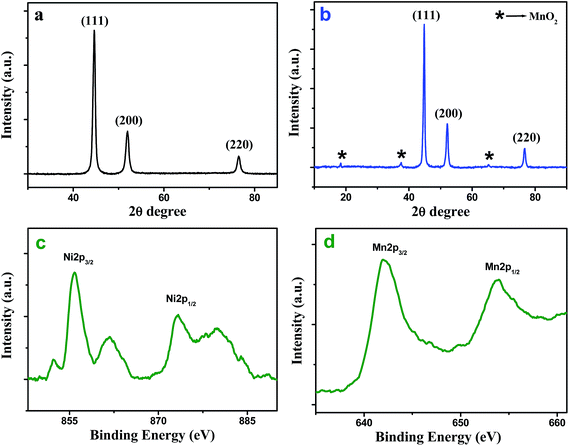 | ||
| Fig. 1 XRD patterns of (a) prickly Ni NW and (b) Ni@MnO2 hybrid nanomaterial. High resolution Ni 2p (c) and Mn 2p (d) XPS spectra of Ni@MnO2 hybrid nanomaterial. | ||
XPS analysis
In order to understand the chemical nature of the Ni and Mn atom, XPS measurement of the core level Ni 2p and Mn 2p spectra of Ni@MnO2 hybrid nanomaterial was carried out (Fig. 1c and d). The Ni 2p signal appear at the binding energy of 855.8 (2p3/2) and 873.5 (2p1/2) eV with an energy separation of 17.7 eV, which usually assigned to the spin–orbit splitting of nickel ion (Fig. 1c).33,34 A few shakeup satellite peaks are also observed at the higher energy side of the principal 2p peaks, which can be ascribed to the charge transfer multielectron transition due to surface oxidation of Ni(0). These facts suggest the presence of a thin layer of NiO on the Ni(0) surface. A shoulder peak appeared at 852.3 eV, which is in accordance with the literature value of pure Ni(0) (Fig. 1c).33 On the other hand, the XPS spectra of Mn 2p3/2 and Mn 2p1/2 at 642.1 and 653.7 eV are attributed to the presence of MnO2 (Fig. 1d).35–37FESEM, TEM and HRTEM analysis
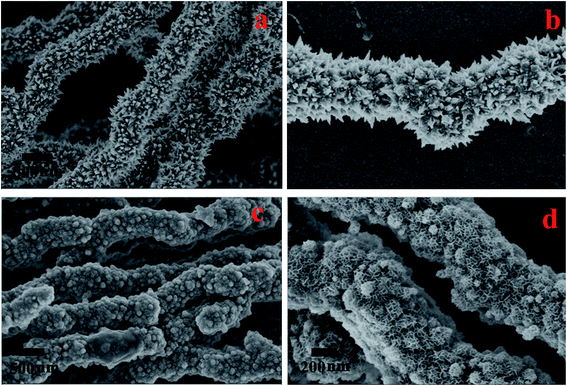
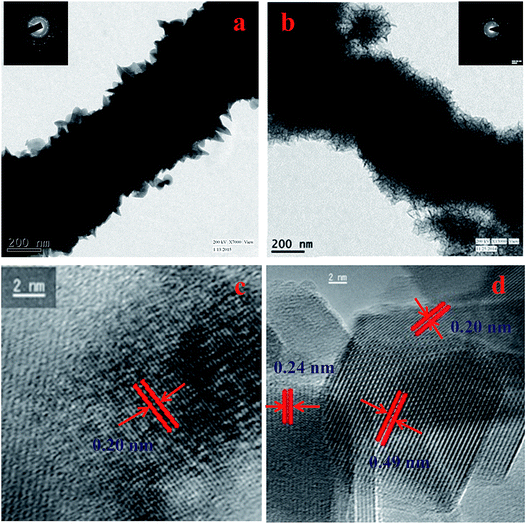
The morphology of the Ni nanoparticle and Ni@MnO2 hybrid nanomaterial was characterised by FESEM (Fig. 2a–d) and TEM (Fig. 3a and b) analysis. FESEM images (Fig. 2a and b) represent that Ni particle has the prickly nanowire like structure with an average diameter of 600–700 nm. Magnified image (Fig. 2b) shows that the spiky branches grew outwardly from the surface of the nanowires. The spiky texture of the Ni nanoparticle was further confirmed from TEM analysis (Fig. 3a). FESEM (Fig. 2c and d) and TEM (Fig. 3b) images show the hierarchical, core–shell like morphology of Ni@MnO2 nanostructures with an average diameter of 600–650 nm. Magnified image (Fig. 2d) shows that the hierarchical architecture is comprised of numerous curvy nanosheets which become interconnected and inherit cavities within. Thus, the nanomaterial becomes highly porous in nature.Ni NW depicts ring-like SAED pattern, which confirms its polycrystalline nature (inset of Fig. 3a). The ring like SAED pattern (inset of Fig. 3b) of Ni@MnO2 also indicates that it is polycrystalline in nature.
Measured lattice d-spacing value of Ni is 0.20 nm, indicating (111) crystal plane of Ni nanoparticle (Fig. 3c). HRTEM image (Fig. 3d) of Ni@MnO2 nanostructure displays the fringe spacing value of both Ni and MnO2. Measured lattice d-spacing values of 0.49 and 0.24 nm corresponding to the (200) and (211) crystal planes of α-MnO2, respectively and the fringe spacing value of Ni is 0.20 nm which is in good agreement of the (111) directional growth of nickel.
EDX analysis
The composition analysis of as-synthesized Ni NW and Ni@MnO2 was investigated by energy dispersive X-ray spectroscopic (EDX) (Fig. S1, ESI†) and area mapping (Fig. S2, ESI†) analysis. EDX (Fig. S1a, ESI†) and area mapping (Fig. S2a1 and a2, ESI†) analysis indicate that prickly nanowires were essentially pure metallic nickel. Whereas, from EDX (Fig. S1b, ESI†) and area mapping (Fig. S2b1–b4, ESI†) analysis of hybrid nanomaterial, it is observed that all three elements such as Ni, Mn, and O are distributed over the whole matrix.BET measurements of Ni@MnO2 hybrid nanomaterials
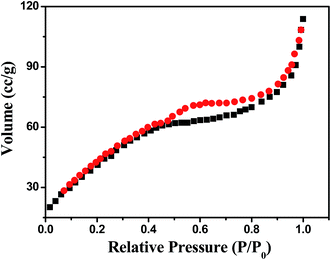
The porous nature of hierarchical Ni@MnO2 core–shell arrays was evident from Brunauer–Emmett–Teller (BET) method. Nitrogen adsorption–desorption isotherm measurement (Fig. 4) shows that surface area value of Ni@MnO2 is 121.23 m2 g−1. The pore volume of this hierarchical structure is 0.52 cm3 g−1. This experimental finding supports the surface area related oxidase-like activity of hierarchical Ni@MnO2 core–shell arrays towards UA sensing.Growth mechanism
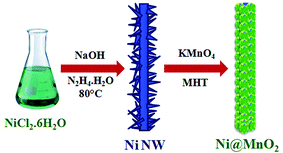
Here, entirely simple, cost-effective and surfactant free synthetic strategy has been developed for the synthesis of hierarchical Ni@MnO2 hybrid nanomaterials. In this work, we have prepared hierarchical core–shell type Ni@MnO2 nanostructures by coating of MnO2 nanoflakes on the surface of prickly Ni nanowire (NW) via two-step solution route. First step involves the synthesis of prickly Ni nanowire by simple hydrazine mediated reduction of nickel chloride under alkaline condition without any surfactant (Scheme 1). Second step is the synthesis of core–shell type Ni@MnO2 nanostructures through a simple redox transformation reaction between prickly Ni NW and KMnO4 solution under modified hydrothermal (MHT)38,39 condition in a screw cap test tube (Scheme 1). This synthetic strategy does not require any surfactant or stabilising agent for growth of porous MnO2 nanoparticles on the surface of Ni NW.For controlled growth of prickly Ni NW, nickel chloride was used as precursor salt and hydrazine as reducing agent and a trace amount of NaOH. In presence of hydrazine, the greenish colour of the nickel chloride solution immediately changes to blue colour due to formation of coordination complexes like [Ni(N2H4)2Cl2] and [Ni(N2H4)3]Cl2 where hydrazine act as a bridging bidentate ligand.40 Then under alkaline condition these complexes is reduced to Ni by excesses hydrazine. Added alkali makes hydrazine a stronger reductant. So here hydrazine serves the purpose of both (i) complexing agent as well as (ii) reducing agent for controlled growth of prickly Ni NW. The proposed reaction becomes slow due to formation of coordination complexes and hence regulated the growth of Ni NW with sharp tips.
In the second step, hierarchical porous Ni@MnO2 was synthesized under modified hydrothermal condition using as-synthesized Ni NW and KMnO4 solution. The standard reduction potential values of MnO4−/MnO2 (+0.59 V vs. SHE) and Ni2+/Ni0 (−0.25 V vs. SHE) endorse thermodynamically allowed Ni–MnO2 nanomaterial formation. The sharp tips of prickly Ni NWs with relatively higher surface energy initiate the redox transformation reaction at these sites in presence of KMnO4 solution. During redox transformation reaction, the dissolution of Ni NW in form of Ni2+ ion (tested by dimethyl glyoxime) takes place with continuous stripping of electrons from the nickel surface causes facile reduction of MnO4− to MnO2.
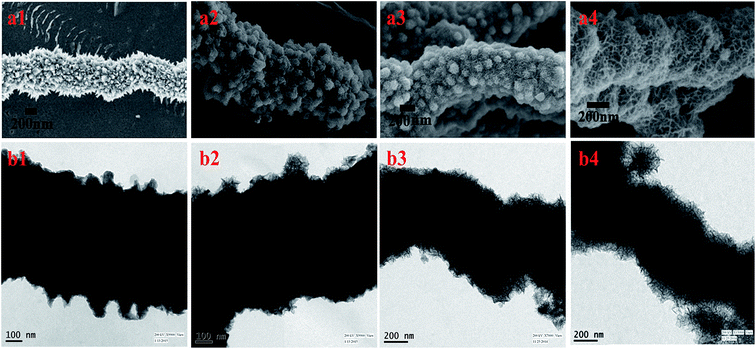
The growth mechanism was explored by time-dependent FESEM and TEM measurements at different time interval of the reaction (Fig. 5). After 4 h of incubation results in a very thin layer of MnO2 on the surface of the tips of prickly Ni NW. With increase of time (8 h), redox-driven corrosion was continued and the whole surface of NW was covered with thick layer of MnO2 nanostructures. Finally porous nature of MnO2 nanostructures was evident with sufficiently extended reaction time (12 h).
Here sensing of UA takes place by two steps. In the first step, Ni@MnO2 hybrid nanomaterial catalyzes the oxidation of TMB into a blue colored product (no other supporting reagent is necessary). In the second step, when an aliquot of UA is added into the blue colored solution of oxidized TMB, the blue coloration becomes colorless due to reduction of the oxidized TMB. So for the first step surface structure of Ni@MnO2 plays important role in catalysis. For this reason we have explained the growth mechanism of Ni@MnO2 by time-dependent FESEM and TEM measurements.
Catalytic activity of Ni@MnO2 hybrid nanomaterial
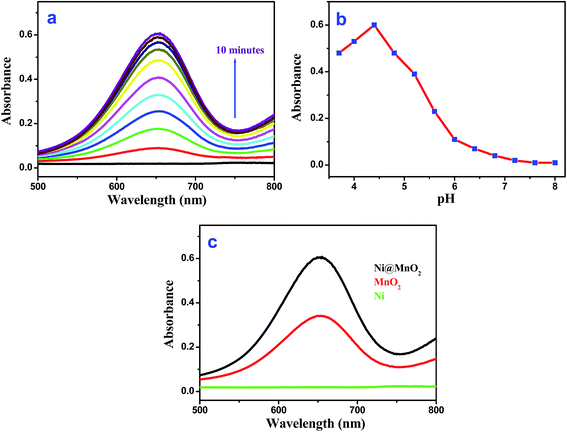
Interestingly, the as-prepared Ni@MnO2 was found to exhibit intrinsic oxidase-like activity as it transforms colorless 3,3′,5,5′-tetramethylbenzidine (TMB) to a blue colored product (maximum absorbance 652 nm) in absence of H2O2 (Fig. 6a). We have also performed the oxidase-like activity of Ni@MnO2 for oxidation of TMB by varying the pH from 3.7 to 8 (by using acetate buffer). The experimental results indicate that the optimal pH is 4.4 (Fig. 6b). As catalytic oxidation of TMB is the first step for sensing of UA so pH 4.4 is also the optimum condition for UA sensing. The catalytic oxidation of TMB becomes slow after bubbling with high purity nitrogen. Controlled experiments showed that the reaction did not proceed with Ni NWs in absence of H2O2 (Fig. 6c). It is worth mentioning that the catalytic efficiency of the as-synthesized Ni@MnO2 nanomaterials (Fig. 6c) is two times higher than MnO2 NWs,24 indicating the novelty of a porous nanostructured surface for catalytic success. However, incorporation of MnO2 nanoflake shell on prickly Ni core makes the hybrid material unsuitable catalyst for model 4-NP reduction (tested with NaBH4 even) (Fig. S3a, ESI†). Again the MnO2 barrier protects the nickel core so efficiently that well known probes like 1,10-phenanthroline cannot access nickel to make the hybrid material an efficient SERS substrate.40 Even drop casted 1,10-phenanthroline onto Ni@MnO2 did not show any signature of the probe due to its in depth penetration (Fig. S3b and c, ESI†). These results suggest that Ni act as an inert component of the heterostructures and MnO2 plays an important role for oxidation of TMB. However, the presence of Ni favours the redox transformation reaction and causes a facile reduction of KMnO4 solution that promotes the growth of porous MnO2. The porous nature of MnO2 enhances the oxidase-like activity of Ni@MnO2 hybrid nanomaterial and even it is better catalyst than pure MnO2 NWs (Fig. 6c). Finally hierarchical core–shell like structure of Ni@MnO2 with high surface area becomes a deliverable for UA detection without H2O2 or any enzyme.Uric acid detection
Based on the oxidase-like activity of Ni@MnO2, here we have developed a colorimetric method for detection of UA without any enzyme or hydrogen peroxide. According to the conventional enzymatic colorimetric method,19 quantitative detection of UA is carried out by measuring the absorbance of oxidised TMB which is linearly dependent on H2O2 concentration. As we know, H2O2 is the main product of UA oxidation by uricase enzyme and it helps the oxidation of TMB into a blue colored product in presence of suitable catalyst (Scheme 2). But in our proposed method, as-synthesized hybrid nanomaterial first catalyzes the oxidation of TMB into a blue coloured product without any H2O2. In the second step, when an aliquot of UA is added into the blue colored solution of oxidised TMB, the blue coloration faded following a neat linear relationship with increased concentration of UA. This is a consequence of the reduction of the oxidised TMB (Scheme 3). The color change of the reaction can easily be confirmed even by naked eye (Fig. 7).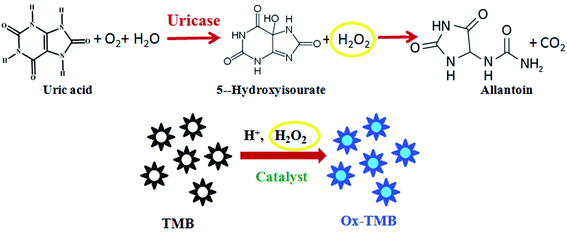 | ||
| Scheme 2 Schematic representation of reported colorimetric sensor for UA by using uricase enzyme and TMB. | ||
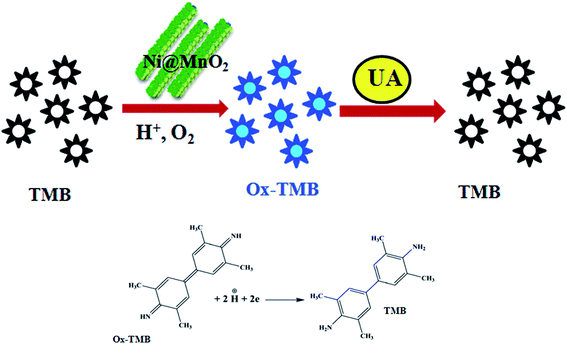 | ||
| Scheme 3 Schematic representation of colorimetric sensor for UA by using TMB and porous Ni@MnO2 hybrid nanomaterial. | ||
 | ||
| Fig. 7 Shows digital image of visual color changes of TMB-Ni@MnO2 systems for different concentration of UA solution (1–70 μM). | ||
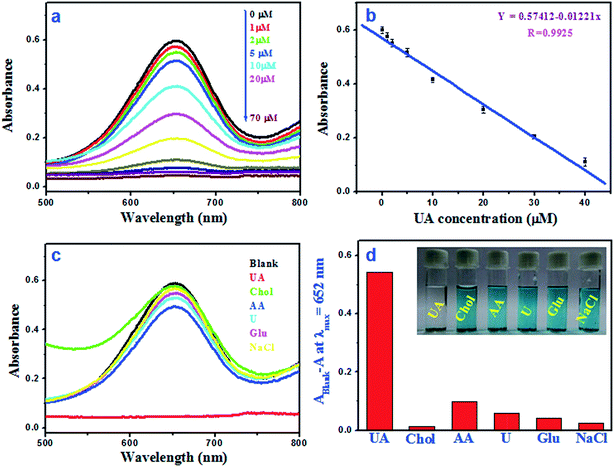
Fig. 8a shows the absorbance at 652 nm for oxidised TMB with different UA concentration (1–70 μM). Fig. 8b illustrates the linear relationship between the absorbance and the UA concentration within the range of 1–40 μM (R2 = 0.9851) and the calculated limit of detection (LOD) value is 0.24 μM. It was observed that the calculated LOD value for UA is superior to other reported colorimetric methods (Table 1).19–21,41–43 The reproducibility of this sensing method was tested by three consecutive detection and the relative standard deviation (RSD) is found to be 0.8–1.6%. To evaluate the selectivity of this colorimetric assay, the absorbance responses of the sensing system were measured for glucose (Glu), ascorbic acid (AA), cholesterol (Chol), urea (U) and NaCl (Fig. 8c). As shown in Fig. 8d, it is found that there is no promising colour fading in presence of other interfering substances, suggesting that this method is highly selective for UA detection.
| Material | Linear range (μM) | LOD (μM) | Reference |
|---|---|---|---|
| Uricase/graphitic carbon nitride | 10–100 | 8.9 | 9 |
| Uricase/Au NP/MWCNT Au electrode | 10–800 | 10 | 28 |
| Uricase/BSA-stabilized Au nanocluster | 2–200 | 0.36 | 11 |
| Uricase/Ag nanoprisms | 1–40 | 0.7 | 29 |
| Uricase/HRP-CdS quantum dots | 125–1000 | 125 | 30 |
| Uricase/MIL-53(Fe) | 4.5–60 | 1.3 | 10 |
| Ni@MnO2 (without uricase) | 1–40 | 0.24 | This work |
In order to examine the practical feasibility of this sensing protocol, we have also performed the same experiments with five human serum samples. After the addition of real serum UA samples, the absorbance values of oxidised TMB were noted from UV-vis spectrophotometer and then these values were extrapolated from the standard calibration curve. Table 2 summarizes the analyzed UA concentration values, the % recovery and precision for serum samples. The experimental results corroborate with the values detected from the clinical laboratory. So, this enzyme mimicking inorganic material stands efficient in clinical practice for colorimetric detection of serum UA with an excellent linear dynamic range, sensitivity, specificity and accuracy.
| Samples | Concentration of UA (mM) [clinical method] | Concentration of UA detected (mM) | Recovery (%) | RSD (n = 3, %) |
|---|---|---|---|---|
| a Data supported by the B. C. Roy Technology Hospital – IIT Kharagpur. | ||||
| Serum 1 | 0.428 | 0.432 | 100.9 | 1.3 |
| Serum 2 | 0.449 | 0.441 | 98.2 | 1.2 |
| Serum 3 | 0.276 | 0.284 | 102.8 | 2.6 |
| Serum 4 | 0.223 | 0.218 | 97.7 | 1.5 |
| Serum 5 | 0.517 | 0.525 | 101.5 | 0.9 |
Conclusion
In summary, ultralong hierarchical, core–shell like Ni@MnO2 nanostructure has been successfully synthesized using a simple redox transformation reaction. The as-synthesized Ni@MnO2 exhibited intrinsic oxidase-like activity that helps selective nonenzymatic detection of uric acid in serum sample. The relatively higher surface area and presence of lattice oxygen of MnO2 component of the hybrid material is responsible for the observed enhanced catalytic activity of Ni@MnO2. Our present study has wide opened a simple strategy for UA detection in serum samples in absence of any enzyme with high sensitivity, specificity, reproducibility, good linearity over a wide range, and a low detection limit. Therefore, our proposed method can be used as a convenient tool for the detection of UA in clinical diagnosis and the solid material becomes trust worthy deliverable.Acknowledgements
The authors are thankful to the UGC, DST and CSIR New Delhi for financial assistance and IIT Kharagpur for research facilities. The authors are also thankful to B. C. Roy Technology Hospital – IIT Kharagpur for serum uric acid samples.References
- K. Arora, M. Tomar and V. Gupta, Biosens. Bioelectron., 2011, 30, 333–336 CAS.
- S. Zhou, R. Zuo, Z. Zhu, D. Wu, K. Vasa, Y. Deng and Y. Zuo, Anal. Methods, 2013, 5, 1307–1311 RSC.
- J.-F. Jen, S.-L. Hsiao and K.-H. Liu, Talanta, 2002, 58, 711–717 CrossRef CAS PubMed.
- J. Zhao, Anal. Methods, 2013, 5, 6781–6787 RSC.
- J. L. Boughton, B. W. Robinson and T. G. Strein, Electrophoresis, 2002, 23, 3705–3710 CrossRef CAS PubMed.
- A. Zinellu, C. Carru, S. Sotgia and L. Deiana, Anal. Biochem., 2004, 330, 298–305 CrossRef CAS PubMed.
- J. Matejckova, P. Tuma, E. Samcova and Z. Zemanova, J. Sep. Sci., 2007, 30, 1947–1952 CrossRef CAS PubMed.
- A. S. Kumar and R. Shanmugam, Anal. Methods, 2011, 3, 2088–2094 RSC.
- L.-T. Liao, C.-C. Liao, C.-C. Liu, T.-Y. Yang and G.-C. Wang, Clin. Chim. Acta, 2014, 436, 72–77 CrossRef CAS PubMed.
- N. Chauhan and C. S. Pundir, Anal. Biochem., 2011, 413, 97–103 CrossRef CAS PubMed.
- D. Yao, A. G. Vlessidis and N. P. Evmiridis, Anal. Chim. Acta, 2002, 467, 133–144 CrossRef CAS.
- R. D. Chaudhari, A. B. Joshi and R. Srivastava, Sens. Actuators, B, 2012, 173, 882–889 CrossRef CAS.
- J. Galban, Y. Andreu, M. J. Almenara, S. de Marcos and J. R. Castillo, Talanta, 2001, 54, 847–854 CrossRef CAS PubMed.
- P. C. Damiani, M. D. Borraccetti and A. C. Olivieri, Anal. Chim. Acta, 2002, 471, 87–96 CrossRef CAS.
- A. K. Bhargava, H. Lal and C. S. Pundir, J. Biochem. Biophys. Methods, 1999, 39, 125–136 CrossRef CAS PubMed.
- D. Wu, H.-F. Lu, H. Xie, J. Wu, C.-M. Wang and Q.-L. Zhang, Sens. Actuators, B, 2015, 221, 1433–1440 CrossRef CAS.
- J. Wang, T. Golden and P. Tuzhi, Anal. Chem., 1987, 59, 740–744 CrossRef CAS PubMed.
- Y. Zhao, X. Yang, W. Lu, H. Liao and F. Liao, Microchim. Acta, 2009, 164, 1–6 CrossRef CAS.
- Q. Lu, J. Deng, Y. Hou, H. Wang, H. Li and Y. Zhang, Chem. Commun., 2015, 51, 12251–12253 RSC.
- J. Lu, Y. Xiong, C. Liao and F. Ye, Anal. Methods, 2015, 7, 9894–9899 RSC.
- H. Zhao, Z. Wang, X. Jiao, L. Zhang and Y. Lv, Spectrosc. Lett., 2012, 45, 511–519 CrossRef CAS.
- V. Subramanian, H. Zhu, R. Vajtai, P. M. Ajayan and B. Wei, J. Phys. Chem. B, 2005, 109, 20207–20214 CrossRef CAS PubMed.
- E.-J. Kim, C.-S. Lee, Y.-Y. Chang and Y.-S. Chang, ACS Appl. Mater. Interfaces, 2013, 5, 9628–9634 CAS.
- A. K. Sinha, M. Pradhan and T. Pal, J. Phys. Chem. C, 2013, 117, 23976–23986 CAS.
- K. Miyazaki, M. Hieda and T. Kato, Ind. Eng. Chem. Res., 1997, 36, 88–91 CrossRef CAS.
- Y. Wan, P. Qi, D. Zhang, J. Wu and Y. Wang, Biosens. Bioelectron., 2012, 33, 69–74 CrossRef CAS PubMed.
- X. Liu, Q. Wang, Y. Zhang, L. Zhang, Y. Su and Y. Lv, New J. Chem., 2013, 37, 2174–2178 RSC.
- X. Liu, Q. Wang, H. Zhao, L. Zhang, Y. Su and Y. Lv, Analyst, 2012, 137, 4552–4558 RSC.
- Y. Xiong, S. Chen, F. Ye, L. Su, C. Zhang, S. Shen and S. Zhao, Anal. Methods, 2015, 7, 1300–1306 RSC.
- H. Yang, Y. Xiong, P. Zhang, L. Su and F. Ye, Anal. Methods, 2015, 7, 4596–4601 RSC.
- J. Pal, C. Mondal, A. K. Sasmal, M. Ganguly, Y. Negishi and T. Pal, ACS Appl. Mater. Interfaces, 2014, 6, 9173–9184 CAS.
- J. Pal, M. Ganguly, S. Dutta, C. Mondal, Y. Negishi and T. Pal, CrystEngComm, 2014, 16, 883–893 RSC.
- N. Hernandez, R. Moreno, A. J. S. Herencia and J. L. G. Fierro, J. Phys. Chem. B, 2005, 109, 4470–4474 CrossRef CAS PubMed.
- T. You, O. Niwa, Z. Chen, K. Hayashi, M. Tomita and S. Hirono, Anal. Chem., 2003, 75, 5191–5196 CrossRef CAS PubMed.
- V. Subramanian, H. Zhu, R. Vajtai, P. M. Ajayan and B. Wei, J. Phys. Chem. B, 2005, 109, 20207–20214 CrossRef CAS PubMed.
- J. Yan, A. Sumboja, X. Wang, C. Fu, V. Kumar and P. S. Lee, Small, 2014, 10, 3568–3578 CrossRef CAS PubMed.
- Y. Zhao, W. Ran, J. He, Y. Huang, Z. Liu, W. Liu, Y. Tang, L. Zhang, D. Gao and F. Gao, Small, 2015, 11, 1310–1319 CrossRef CAS PubMed.
- J. Pal, A. K. Sasmal, M. Ganguly and T. Pal, J. Phys. Chem. C, 2015, 119, 3780–3790 CAS.
- J. Pal, M. Ganguly, C. Mondal, Y. Negishi and T. Pal, Nanoscale, 2015, 7, 708–719 RSC.
- S. Sarkar, A. K. Sinha, M. Pradhan, M. Basu, Y. Negishi and T. Pal, J. Phys. Chem. C, 2011, 115, 1659–1673 CAS.
- N. Chauhan and C. S. Pundir, Anal. Biochem., 2011, 413, 97–103 CrossRef CAS PubMed.
- D. Wua, H.-F. Lua, H. Xie, J. Wu, C.-M. Wang and Q.-L. Zhang, Sens. Actuators, B, 2015, 221, 1433–1440 CrossRef.
- N. E. Azmi, N. I. Ramli, J. Abdullah, M. A. A. Hamid, H. Sidek, S. A. Rahman, N. Ariffin and N. A. Yusof, Biosens. Bioelectron., 2015, 67, 129–133 CrossRef CAS PubMed.
Footnote |
| † Electronic supplementary information (ESI) available: Other experimental data and results indicated. See DOI: 10.1039/c6ra11483k |
| This journal is © The Royal Society of Chemistry 2016 |

