Isotopic effect on the aging dynamics of a charged colloidal system
V.
Tudisca
a,
M. A.
Ricci
a,
R.
Angelini
b and
B.
Ruzicka
*b
aDipartimento di Fisica “E. Amaldi”, Università degli Studi “Roma Tre”, Via della Vasca Navale 84, 00146 Roma, Italy
bIPCF - CNR and Dipartimento di Fisica, Università di Roma “La Sapienza”, Piazzale A. Moro 2, I-00185, Rome, Italy
First published on 10th October 2012
Abstract
A dynamic light scattering (DLS) investigation of the isotopic H/D substitution on water molecules in aqueous Laponite suspensions is reported for two Laponite weight concentrations (Cw = 1.5% and Cw = 3.0%). Increasing the deuterium percentage results in a slowing down of the dynamics for both concentrations, although the aging behavior of the suspensions is not qualitatively modified by the isotopic substitution. A scaling law for the isotopic effect is found. The relaxation times and the stretching parameters collapse on two distinct master curves, indicating that the two previously found dynamical behaviors of colloidal gels and glasses are preserved. These results may facilitate a large variety of experimental techniques and further theoretical investigations about the role of the solvent in determining the interaction potential.
I. Introduction
Dynamic arrest in colloidal and, more generally, in soft matter systems, has gained increasing attention in recent years1–5 because of its theoretical and technological implications. It is well known, in fact, that colloidal systems are very good models for understanding the general problem of dynamic arrest, showing a larger flexibility compared to atomic and molecular glasses. Indeed, thanks to their size, they can be easily investigated by conventional techniques, such as dynamic light scattering (DLS) and optical microscopy. Moreover, their physical and chemical properties can be manipulated ad hoc by controlling the interaction potential between colloidal particles.1 Few real systems are suitable for use as experimental counterparts for the vivid theoretical speculations on non-linear, complex and non-equilibrium systems: among these Laponite aqueous suspensions, investigated in the present work, show a rich dynamic arrest phenomenon. During the last few years, a notable effort has been devoted to understanding the very rich and debated state diagram of aqueous Laponite suspensions by investigating the influence of parameters, such as the clay and salt concentration, on the aging process, the involved time scales and the nature of the arrested states.6–10 Laponite suspensions may indeed undergo a transition to different arrested states (at least two in salt-free water: the equilibrium gel and Wigner glass), depending on very small variations in the clay concentration. Consequently, Laponite suspensions have attracted wide industrial interest (as a rheology modifier for many applications, such as in paints or personal care products) and have technological appeal (for the design of new materials) but face fundamental scientific challenges.In this work, we extend our previous DLS studies on Laponite suspensions, introducing H/D isotopic substitution in the solvent to compare the case of water, H2O, heavy water, D2O, and an equimolar mixture of both, hereafter labelled HDO. The complex dependence of both the aging processes and phase diagram of Laponite–water suspensions on many parameters, such as the clay and salt concentration and the Laponite composition and preparation, suggests that the isotopic substitution may also introduce changes in the dynamic behavior. Furthermore, the study reported in this paper not only investigates the modifications due to this new parameter, but also opens the window to a large variety of experimental techniques, such as nuclear magnetic resonance and neutron scattering, which require isotopic substitution. Hence, the knowledge of this effect is necessary for future studies, which aim at exploring time and length scales never investigated before. Samples with two different clay concentrations in salt-free solution have been chosen, namely, Cw = 1.5% and Cw = 3.0% in the case of H2O–Laponite suspensions. They belong to regions of the state diagram characterized by two very different dynamical behaviors, as indicated by the existence of two distinct master curves.17 Previous DLS, small angle X-ray scattering (SAXS) and dilution experiments compared to theoretical and numerical results11,12 have shown that the “low” concentration suspension (Cw = 1.5%) evolves in nearly one month from a liquid to an equilibrium gel.13 On the contrary the “high” concentration suspension (Cw = 3.0%) evolves in a few hours from a liquid to a Wigner glass; i.e., a very low density glass, stabilized by electrostatic repulsion.11 From a theoretical point of view, this phenomenon can be explained by taking into account the competition between long-range repulsion and short-range attraction forces. In particular, the aging process at “low” concentrations (Cw = 1.5%) is determined by attractive forces between the rims (positively charged) and faces (negatively charged) of the platelets, which, thanks to their anisotropic shape and the directionality of the face–rim interactions, originate an equilibrium gel, which is similar to what has been predicted for patchy particles.13 It has been proposed that the structure of this gel is similar to a “house of cards”, where Laponite platelets are linked together by T-bonds between the faces and the rims. Conversely, the aging process at “high” concentrations (Cw = 3.0%), which generates a Wigner glass, is driven by long-range electrostatic repulsive forces between the surfaces of the Laponite platelets.11 These are trapped in arrangement whereby they sit as far as possible from one another, giving rise to a sort of long-distance cage effect. Indeed, in the Wigner glass state particles are spatially disconnected in a sort of empty cage, where their localization length is larger, or at least comparable, to their size.
Here, we find that samples with H/D isotopic substitution follow, for low and high concentrations, two different aging behaviors as well. A scaling law for the isotopic effect is found with the persistence of two distinct master curves similar to those previously found for gels and glasses. The same phenomenon of Laponite water solutions is observed in HDO and D2O samples but, in contrast to the case of water, a slowing down of the dynamics is found. The increase of the percentage of deuterium indeed induces a delay in the aging process, indicating that the isotopic substitution does not modify the dynamic arrest phenomenon but does affect its time scale.
II. Experimental details
A. Laponite and sample preparation
Laponite, a fine white powder, is a synthetic smectite clay (Rockwood Additives Ltd, RD) belonging to the family of phyllosilicates, built up of sheets of octahedrally-coordinated magnesium oxide, sandwiched between two parallel sheets of tetrahedrally-coordinated silica. The unit cell, with empirical formula Na+0.7[Si8Mg5.5Li0.3O20(OH)4]−0.7, is repeated hundred of times along two directions, giving rise to the typical nanometer-sized platelet. The presence of lithium atoms, which substitute magnesium atoms, gives a net negative charge that, in the dry powder, is balanced by interlayer cations (typically sodium ions), which hold together adjacent layers. Once dispersed in water, Laponite hydrates and swells to form platelets. At the same time, Na+ ions are released leaving a negative charge on the platelet faces; while the protonation of the OH− groups originates a positive charge on the platelet rim. The result is a colloidal dispersion of charged, disk-like particles (platelets) with a diameter of ∼25 nm and a thickness of ∼1 nm.The aqueous Laponite dispersion was prepared by following the preparation method suggested by Ruzicka et al.,6 which is a standard procedure developed to ensure good sample reproducibility, which is a non-trivial issue when dealing with such complex systems. The samples were prepared inside a glove box under an N2 atmosphere (to avoid dissolution or degradation of the Laponite particles in the presence of atmospheric CO214,15) by dispersing the Laponite powder in deionized water and stirring vigorously for a fixed time (thirty minutes) until the suspension became clear. The measured pH value was the same (pH  10) for all the prepared samples. Finally, the system was filtered through a 0.45 μm pore size filter in order to eliminate possible aggregates. The filtering time was assumed to be the starting wait time (tw = 0). Samples in H2O, D2O and HDO were prepared with the same molar ratio; therefore, the weight concentration, Cw, reported in the text always refers to the case of H2O.
B. Dynamic light scattering
DLS measurements were performed using an ALV-5000 logarithmic correlator in combination with a standard optical set-up, based on a direct diode (λ = 642 nm) laser and a single-mode optical fiber coupled to a photomultiplier detector. The intensity correlation function was directly obtained as g2(q,t) = <I(q,t)I(q,0)>/<I(q,0)2>, where q is the modulus of the scattered wave vector, defined as q = (4πn/λ)sin(θ/2), with n equal to the refractive index of the sample and θ = 90° in the present experiment. We followed the evolution of the autocorrelation functions with the waiting time in the ergodic regime up to the transition towards the arrested state.III. Results and discussion
Auto-correlation functions at increasing waiting times tw for all investigated samples at different concentrations and deuterium contents are shown in Fig. 1. At both Laponite clay concentrations, the autocorrelation functions, measured by DLS, show a decay that slows down with an increasing waiting time tw (aging). The data in Fig. 1 are in the ergodic regime, except for the last curve, which shows a crossover towards a non-ergodic dynamically-arrested state (at least in the experimentally-accessible time window of 1 s). We noticed that the aging evolution before the non-ergodic transition completes for waiting times of the order of 103 and 10 h for low and high concentration samples, respectively.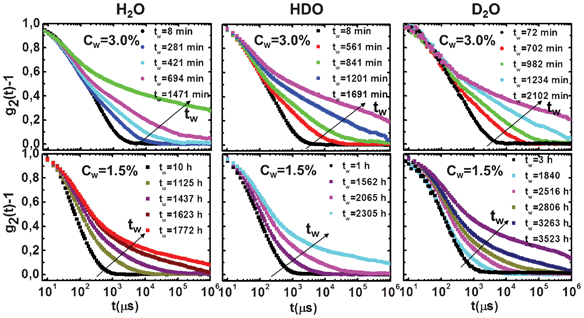 | ||
| Fig. 1 Evolution of the measured intensity auto-correlation functions from the ergodic to the non-ergodic region at different waiting times tw, which increases according to the arrow, for high (Cw = 3.0%; top panels) and low (Cw = 1.5%; bottom panels) Laponite concentrations and for three different H/D isotopic compositions of the solvent. Pure H2O (left panels), HDO (middle panels) and pure D2O (right panels). | ||
The correlation function, g2(q,t), decay follows a two-step behavior and this indicates that two different relaxation processes, a fast and a slow one, are present in the system. In order to describe the two processes quantitatively, g2(q,t) − 1 has been fitted by the squared sum of two contributions:16
| g2(q,t) − 1 = [aexp(−t/τ1) + bexp(−(t/τ2)β)]2, | (1) |
The dynamic structure factor is directly obtained by inverting the Siegert relation:
 | (2) |
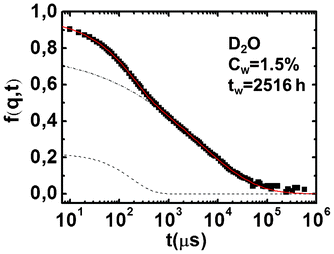 | ||
| Fig. 2 Dynamic structure factor, f(q,t) of the sample at Cw = 1.5% in D2O at a fixed waiting time and the corresponding fit. The two contributions of the fit are also shown as a dashed curve for the simple exponential term and dot–dash curve for the stretched exponential one. | ||
Looking at eqn 1, it is clear that the slow relaxation can be described by both the slow time, τ2, and the stretching exponent, β; it is therefore important to define another parameter, namely the mean relaxation time, τm,17,18 to estimate the waiting time of the dynamic arrest. Since the presence of the stretched exponential decay in eqn (1) accounts for the existence of the whole distribution (f(τ′)) of relaxation times (τ2), one can write:
 | (3) |
 | (4) |
| τm(tw) = τ2Γ(1/β)/β, | (5) |
| τm = τ0expB(tw/(t∞w − tw)) | (6) |
A. The effect of the isotopic substitution on the aging time
In Fig. 3, the auto-correlation functions for H2O, HDO and D2O solutions at a fixed waiting time (10 and 1770 h, respectively, for high and low clay concentrations) are shown. Upon isotopic substitution, a slowing down of the aging dynamics for both low and high clay concentrations is clearly observed. It is evident that, in both cases, when the H2O samples are very close to becoming non-ergodic, the D2O ones still present a typical liquid behavior.This evidence is confirmed by looking at the behavior of τm and β.
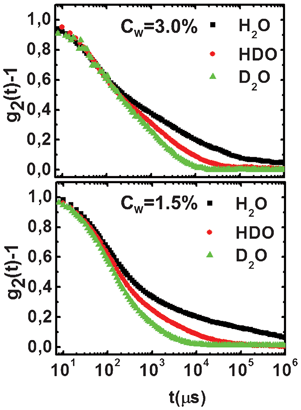 | ||
| Fig. 3 Intensity auto-correlation functions at fixed waiting times for H2O, HDO and D2O suspensions, at high (Cw = 3.0%, tw ∼ 10 h; top panel) and low (Cw = 1.5%, tw ∼ 1770 h; bottom panel) clay concentrations. | ||
The stretching exponent, β, is shown in Fig. 4 for the two clay concentrations and the three different solutions, namely H2O, HDO and D2O. At both clay concentrations, the exponent β decays from values close to 1.0 (simple exponential), which are typical of an ergodic system, to values close to 0.2, which are characteristic of an arrested state. The shape of the decay for all the H/D isotopic substituted samples is different at the two clay concentrations: it is almost linear at Cw = 3.0%, and parabolic at Cw = 1.5%. Similar behavior was found in previous works on H2O–Laponite suspensions.17,18
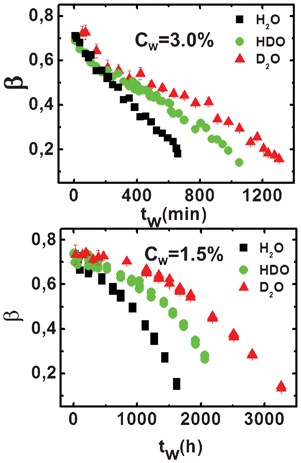 | ||
| Fig. 4 Stretching exponent, β, as a function of the waiting time, tw, for different percentages of deuterium (H2O, HDO and D2O) in the high (top panel) and low (bottom panel) concentration regions. | ||
Finally, in Fig. 5, the mean relaxation time, τm, is shown as a function of the waiting time, tw, for both the high and the low clay concentrations. The behavior of this parameter provides clear evidence for an aging process: its increase with the waiting time indicates a slowing down of the dynamics. The fits through eqn (6) (full lines) allow us to estimate the dynamic arrest time, t∞w. We observe that the dynamic arrest becomes increasingly slower from the H2O to the HDO and eventually to the D2O samples. Correspondingly, an increase of the percentage of deuterium in solution results in t∞w values of 13 ± 2, 21 ± 2 and 28 ± 3 hours for the high clay concentration samples and 75 ± 5, 110 ± 5 and 155 ± 5 days for the low concentration ones.
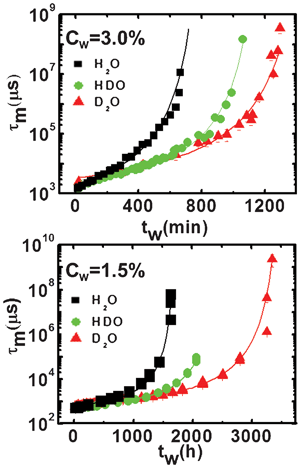 | ||
| Fig. 5 Mean relaxation time, τm, as a function of the waiting time (symbols) for the high (Cw = 3.0%; top panel) and low (Cw = 1.5%; bottom panel) concentration samples for the three solvents, H2O, HDO and D2O. The fits, through eqn (6) (lines), are superimposed to the data. | ||
As already found in previous studies,17t∞w differs by an order of magnitude between the two clay concentrations. In both cases, t∞w increases with the addition of deuterium, suggesting a relationship between the slowing of the relaxation process and the translational, and possibly rotational, degrees of freedom of the solvent. This behavior cannot be directly ascribed to the Laponite interaction potential schematically represented by van der Waals, attractive and repulsive electrostatic contributions6 due to the negligible differences between the refractive index and dielectric constant with regards to H2O and D2O. However, real modification of the effective potential can be determined by a direct comparison of the theoretical and experimental structure factors (work in progress). In our opinion, the slowing of the dynamics with isotopic substitution is due to the fact that the D2O solvent has a viscosity ∼ 20% higher than that of H2O, thus reducing the platelets’ mobility and mean square displacement. As a consequence, the time required for the platelets to reach an equilibrium arrested state increases.
B. Scaling law
Previous measurements17,18 have shown the existence of a scaling law in water–Laponite suspensions for different Laponite concentrations. In particular, both the β and τm parameters collapse on two different master curves for low, 0.3% ≤ Cw < 2.0%, and high, 2.0% ≤ Cw ≤ 3.0%, clay concentrations, when tw is re-scaled by t∞w. Here, at fixed Laponite concentrations, we propose a scaling law for the percentage of heavy water in the suspension. In Fig. 6 and Fig. 7, the β and τm parameters of Fig. 4 and Fig. 5 are shown as a function of the re-scaled waiting time, tw/t∞w, for high (top panels) and low (bottom panels) clay concentrations.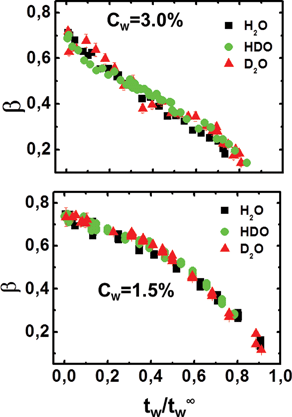 | ||
| Fig. 6 Stretching exponent, β, as a function of the scaled variable, tw/t∞w, for the high (Cw = 3.0%; top panel) and low (Cw = 1.5%; bottom panel) concentration samples for the three solvents, H2O, HDO and D2O. | ||
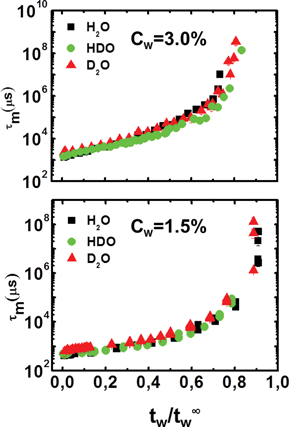 | ||
| Fig. 7 Mean relaxation time, τm, as a function of the scaled variable, tw/t∞, for the high (Cw = 3.0%; top panel) and the low (Cw = 1.5%; bottom panel) concentration samples for the three solvents, H2O, HDO and D2O. | ||
It is evident that all the data for the three different solvents, H2O, HDO and D2O, collapse on two master curves, which is characteristic of the high and low concentration aging processes.
In Fig. 8, we report a summary of the results shown in Fig. 6 and Fig. 7 in a unified picture that easily underlines the existence and persistence of two different master curves, one at high clay concentrations and another at low clay concentrations, for all the different solvents. It is clear that the master curves, relative to the two clay concentrations, do not overlap. This is additional proof that two different pathways exist for the non-ergodic state at high and low clay concentrations and that the isotopic substitution does not alter the physical properties of the dynamic arrest.
 | ||
| Fig. 8 β (top panel) and τm (bottom panel) as a function of the scaled variable, tw/t∞w for the high (Cw = 3.0%) and low (Cw = 1.5%) concentration samples for the three solvents, H2O, HDO and D2O. | ||
Therefore, we have found a universal law for the isotopic substitution. This means that, in this system, the physical laws that govern the dynamic arrest, while retaining their specific clay concentration dependence, are independent of the isotopic composition of the solvent.
IV. Conclusions
In this work, we have shown that the isotopic H/D substitution of water molecules in aqueous Laponite suspensions does not affect the aging process but its time scale, in fact a slowing down of the phenomenology of dynamics, is induced by the presence of deuterium. Similar effects on the aging process have been found by modifying the interaction potential between Laponite platelets by adding opportune concentrations of PEO polymer to the Laponite suspensions.19 We have observed that, at both high and low clay concentrations, the dynamic arrest time, estimated by t∞w, increases with the D/H percentage, i.e. with the solvent mass. This suggests that the translational and possibly rotational degrees of freedom of the sample dominate the dynamical arrest process, which is slower in D2O due to its higher viscosity compared to H2O. This evidence opens the window for further theoretical investigations about the role of solvent in determining interaction potentials.A scaling law has also been found for isotopic substitution. Both the mean relaxation time, τm, and the stretching exponent, β, collapse on two different master curves typical of low and high clay concentrations and this is found to be independent of the isotopic composition of the solvent. This confirms that the driving force for the ergodic to non-ergodic transition is different for the two clay concentrations and is independent of the isotopic substitution of the solvent. This indicates that the two distinct dynamic behaviors of colloidal gels and glasses are preserved. This finding, never addressed before, is crucial for experimental investigation that requires H/D isotopic substitution. The obtained results represent, therefore, a very useful starting point to make Laponite suspensions accessible to a large variety of experimental techniques, such as small angle neutron scattering (work in progress), spin ECHO and NMR, and to assess the different time and spatial scales and the microscopic structural and dynamical properties.
References
- F. Sciortino and P. Tartaglia, Glassy colloidal systems, Advances in Physics, 2005, 54(6–7), 471–524 CAS.
- K.A. Dawson, The glass paradigm for colloidal glasses, gels and other arrested states driven by attractive interactions, Curr. Opin. Colloid Interface Sci., 2002, 7, 218 CAS.
- V. Trappe and P. Sandkühler, Colloidal gels - low-density disordered solid-like states, Curr. Opin. Colloid Interface Sci., 2004, 8, 494 CAS.
- W. C. K. Poon, Phase separation, aggregation and gelation in colloid-polymer mixtures and related systems, Curr. Opin. Colloid Interface Sci., 1998, 3, 593 CAS.
- E. Zaccarelli, Colloidal gels: equilibrium and non-equilibrium routes, J. Phys.: Condens. Matter, 2007, 19, 323101 Search PubMed.
- B. Ruzicka and E. Zaccarelli, A fresh look at Laponite phase diagram, Soft Matter, 2011, 7, 1268 CAS.
- B. Ruzicka, L. Zulian and G. Ruocco, Ageing dynamics in Laponite dispersions at various salt concentrations, Philosophical Magazine, 2007, 87, 449 CAS.
- S. Jabbari-Farouji, H. Tanaka G. H. Wegdam and D. Bonn, Multiple nonergodic disordered states in Laponite suspensions: A phase diagram, Phys. Rev. E, 2008, 78, 061405 CAS.
- P. Mongondry, J. F. Tassin and T. Nicolai, Revised state diagram of Laponite dispersions, Journal of Colloid and Interface Science, 2005, 283, 397 CAS.
- A. Shahin and Y. M. Joshi, Irreversible Aging Dynamics and Generic Phase Behavior of Aqueous Suspensions of Laponite, Langmuir, 2010, 26, 4219 CAS.
- B. Ruzicka, L. Zulian, E. Zaccarelli, R. Angelini, M. Sztucki, A. Moussaid and G. Ruocco, Competing interactions in arrested states of colloidal clays, Phys. Rev. Lett., 2010, 104, 085701 CAS.
- B. Ruzicka, L. Zulian, R. Angelini, M. Sztucki, A. Moussaid and G. Ruocco, Arrested state of clay-water suspensions: gel or glass?, Phys. Rev. E, 2008, 77, 020402(R) CrossRef.
- B. Ruzicka, E. Zaccarelli, L. Zulian, R. Angelini, M. Sztucki, A. Moussaid, T. Narayanan and F. Sciortino, Observation of empty liquids and equilibrium gels in a colloidal clay, Nature Materials, 2011, 10, 56 CAS.
- D. W. Thompson and J. T. Butterworth, The nature of Laponite and its aqueous dispersions, J. Colloid. Interface Sci., 1991, 151, 236 Search PubMed.
- A. Mourchid and P. Levitz, Gelation of a Clay Colloid Suspension, Phys. Rev. Lett., 1998, 75, 2236 Search PubMed.
- B. Abou and D. Bonn, and J. Meunier : Aging dynamics in a colloidal glass, Phys. Rev. E, 2001, 64, 021510 CrossRef CAS.
- B. Ruzicka, L. Zulian and G. Ruocco, Routes to gelation in a clay suspension, Phys. Rev. Lett., 2004, 93, 258301 CAS.
- B. Ruzicka, L. Zulian and G. Ruocco, Ergodic to non-ergodic transition in low concentration Laponite, J. Phys. Condens. Matter, 2004, 16, S4993–S5002 CAS.
- L. Zulian, B. Ruzicka and G. Ruocco, Influence of an adsorbing polymer on the aging dynamics of Laponite clay suspensions, Philosophical Magazine, 2008, 88, 4213–4221 CAS.
| This journal is © The Royal Society of Chemistry 2012 |
