 Open Access Article
Charge storage kinetics of interconnected MnO2 nano-needles/reduced graphene oxide composite for high energy density quasi-solid-state sodium ion asymmetric supercapacitor†
Deependra
Jhankal
a,
Mohammad Saquib
Khan
b,
Preeti
Shakya
b,
Nikita
Bhardwaj
a,
Bhanu
Yadav
a,
K. K.
Jhankal
c and
K.
Sachdev
 *ab
*ab
aDepartment of Physics, Malaviya National Institute of Technology, Jaipur 302017, India. E-mail: ksachdev.phy@mnit.ac.in
bMaterials Research Centre, Malaviya National Institute of Technology, Jaipur 302017, India
cDepartment of Chemistry, University of Rajasthan, Jaipur 302004, India
First published on 29th November 2023
Abstract
In this study, a facile synthesis route for preparing manganese dioxide (MnO2) with unique nano-needle morphology and its nanocomposite with reduced graphene oxide (MnO2–rGO) for high energy density quasi-solid-state asymmetric supercapacitor (ASC) application is reported. Morphological characterizations indicate that the MnO2 nano-needles are uniformly decorated on rGO sheets, creating an interconnected structure with rGO. The MnO2–rGO nanocomposite shows good pseudocapacitive electrochemical behavior in a potential domain from 0 to 1.0 V. The detailed analysis of the cyclic voltammetry (CV) profiles of the rGO and MnO2–rGO electrodes indicate that their sodium ion storage kinetics are based on ideal capacitive-controlled and pseudocapacitive (capacitive and diffusive) controlled processes, respectively. Furthermore, a quasi-solid-state ASC device is constructed by employing the MnO2–rGO nanocomposite and rGO as the positive and negative electrodes, respectively. The fabricated ASC (rGO‖MnO2–rGO) device operates within the wide cell potential range from 0 to 1.8 V and possesses the highest capacitance of 216 F g−1, at the current density of 1 A g−1, which is superior to that of the recently reported literatures. The ASC (rGO‖MnO2–rGO) device displays an energy density of 24.25 W h kg−1 at corresponding power density of 900 W kg−1 along with significant cycle stability over the 6000 cycles. Thus, the morphological design of an advanced electrode material to boost the capacitance and potential window with the polymer gel electrolyte will aid in the fabrication of high energy density storage devices.
1. Introduction
In the last decade, the global energy demand has increased exponentially due to the fast growth in the human population. Traditional energy resources (e.g., fossil fuels) are the key energy sources, but these are limited and largely contribute to global warming.1–3 In this regard, using renewable energy sources to stop the alarming global climate change is the primary research concern for scientific society. Energy storage technologies with high energy densities are essential to the long-term growth of renewable energy sources. Nowadays, supercapacitors (SCs) have great potential in advanced and sustainable storage devices because of their high energy density, long cyclability, fast charging–discharging processes, ultrahigh value of capacitance, flexibility, cost-effective, ease of fabrication, and eco-friendly nature.4–7Asymmetric supercapacitors (ASCs) are primarily utilized for the high energy density (E = 1/2CV2) energy storage devices by tuning the operating potential window of the device. The ASC contains two different types of electrodes, where one electrode (negative electrode) has an electric double layer capacitance (EDLC) and the other electrode (positive electrode) has the pseudocapacitive type of charge storage mechanism.8 Modern improved graphene-related materials are frequently utilized as negative electrode materials for ASCs because of their superior physiochemical features and greater surface area.9–11 Various pseudocapacitive metal oxides, such as V2O5, Co3O4, RuO2, and Fe3O4 have been widely employed as positive electrode materials for ASCs owing to their numerous valence states and higher theoretical specific capacitance.12–15 In comparison to other materials, MnO2 is a promising metal oxide for a high-performance pseudocapacitive material due to several outstanding features, such as its cost-effectiveness, abundant availability, high specific capacitance, low molecular weight, wide potential window in an aqueous electrolyte, and environmental friendliness.16–18 In the charge storage processes, the fast-reversible redox-reaction (MnO2 ↔ MnOOC, C = H+, K+, Na+, Li+) has occurred on the surface of MnO2, which enhances the capacitance.19,20 However, MnO2 still suffers from inferior electrochemical properties due to its lower electrical conductivity in the domain of 10−5 to 10−6 S cm−1 and limited cycle stability, which restrict its further practical applications.21,22
To overcome the abovementioned issues, several approaches have been adopted, such as the incorporation of MnO2 with polymers, graphene, and carbon nanotubes (CNTs), to enrich the electrochemical activity of MnO2.23–28 Among these approaches, the formation of the MnO2 nanocomposite with sp2 hybridized two-dimensional reduced graphene oxide (rGO) has received a lot of attention for SCs. In the nanocomposite, rGO not only acts as the high conductive support for MnO2, but also improves the rate performance by facilitating the fast charge transportation in the nanocomposite.29–31 Additionally, the morphologically modified nanostructure of MnO2 can cover a large surface area with the electrolyte, which can explore all available active sites, leading to enhancement of capacitance.
ASCs with wide potential windows have recently adopted various prospective strategies to boost the capacitive performance of MnO2. For instance, Gomaa prepared MnO2 nanoflowers as the positive electrode material for ASC in Na2SO4 electrolyte containing a maximum capacitance of 177.6 F g−1 at a current density of 0.25 A g−1.32 Liangshuo et al.33 used porous carbon and the MnO2 nanowire/porous carbon composite as negative and positive electrodes, respectively, for efficient ASC. The performance of the ASC device was enhanced due to the large surface area of the MnO2 nanowires, which facilitate the additional diffusion paths for feasible ions with the electrolyte. Geerthana et al.34 reported on rGO (negative electrode) and α-Fe2O3/MnO2/rGO (positive electrode) with PVA/KOH as the gel-electrolyte for an advanced ASC that contained a maximum energy density of 13.2 W h kg−1. Thus, to the best of our knowledge, the fabrication of MnO2 with a unique nano-needle morphology and its uniform distribution on rGO sheets as the positive electrode for sodium ion-based quasi-solid-state ASC has not been reported elsewhere.
Herein, we proposed a hydrothermal method for the synthesis of MnO2 with unique nano-needle morphology. Additionally, we synthesized rGO as the conducting support for MnO2 and as the negative electrode material for the ASC device by hydrothermal route. To enhance the electrochemical performance of MnO2, we synthesized the MnO2 nano-needle interconnected with rGO sheets (MnO2–rGO nanocomposite) by hydrothermal strategy. Additionally, the separator-less electrolyte, PVA/Na2SO4, was used to create the ASC device using MnO2–rGO and rGO as the positive and negative electrodes, respectively. The fabricated ASC (rGO‖MnO2–rGO) device was operated in a wide potential window (0–1.8 V), and exhibited the highest energy density of 24.5 W h kg−1 with significant cyclic stability.
2. Materials and methods
2.1. Materials
The following materials were provided by Alfa Aesar: acetylene black (>99%), sodium hydroxide (NaOH), hydrochloric acid (HCl – 35%), hydrogen peroxide (H2O2 – 30%), and graphite powder 325 mesh. Sodium nitrate (NaNO3 – 99%) and sulphuric acid (95–97%) were acquired from Fisher Scientific. From LOBA Chemicals, we purchased potassium permanganate (KMnO4 – 99%), isopropyl alcohol (IPA), and carboxymethyl cellulose (CMC, High pure).2.2. Synthesis of MnO2 nano-needles
MnO2 with unique nano-needle morphology was synthesized by hydrothermal method. Briefly, 60 mL of deionized (DI) water was used to dissolve 1 g of KMnO4, and the mixture was subsequently stirred continuously for 30 minutes. Then, 10 mL of HCl was added dropwise into the previous KMnO4 solution under stirring in order to obtain a homogenous solution. Then, the reaction mixture was heated for 16 hours at 140 °C in a Teflon-lined autoclave. After the reaction was finished, the brown colored precipitate was separated, washed and dried at 60 °C overnight. The obtained MnO2 nano-needles were annealed in a muffle furnace for three hours at 400 °C.352.3. Preparation of the MnO2–rGO nanocomposite
The hydrothermal technique was adopted for the preparation of the nanocomposite. To create a homogeneous solution, 70 mL of DI water was used to disperse 70 mg of MnO2 and 30 mg of rGO (the synthesis technique for GO and rGO is provided in the ESI†). Afterwards, the reaction mixture was poured into a Teflon-based autoclave, and heated in a hot air oven to 160 °C for 16 h. After the cooling down of the autoclave, a solid residue was then washed and dried at 60 °C overnight in a vacuum oven. Fig. S2 (ESI†) illustrates the synthesis strategy of MnO2 and the MnO2–rGO nanocomposite.2.4. Electrode preparation
In this study, a glassy carbon electrode (GCE) modified through electrochemical ink made from synthesized electrode materials was utilized as the working electrode. The electrochemical ink was formed by dissolving the active material (e.g., rGO, MnO2 and MnO2–rGO nanocomposite), acetylene black and CMC in IPA solution (8![[thin space (1/6-em)]](https://www.rsc.org/images/entities/char_2009.gif) :
:![[thin space (1/6-em)]](https://www.rsc.org/images/entities/char_2009.gif) 1
1![[thin space (1/6-em)]](https://www.rsc.org/images/entities/char_2009.gif) :
:![[thin space (1/6-em)]](https://www.rsc.org/images/entities/char_2009.gif) 1). The electrochemical results were recorded in 1 M Na2SO4 electrolyte.
1). The electrochemical results were recorded in 1 M Na2SO4 electrolyte.
2.5. Assembly of the asymmetric supercapacitor device
For the fabrication of the ASC device, the stainless steel (SS) foil (2 cm × 2 cm) was utilized as a current collector. The SS foil was covered with the electrochemical ink of rGO and MnO2–rGO using the drop-casting method, and the electrodes were heated at 120 °C for 12 hours. For the quasi-solid-state ASC device, a hydrogel membrane made of PVA and Na2SO4 was employed as the separator-less electrolyte. The mass loading ratio between the cathode (positive electrode) and anode (negative electrode) was calculated using charge balance eqn (S12) (in ESI†).3. Results and discussions
3.1. FE-SEM analysis
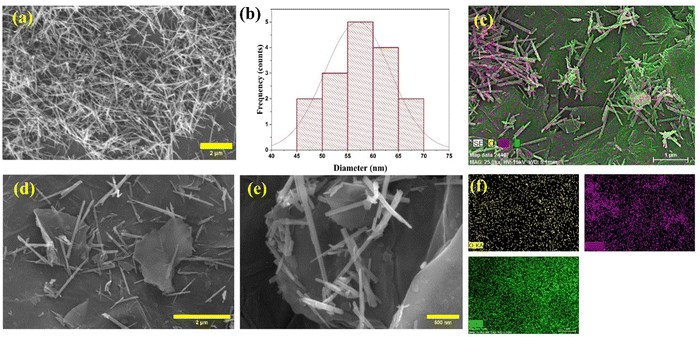
Fig. 1(a) illustrates the FE-SEM picture of the as-synthesized MnO2, indicating the nano-needle morphology of MnO2. The diameter variation of the nano-needles is shown by the particle size distribution histogram (Fig. 1(b)), which shows the diameter of these nano-needles varying from 52 nm to 65 nm. The FE-SEM images of the MnO2–rGO nanocomposite are depicted in Fig. 1(d and e), demonstrating that the MnO2 nano-needles are uniformly decorated on the rGO sheets, forming an interconnected heterostructure with the rGO sheets. The morphology enhances the electrochemical performance by preventing the restacking of graphene sheets and providing fast ion transport during electrochemical processes. Fig. 1(c and f) show the elemental mapping of the MnO2–rGO nanocomposite, which demonstrates that the sample has three major elements (Mn, O, and C) that are homogeneously dispersed.3.2. Raman analysis
Fig. 2(a) displays the results of the Raman spectroscopic study of the synthesized rGO, MnO2, and MnO2–rGO composite. The Raman spectrum of rGO exhibits two distinctive peaks, the D band and G band, which appear at ∼1352 cm−1 and ∼1584 cm−1, respectively. The D band emerges owing to the disorder and defects present in the graphene sample, while the G band appears due to the vibration of the C![[double bond, length as m-dash]](https://www.rsc.org/images/entities/char_e001.gif) C/C–C bonded carbon atoms.36 The Raman spectra of pure MnO2 has two prominent peaks at ∼568.3 cm−1 and ∼630.6 cm−1, corresponding to the stretching vibration of the Mn–O and MnO6 octahedral group of MnO2, respectively.37,38 The Raman spectrum of the MnO2–rGO nanocomposite possesses both D and G bands, along with two prominent peaks of MnO2, which suggests the presence of both MnO2 nano-needles and rGO sheets. The slightly high value of ID/IG for MnO2–rGO (1.02), as compared to rGO (0.98), indicates an increase in defects on the rGO sheets in MnO2–rGO by coupling of the MnO2 nano-needles. The morphology of the nano-composite ensures congruence between the MnO2 nano-needles and rGO sheets, boosting the nanocomposite's electrochemical capabilities.39,40
C/C–C bonded carbon atoms.36 The Raman spectra of pure MnO2 has two prominent peaks at ∼568.3 cm−1 and ∼630.6 cm−1, corresponding to the stretching vibration of the Mn–O and MnO6 octahedral group of MnO2, respectively.37,38 The Raman spectrum of the MnO2–rGO nanocomposite possesses both D and G bands, along with two prominent peaks of MnO2, which suggests the presence of both MnO2 nano-needles and rGO sheets. The slightly high value of ID/IG for MnO2–rGO (1.02), as compared to rGO (0.98), indicates an increase in defects on the rGO sheets in MnO2–rGO by coupling of the MnO2 nano-needles. The morphology of the nano-composite ensures congruence between the MnO2 nano-needles and rGO sheets, boosting the nanocomposite's electrochemical capabilities.39,40
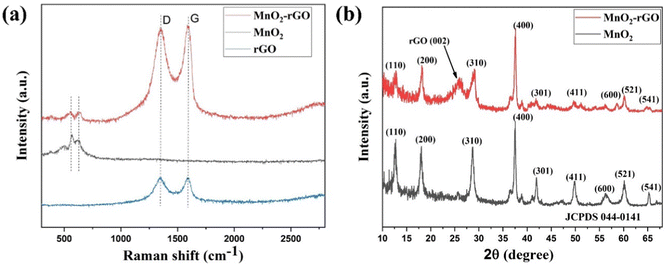 | ||
| Fig. 2 (a) Raman spectrum of rGO, pure MnO2 and MnO2–rGO, (b) XRD pattern of pure MnO2 and MnO2–rGO. | ||
3.3. XRD study
The XRD study of MnO2 and MnO2–rGO were performed to analyze the crystal structure, phase and purity, which are illustrated in Fig. 2(b). The XRD spectra of pure MnO2 shows major peaks at 2θ = 12.7°, 18.1°, 28.8°, 36.6°, 37.52°, 41.96°, 49.86°, 56.37°, 60.27°, 69.71°, and 78.59°, corresponding to the (110), (200), (310), (400), (211), (301), (411), (600), (521), (542) and (332) crystal planes of α-MnO2.41 The position and intensity of all diffraction peaks coincide with JCPDS card No. 044-0141 with a tetragonal structure and the space group of 14/m. No extra peaks appear in the XRD pattern of MnO2, indicating that the sample is in a pure phase without any impurities. Fig. S3 (ESI†) indicates the XRD pattern of rGO, which shows a broad peak at 24.6° that corresponds to the (002) plane.42 The XRD pattern of MnO2–rGO shows a broad peak at 2θ = 24.6° corresponding to the rGO (002) plane, along with all prominent peaks of MnO2.43 The sharp peaks of both MnO2 and the MnO2–rGO nanocomposite suggest the good crystalline nature of the synthesized samples. Additionally, the crystallite size D (nm) of the synthesized samples was evaluated by Scherrer's equation: | (1) |
Here, λ, K, β and θ symbolize the wavelength of the X-ray source (1.54 Å for Cu Kα), Scherrer's constant (0.9), FWHM (radian) of the peak and peak position, respectively.44 The observed average crystallite size of the pure MnO2 and MnO2–rGO nanocomposite are 22.37 nm and 19.24 nm, respectively. In the case of the MnO2–rGO nanocomposite, the reduced average crystallite size can further improve the performance of the nanocomposite.
3.4. XPS analysis
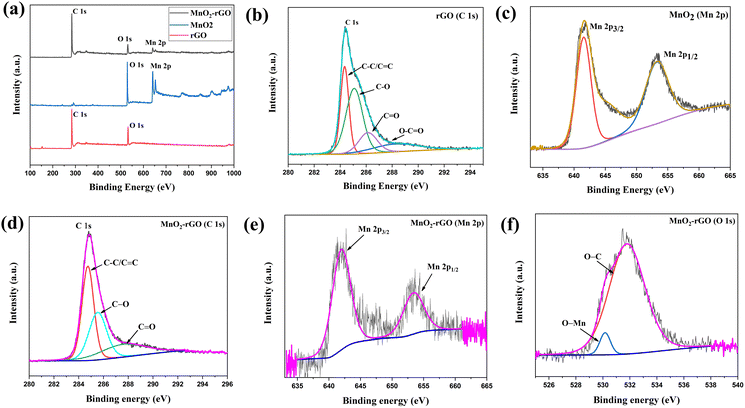
In the survey spectra of rGO (Fig. 3(a)), only two peaks are observed, corresponding to C 1s and O 1s without having any other impurity elemental peaks. The high-resolution C 1s spectra (Fig. 3(b)) contain four major peaks that arise at 284.5, 285.1, 286.1 and 288.3 eV and correspond to C–C/C![[double bond, length as m-dash]](https://www.rsc.org/images/entities/char_e001.gif) C, C–O, C
C, C–O, C![[double bond, length as m-dash]](https://www.rsc.org/images/entities/char_e001.gif) O and O–C
O and O–C![[double bond, length as m-dash]](https://www.rsc.org/images/entities/char_e001.gif) O, respectively.45,46 Additionally, the XPS analysis of MnO2 was performed to observed its surface element compositions. The wide range survey spectra of MnO2 (Fig. 3(a)) illustrate the existence of the intense peaks of O 1s and Mn 2p without any impurity elemental peaks. The deconvolution spectra of Mn 2p (Fig. 3(c)) display the two sub-peaks occurring at 641.5 and 653.2 eV that correspond to Mn 2p3/2 and Mn 2p1/2, respectively, indicating the +4 oxidation state of Mn. The full range survey spectra of the MnO2–rGO nanocomposite (Fig. 3(a)) shows that MnO2–rGO exhibits the major peaks of C 1s, O 1s, and Mn 2p with the corresponding binding energies of 286 eV, 532 eV, and 650 eV, respectively. Fig. 3(d) illustrates the deconvolution XPS spectrum of C 1s, which acquires three major peaks at 284.8 eV, 285.5 eV and 287.6 eV. The peak at 284.7 eV is ascribed to C–C/C
O, respectively.45,46 Additionally, the XPS analysis of MnO2 was performed to observed its surface element compositions. The wide range survey spectra of MnO2 (Fig. 3(a)) illustrate the existence of the intense peaks of O 1s and Mn 2p without any impurity elemental peaks. The deconvolution spectra of Mn 2p (Fig. 3(c)) display the two sub-peaks occurring at 641.5 and 653.2 eV that correspond to Mn 2p3/2 and Mn 2p1/2, respectively, indicating the +4 oxidation state of Mn. The full range survey spectra of the MnO2–rGO nanocomposite (Fig. 3(a)) shows that MnO2–rGO exhibits the major peaks of C 1s, O 1s, and Mn 2p with the corresponding binding energies of 286 eV, 532 eV, and 650 eV, respectively. Fig. 3(d) illustrates the deconvolution XPS spectrum of C 1s, which acquires three major peaks at 284.8 eV, 285.5 eV and 287.6 eV. The peak at 284.7 eV is ascribed to C–C/C![[double bond, length as m-dash]](https://www.rsc.org/images/entities/char_e001.gif) C, whereas the peaks at 285.5 eV and 287.6 eV are attributed to the hydroxyl (C–O) and carbonyl (C
C, whereas the peaks at 285.5 eV and 287.6 eV are attributed to the hydroxyl (C–O) and carbonyl (C![[double bond, length as m-dash]](https://www.rsc.org/images/entities/char_e001.gif) O) groups, respectively.47,48Fig. 2(e) depicts the high-resolution XPS Mn 2p spectrum, which exhibits two sub-components at 641.9 eV and 653.6 eV that are ascribed to the Mn 2p3/2 and Mn 2p1/2 states of MnO2, respectively.48 It should be noted that the peak difference between Mn 2p3/2 and Mn 2p1/2 for both MnO2 and MnO2–rGO is approximately the same (11.7 eV), which demonstrates that MnO2 maintains its stoichiometry during the formation of the composite with rGO. These components are assigned to the +4 oxidation state of MnO2. Furthermore, the core level O 1s spectra of the MnO2–rGO nanocomposite (Fig. 3(f)) shows two peaks: one peak at 531 eV that is ascribed to O bonded with manganese (Mn–O) in MnO2, and the other one at 532 eV is assigned to the O–C band of graphene.49
O) groups, respectively.47,48Fig. 2(e) depicts the high-resolution XPS Mn 2p spectrum, which exhibits two sub-components at 641.9 eV and 653.6 eV that are ascribed to the Mn 2p3/2 and Mn 2p1/2 states of MnO2, respectively.48 It should be noted that the peak difference between Mn 2p3/2 and Mn 2p1/2 for both MnO2 and MnO2–rGO is approximately the same (11.7 eV), which demonstrates that MnO2 maintains its stoichiometry during the formation of the composite with rGO. These components are assigned to the +4 oxidation state of MnO2. Furthermore, the core level O 1s spectra of the MnO2–rGO nanocomposite (Fig. 3(f)) shows two peaks: one peak at 531 eV that is ascribed to O bonded with manganese (Mn–O) in MnO2, and the other one at 532 eV is assigned to the O–C band of graphene.49
3.5. TEM analysis of the MnO2–rGO nanocomposite
The surface morphology, interlayer distance, and d-spacing of the MnO2–rGO nanocomposite were examined using the TEM, HR-TEM, and selected area diffraction (SAD) pattern. Fig. 4(a) shows the TEM images of MnO2–rGO at various resolutions where uniformly distributed MnO2 nano-needles are seen on the rGO sheets, making an interconnected heterostructure, which would facilitate the fast ion/electron transport during charging/discharging. Fig. 4(b and c) displays the HR-TEM images of the MnO2–rGO nanocomposite, which shows the layered lattice fringes of MnO2 with an interlayer spacing of 0.55 nm. The SAED pattern of the MnO2–rGO nanocomposite is depicted in Fig. 4(d), which shows the diffraction spots corresponding to the (110), (200), (310) and (400) crystal planes of tetragonal α-MnO2, suggesting the good crystallinity of the MnO2 nano-needle morphology in the MnO2–rGO nanocomposite.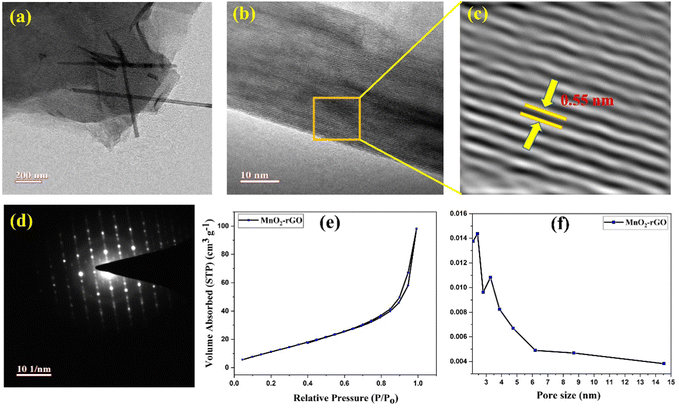 | ||
| Fig. 4 (a) TEM images, (b) and (c) HR-TEM pictures and (d) SAED pattern of the MnO2–rGO nanocomposite. (e) BET curve and (f) pore size distribution curve of the MnO2–rGO nanocomposite. | ||
3.6. BET Analysis of the MnO2–rGO nanocomposite
As an effective surface area is a crucial characteristic for the electrode material, the multipoint surface area and pore size distribution of the MnO2–rGO nanocomposite was governed by N2 adsorption/desorption isotherms technique (BET Analysis), as depicted in Fig. 4(e) and Fig. 4(f), respectively. The shape of Fig. 4(e) suggests the mesoporous structure of the MnO2–rGO nanocomposite.50 The mesoporosity arises due to the interconnected MnO2 nano-needles with interspersed rGO sheets, providing a unique and advantageous morphology to the sample. The specific surface area of the MnO2–rGO nanocomposite was obtained as 49.92 m2 g−1. The average pore size and pore volume in the MnO2–rGO nanocomposite was measured to be 1.52 nm and 0.147 cm3 g−1, respectively. The appropriate multipoint surface area and mesoporous structure of the MnO2–rGO nanocomposite play a vital role in efficient ions/electrons transport, and also facilitate the large number of diffusion channels for massive charge storage during electrochemical processes, therefore enhancing the overall electrochemical performance of the nanocomposite.4. Electrochemical characterizations
4.1. Electrochemical study of rGO electrode (negative electrode)
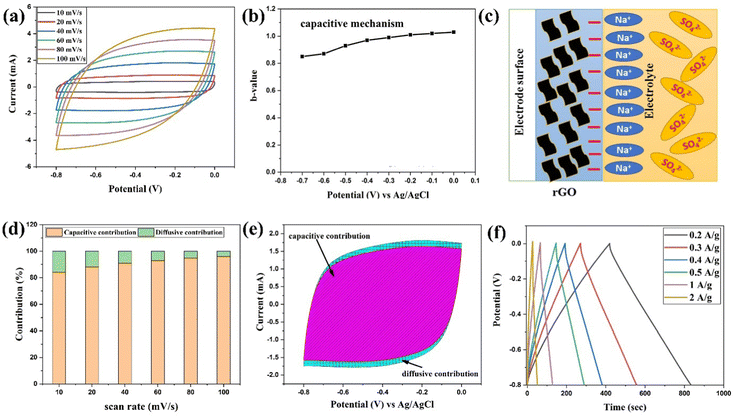
The CV profiles for the rGO-electrode were recorded in 1 M aqueous Na2SO4 electrolyte within the potential range of −0.8 V to 0 V at various sweep rates (10 mV s−1 to 100 mV s−1), and are depicted in Fig. 5(a). The CV curves show an almost rectangular shape, revealing the ideal capacitive nature of rGO. The CV curves maintain their shape at higher scan rates, without exhibiting any signal deformation, demonstrating the electrode material's superior electrochemical reversibility and stability.51 Additionally, a comprehensive analysis of the CV profile was carried out to observe the charge-storage mechanisms in the rGO-electrode utilizing the power law:52,53| i = aυb | (2) |
log![[thin space (1/6-em)]](https://www.rsc.org/images/entities/char_2009.gif) i = b i = b![[thin space (1/6-em)]](https://www.rsc.org/images/entities/char_2009.gif) log log![[thin space (1/6-em)]](https://www.rsc.org/images/entities/char_2009.gif) υ + log υ + log![[thin space (1/6-em)]](https://www.rsc.org/images/entities/char_2009.gif) a a | (3) |
![[thin space (1/6-em)]](https://www.rsc.org/images/entities/char_2009.gif) i vs. log
i vs. log![[thin space (1/6-em)]](https://www.rsc.org/images/entities/i_char_2009.gif) υ provide the value of b, and this b value describes the type of charge storage kinetics of the electrode, such as non-faradaic capacitive processes (b = 1), diffusion-controlled battery type processes (b = 0.5) and pseudocapacitive processes (fast redox reactions on surface, 0 < b < 1).54 Fig. S4(a) (in ESI†) shows the linear fit curve between log
υ provide the value of b, and this b value describes the type of charge storage kinetics of the electrode, such as non-faradaic capacitive processes (b = 1), diffusion-controlled battery type processes (b = 0.5) and pseudocapacitive processes (fast redox reactions on surface, 0 < b < 1).54 Fig. S4(a) (in ESI†) shows the linear fit curve between log![[thin space (1/6-em)]](https://www.rsc.org/images/entities/char_2009.gif) i vs. log
i vs. log![[thin space (1/6-em)]](https://www.rsc.org/images/entities/char_2009.gif) υ for the rGO electrode at different applied voltages. The obtained b values at different voltages are shown in Fig. 5(b), which are found to vary between 1 to 1.15, suggesting the pure capacitive type of nature of the rGO-electrode by creation of the double layer of charge on the electrode and electrolyte interface, as depicted in Fig. 5(c).
υ for the rGO electrode at different applied voltages. The obtained b values at different voltages are shown in Fig. 5(b), which are found to vary between 1 to 1.15, suggesting the pure capacitive type of nature of the rGO-electrode by creation of the double layer of charge on the electrode and electrolyte interface, as depicted in Fig. 5(c).
Furthermore, the storage process of electrodes was determined by Dunn's method, specified by the below equation:55
| i (V) = a1υ + a2υ1/2 | (4) |
Here, a1υ denotes the non-diffusive limited process, while a2υ1/2 signifies the diffusive controlled kinetics process. For ease of calculation, re-design the above equation to:
 | (5) |
A curve of i (V)/υ1/2vs. υ1/2 gives the value of a1 (slope) and a2 (intercept). Fig. S4(c) (ESI†) shows the linear fit plot between υ1/2vs. i (V)/υ1/2 for the rGO-electrode at different applied voltages. The variation of percentage contribution of each process (non-diffusive and diffusive limited) along with several scan rates are mentioned in Fig. 5(d), which shows that the contribution of the non-diffusive process has a progressively growing tendency, indicating the capacitive-controlled nature of the rGO-electrode. The dominating nature of the non-faradaic capacitive process of the rGO-electrode is favorable for the long-term device cyclic stability.53 The rGO-electrode possesses 94% contribution of the non-faradaic limited process, as depicted in Fig. 5(e). This suggests the dominance of the capacitive-controlled kinetics of the electrode, which makes the rGO-electrode as the negative electrode for the ASC device. In an ASC device, the general electrode reaction at the graphene-based negative electrode during charging/discharging can be described as follows:56
| Graphene + Na+ + e− ↔ Graphene/Na+ | (6) |
Fig. 5(f) illustrates the GCD profiles of the rGO electrode, which shows a nearly triangular shape, again indicating the capacitive behavior of the electrode. From eqn (S2) (ESI†), the obtained values of the specific capacitance (Csp) are 105.5 F g−1, 108.75 F g−1, 96.5 F g−1, 90.6 F g−1, 82.5 F g−1 and 65 F g−1 at a current density of 0.2 A g−1, 0.3 A g−1, 0.4 A g−1, 0.5 A g−1, 1 A g−1 and 2 A g−1, respectively.
4.2. Electrochemical study of MnO2–rGO-electrode (positive electrode)
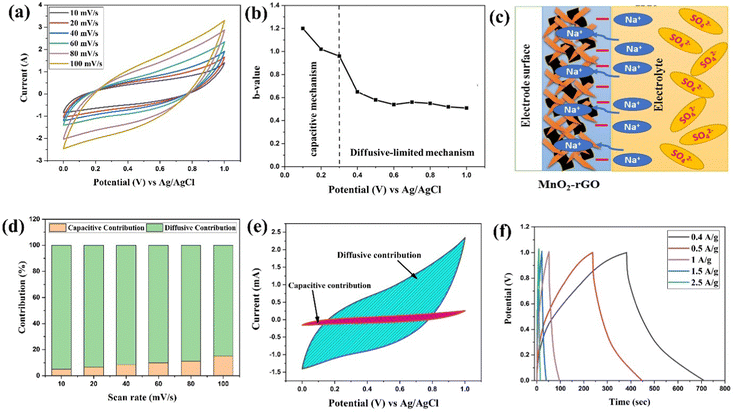
The CV profiles of MnO2 and the MnO2–rGO-electrode were recorded at 100 mV s−1 in the potential range 0 to 1 V, and are depicted in Fig. S5 (ESI†). The CV profiles show the MnO2–rGO-electrode possessing a high loop area, indicating a high value of capacitance as compared to the MnO2-electrode. The high capacitance of the MnO2–rGO-electrode could be attributed to the synergistic effect in the MnO2–rGO nanocomposite caused by the significant pseudocapacitive contribution of MnO2 and the high electronic conductivity of the rGO sheets.25 The quasi-rectangular CV curves of the MnO2–rGO-electrode at several sweep rates are depicted in Fig. 6(a), proposing the pseudocapacitive nature of the charge storage of the MnO2–rGO-electrode. The CV curve maintains its shape at all sweep rates, which reveals the improved stability of the electrode material.51 The interconnected structure of the MnO2/rGO nanocomposite could facilitate numerous diffusion channels for fast faradaic reactions. Furthermore, the interconnected structure can reduce the diffusion length of the electrolyte ions, which provide a faster permeation of ions to the porous MnO2/rGO composite electrode material, resulting in a high value of capacitance and stability of the electrode even at a higher scan rate.57The b value in the applied potential domain of 0 V to 1 V was evaluated from the linear fit curve between log![[thin space (1/6-em)]](https://www.rsc.org/images/entities/char_2009.gif) i vs. log
i vs. log![[thin space (1/6-em)]](https://www.rsc.org/images/entities/char_2009.gif) υ of the MnO2–rGO-electrode at different applied voltages, which is depicted in Fig. S4(b) (in ESI†). The obtained b values (Fig. 6(b)) are found to be in the range of 1.2 to 0.95 at lower potential (0.1 V to 0.3 V), indicating the charge storage at lower potentials to be largely due to the capacitive processes. Conversely, the b values of 0.55 to 0.45 occur at higher potentials (>0.3 V), suggesting the charge storage mechanism of the MnO2–rGO-electrode (Fig. 6(c)) to be predominantly diffusion-controlled for potentials greater than 0.3 V. The faradaic diffusive mechanism is more dominating in the MnO2–rGO-electrode due to the presence of MnO2 nano-needles on the surface of the rGO sheets, which provide a hetero-interface to the intercalation/de-intercalation of the electrolyte ions. Fig. S4(d) (ESI†) shows the linear fit plot between υ1/2vs. i (V)/υ1/2 for the MnO2–rGO electrode at different applied voltages. Fig. 6(d) represents the variation of the percentage contribution of the non-diffusive (capacitive) and diffusion-limited processes along with several scan rates, which indicates that the dominance of the diffusion-controlled contribution of the total current response of the MnO2–rGO electrode. Fig. 6(e) depicts the CV curve of the MnO2–rGO-electrode at a scan rate of 40 mV s−1, indicating that 88% of the total current response is because of the diffusive-controlled kinetics. This reveals the dominance of the faradaic diffusive kinetics of electrode, resulting in a superior positive electrode for ASC application. The charge storage kinetics of MnO2 in the Na2SO4 aqueous electrolyte, which include both intercalation/de-intercalation processes and adsorption/desorption, are described by the following equations:58,59
υ of the MnO2–rGO-electrode at different applied voltages, which is depicted in Fig. S4(b) (in ESI†). The obtained b values (Fig. 6(b)) are found to be in the range of 1.2 to 0.95 at lower potential (0.1 V to 0.3 V), indicating the charge storage at lower potentials to be largely due to the capacitive processes. Conversely, the b values of 0.55 to 0.45 occur at higher potentials (>0.3 V), suggesting the charge storage mechanism of the MnO2–rGO-electrode (Fig. 6(c)) to be predominantly diffusion-controlled for potentials greater than 0.3 V. The faradaic diffusive mechanism is more dominating in the MnO2–rGO-electrode due to the presence of MnO2 nano-needles on the surface of the rGO sheets, which provide a hetero-interface to the intercalation/de-intercalation of the electrolyte ions. Fig. S4(d) (ESI†) shows the linear fit plot between υ1/2vs. i (V)/υ1/2 for the MnO2–rGO electrode at different applied voltages. Fig. 6(d) represents the variation of the percentage contribution of the non-diffusive (capacitive) and diffusion-limited processes along with several scan rates, which indicates that the dominance of the diffusion-controlled contribution of the total current response of the MnO2–rGO electrode. Fig. 6(e) depicts the CV curve of the MnO2–rGO-electrode at a scan rate of 40 mV s−1, indicating that 88% of the total current response is because of the diffusive-controlled kinetics. This reveals the dominance of the faradaic diffusive kinetics of electrode, resulting in a superior positive electrode for ASC application. The charge storage kinetics of MnO2 in the Na2SO4 aqueous electrolyte, which include both intercalation/de-intercalation processes and adsorption/desorption, are described by the following equations:58,59
| (MnO2)surface + Na+ + e− ↔ (MnO2n–Na+)surface | (7) |
| MnO2 + Na+ + e− ↔ MnOONa | (8) |
Fig. 6(f) displays the GCD measurements in 1 M Na2SO4 electrolyte of the MnO2–rGO-electrode at different applied current densities. The GCD curves are not exactly triangular in shape, which shows that the electrode has pseudocapacitive charge storage characteristics. The calculated values of Csp (using eqn (S2), ESI†) are 132.8 F g−1, 108.5 F g−1, 53 F g−1, 31.5 and 22.5 F g−1 at a current density of 0.4 A g−1, 0.5 A g−1, 1 A g−1, 1.5 A g−1 and 2 A g−1, respectively. It can be observed that even at a high current density, the MnO2–rGO-electrode maintains a high value of capacitance. This suggests the good reversibility of the MnO2–rGO-electrode, which could arise due to the combined effect of the MnO2–rGO nanocomposite where the MnO2 nano-needles interconnected structure (with the rGO sheets) facilitates the highly interconnected diffusive channels for fast transportation of the electrolyte ions/electrons.60,61
4.3. EIS study of rGO, MnO2 and MnO2–rGO-electrodes
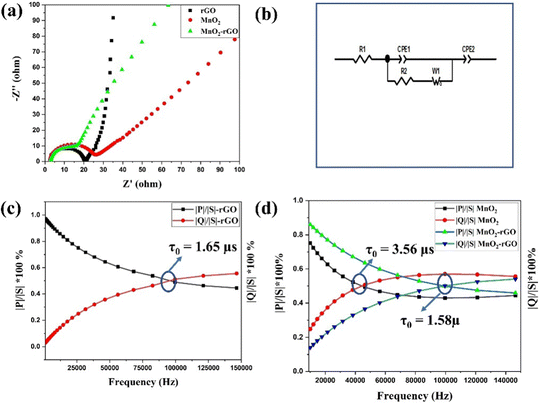
EIS spectroscopy was employed to assess the electrodes’ charge transfer resistance and interfacial kinetics. The EIS Nyquist plots of rGO, MnO2 and the MnO2–rGO-electrodes in the frequency domain of 1 MHz to 1 mHz are depicted in Fig. 7(a). The Nyquist plots of all three electrodes have mainly two regimes; that is, the high frequency semicircle and well-known low frequency linear Warburg zone. The equivalent circuit of the EIS study (Fig. 7(b)) was drawn for a better understanding of the electrode behavior, which involved primarily four elements: series resistance (Rs), charge transfer resistance (Rct), and two constant phase elements (CPEs) (because to the distribution of uniform responses on the porous electrode surface, CPE is being considered in place of an ideal capacitor). CPE1 is created by the adsorption of ions, which results in the development of an electric double layer capacitance (EDLC), whereas CPE2 is created by the transport of electrolyte ions between the electrode and electrolyte interface, which results in the creation of pseudocapacitance.62 The intercept of a semicircle on the real axis provides the value of Rs, while the width of the semicircle is known as the faradaic charge transfer resistance (Rct).63 The observed values of Rs and Rct for rGO, MnO2 and the MnO2–rGO electrode are mentioned in Table S1 (ESI†). The lowest value of Rct for the MnO2–rGO-electrode (12.14 Ω) is due to the synergistic effect of both MnO2 and rGO, which provide the fast electron transfer during charging/discharging, and boost the capacitive effectiveness of the electrode. Additionally, the complex power was analyzed from the EIS spectra to evaluate the operational response time of the fabricated electrodes. The complex power (|S|) of an electrochemical system is described by-| |S(ω)| = |P(ω) + jQ(ω)| | (9) |
Here, P(ω) and Q(ω) represent the real part and imaginary part of the complex power, respectively. The P(ω) and Q(ω) are also known as active and reactive power, respectively.
| |P(ω)| = ωC′′(ω)|Erms|2 | (10) |
| |Q(ω)| = ωC′(ω)|Erms|2 | (11) |
Here, C′′ and C′ are known as the imaginary and real parts of the capacitance, which are further defined by –
 | (12) |
 | (13) |
Fig. 7(c and d) shows the change in active power (|P|/|S|) and reactive power (|Q|/|S|) along with frequency for rGO, MnO2, and the MnO2–rGO electrodes. The active power (|P|/|S|) is mainly contributed by power dissipated at high frequency, whereas the reactive power (|Q|/|S|) is primarily contributed by power dissipated at high frequency, and the supercapacitor acts as pure resistor and pure capacitor in the first and second conditions, respectively. The operational response time (τ0) is a crucial parameter for a supercapacitor, which describes the minimum time in which a supercapacitor changes its state from resistive behavior to capacitive behavior.64 The τ0 is determined by the following equation:
 | (14) |
Here, f0 represents the characteristic frequency, which is obtained from the intersect frequency point of the |P|/|S| and |Q|/|S| curves. The calculated values of τ0 for the rGO, MnO2 and MnO2–rGO-electrodes are 1.65 μs, 3.5 μs and 1.58 μs, respectively. The smaller value of τ0 for the MnO2–rGO-electrode as compared to that of MnO2 shows the benefit of the composite for the superior electrochemical performance of the supercapacitor. To further illustrate the charge storage kinetics, the Bode-phase diagrams (variation of the phase angle (Φ) with respect to frequency) of rGO, MnO2 and MnO2–rGO-electrode were constructed, as shown in Fig. S6 (ESI†). The value of Φ defines the different rate-limiting kinetics, such as Φ = 0° for ideal resistive behavior, whereas Φ = −90° and Φ = −45° correspond to the ideal capacitive and diffusive-controlled processes, respectively. The observed value of Φ for the rGO electrode is −82° (close to capacitive behavior) at low frequency (10 mHz), which shows the ideal capacitive nature of the rGO-electrode. It can be observed that Φ = −35° for MnO2 and Φ = −65° for the MnO2–rGO-electrode, which shows the nearly diffusive-controlled and pseudocapacitive (capacitive and diffusive) behavior of these materials, respectively.65 The pseudocapacitive nature of the MnO2–rGO-electrode is attributed to the synergistic effect of the interconnected structure of the MnO2–rGO nanocomposite, where MnO2 and rGO contribute to the diffusive and capacitive capacitance, resulting in enhanced electrochemical performance of the electrode.
4.4. Electrochemical performance of fabricated ASC (rGO‖MnO2–rGO) device
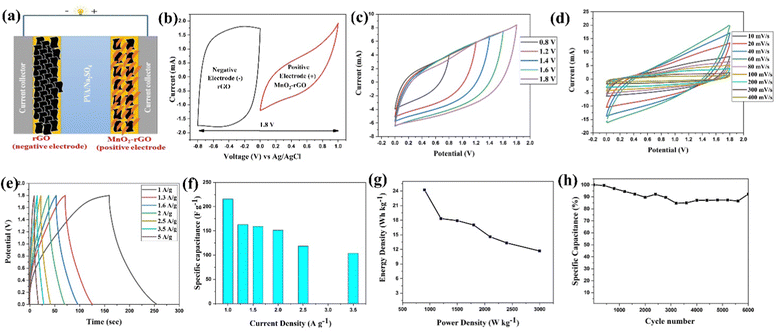
For practical utilization, the fabricated ASC (rGO‖MnO2–rGO) device (Fig. 8(a)) was investigated by CV, GCD and EIS techniques. The mass ratio (m+/m−) was determined using the charge balance equation (eqn (S8), ESI†) to assemble the ASC device, and it was found to be 0.57. Fig. 8(b) shows the CV curves of the rGO and MnO2–rGO-electrodes at 40 mV s−1, which show that the rGO and MnO2–rGO-electrodes operated in negative (0 to −0.8 V) and positive (0 to 1 V) potential windows, respectively, for better performances (as discussed above). So, the ASC (rGO‖MnO2–rGO) device was designed to operate in the potential range of 0 to 1.8 V for superior performance. The CV curves of the ASC (rGO‖MnO2–rGO) device for different cell potential windows at 100 mV s−1 are depicted in Fig. 8(c). It is seen that the CV curves maintain the shape at every potential window without any significant distortion, indicating good voltage stability of the device. Fig. 8(d) shows the CV profile of the ASC (rGO‖MnO2–rGO) device at increasing scan rates from 10 to 400 mV s−1 in the wide cell potential window of 0 to 1.8 V. Even at higher scan rates, the CV voltammograms of the ASC device preserve their shape without any signal distortion, indicating the device's good cyclic stability and reversibility.The specific capacitance (Csp) values of the fabricated ASC (rGO‖MnO2–rGO) device at different current densities are obtained from the GCD profiles, shown in Fig. 8(e). The GCD curves are observed to have a substantially symmetric triangular shape, indicating the good Coulombic efficiency of the ASC (rGO‖MnO2–rGO) device. The obtained values of Csp (using eqn (S3), ESI†) are 216 F g−1, 163 F g−1, 160 F g−1, 151 F g−1, 118 F g−1 and 104 F g−1 at applied current densities of 1 A g−1, 1.3 A g−1, 1.6 A g−1, 2 A g−1, 2.5 A g−1 and 3.5 A g−1, respectively. The values of Csp at increasing current densities are gradually decreasing, as shown in Fig. 8(f). This shows that the ASC (rGO‖MnO2–rGO) device retains good capacitance at higher current densities, implying the superior rate capability of the ASC device.66 The GCD plots of the ASC device at varying cell potential and the calculated specific capacitance (Csp) (using eqn (S3), ESI†) as the function of cell potential are depicted in Fig. S7(a) and (b) (ESI†), respectively. It should be noted that the value of Csp is gradually enhanced from 101 F g−1 to 163 F g−1 as the potential window rises from 1 V to 1.8 V, revealing the effectiveness of the fabricated ASC device with a wide potential window (as in our case here) in improving the capacitance in SCs. The Ragone plot (Fig. 8(g)) shows that the ASC device possesses the highest energy density of 24.25 W h kg−1 along with a power density of 900 W kg−1, and maintains it to 11.8 W h kg−1 with a power density of 3000 W h kg−1. Fig. 8(h) represents the capacity retention of the ASC device over 6000 GCD cycles at a current density of 5 A g−1. It is observed that the device exhibited ∼90% retention over 6000 cycles.
Table 1 shows the comparative study of the electrochemical performance of the fabricated quasi solid-state sodium ion ASC (rGO‖MnO2–rGO) device with recent literature reports based on MnO2–rGO as the positive electrode for the ASC device. Notably, the specific capacity, energy density and power capability of the ASC (rGO‖MnO2–rGO) device are superior to other reported results due to the interconnected porous structure of the MnO2 nano-needles and rGO sheets, which enhances the conductivity and provides a diffusion pathway for the intercalation and de-intercalation of the electrolyte ions. Additionally, the usage of the quasi solid-state sodium ion-based hydrogel membrane (PVA-Na2SO4) electrolyte plays a role in enhancing the ionic conductivity and electrode–electrolyte interface, and providing an increased cell potential of the device.
| S. No. | Anode material | Cathode material | Morphology of MnO2 | Electrolyte | C sp (F g−1) | Energy density (W h kg−1) | Power density (W kg−1) | Ref. |
|---|---|---|---|---|---|---|---|---|
| 1. | rGO | MnO 2 –rGO | Nano-needle | PVA/Na 2 SO 4 | 216 at 1 A g −1 | 24.25 | 900 | This work |
| 2. | rGO | Fe2O3/MnO2/rGO | Nanorod | PVA/KOH | 97 at 1 A g−1 | 20.4 | 2099 | 34 |
| 3. | rGO | MnO2 NF | Nano flower | 1 M Na2SO4 | 177.6 at 0.25 A g−1 | 24.7 | 360.9 | 32 |
| 4. | rGO | MnO2–rGO | Layer | PAAS/Na2SO4 | 27 F/g at 1 A g−1 | 11.7 | 441 | 67 |
| 5. | AC | MnO2–rGO | Nano-needle | 1 M Na2SO4 | 140 at 0.5 A g−1 | 21 | 100 | 68 |
| 6. | Porous carbon | MnO2–porous carbon | Nanowire | 1 M Na2SO4 | 24 at 0.2 A g−1 | 20.8 | 250 | 33 |
| 7. | N-CNTs | N–CNTs/MnO2 | Nanotube | 0.5 M Li2SO4 | 46.8 at 1 mA cm−2 | 20.9 | 224 | 25 |
| 8. | N–P co doped carbon | MnO2–N–P co doped carbon | Nanosheet | 1 M Na2SO4 | 71.58 at 0.5 A g−1 | 32.21 | 449.8 | 69 |
Fig. S7(c) (ESI†) shows the Nyquist plot of the ASC (rGO‖MnO2–rGO) device before and after cycling in the frequency domain of 1 MHz to 1 mHz. The inset of Fig. S7(c) (ESI†) represents the equivalent circuit diagram. The obtained values of Rs and Rct before and after cycling are reviewed in Table S2 (in ESI†). This indicates that the value of Rct is increased after cycling due to the continuous ion insertion/de-insertion, which damages the matrix, resulting in reduction of electrochemical sites and hence the capacitance decreases. Furthermore, to better understand the kinetics, the diffusion coefficient of the Na+ ions was also extracted from the EIS spectra. The diffusion coefficient (D, cm2 s−1) was computed using eqn (S6) (ESI†). Fig. S6(d) (ESI†) depicts the curve of (Z′) vs. ω−0.5 for the ASC device before and after cycling at lower frequency. The calculated value of D of Na+ ions before and after cycling are mentioned in Table S2 (ESI†). The value of D after the cycling reduces to 1.49 × 10⁻¹⁰ from 2.15 × 10⁻¹⁰ cm2 s−1. This reduction is ascribed to the distortion of the inter-connected porous structure of the MnO2–rGO nanocomposite during the operation. Fig. S8 (ESI†) shows the fabricated actual ASC device with taking electrochemical results, and with lighting a 1.5 V bulb.
The charge storage kinetics of the ideal capacitive (EDLC)-type behavior of rGO and both capacitive and diffusive-like behavior of the MnO2–rGO nanocomposite for the advanced 1.8 V quasi solid-state sodium ion ASC are depicted in Fig. 9. In the MnO2–rGO nanocomposite (positive electrode), the synergistic effect of the interconnected MnO2 nano-needles with the rGO sheets not only improves the pseudocapacitive contribution, but also enhances the conductivity of the MnO2–rGO nanocomposite. This results in high capacitance and good cycle stability.17 On the other hand, the rGO sheets make it possible for the ASC device to have a significant surface area and superior conductivity, which increases the capacitive contribution.30 Therefore, the fabricated 1.8 V quasi solid-state ASC (rGO‖MnO2–rGO) device shows a large specific capacitance, as well as high energy density and better performance, as compared to the recently reported ASCs with MnO2–rGO as the positive electrode material.
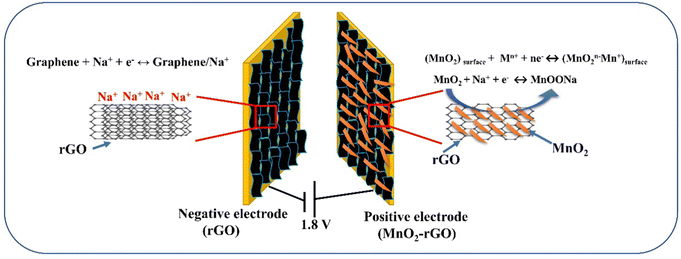 | ||
| Fig. 9 Charge storage mechanism of the wide 1.8 V voltage window quasi solid-state sodium ion ASC (rGO‖MnO2–rGO) device. | ||
5. Conclusion
In summary, a unique interconnected MnO2 nanoneedles/rGO composite has been prepared by a simple hydrothermal route for utilization as the positive electrode material for an advanced sodium ion quasi-solid-state asymmetric supercapacitor (ASC). The electrochemical results in the three-electrode set-up reveal that rGO and the MnO2–rGO nanocomposite possess good electrochemical performances when operated in negative and positive potential windows, respectively. The charge storage kinetic study of the electrodes is illustrated through the in-depth examinations of the CV profiles, which indicate the ideal capacitive nature of the rGO-electrode, and mixed capacitive and pseudocapacitive behavior of the MnO2–rGO electrode. The assembled ASC (rGO‖MnO2–rGO) device operated in the wide potential range of 0 V to 1.8 V yielded the highest specific capacitance of 216 F g−1 at 1 A g−1. Furthermore, the ASC (rGO‖MnO2–rGO) device delivered the maximum energy density of 24.25 W h kg−1 with a power density of 900 W kg−1, along with a capacitance retention of ∼90% over 6000 GCD cycles. The obtained performance of the ASC device is superior as compared to the previously reported work due to the interconnected heterostructure of MnO2–rGO, which not only prevents the restacking of the graphene sheet, but also provides the faster movement of ions during electrochemical processes. This study opens the gateway for the electrochemical study of the synthesized nano-structured composite material with different polymer electrolytes, and different morphologies of the composite can also be explored further for the other energy storage applications. Thus, this study delivers a new idea for developing morphological modified heterostructure composites, and a potential perspective for constructing quasi-solid-state devices for future energy storage systems.Author contributions
Deependra Jhankal: conceptualization, investigation, writing – original draft, methodology. Mohammed Saquib Khan: methodology, formal analysis, visualization. Preeti Shakya: formal analysis, data curation. Nikita Bhardwaj: formal analysis. Bhanu Yadav: data curation. K. K. Jhankal: investigation. K. Sachdev: formal analysis, validation, supervision.Conflicts of interest
There are no conflicts to declare.Acknowledgements
The materials characterization procedures were made possible by the Materials Research Center at MNIT Jaipur (India), and the authors are appreciate of the assistance. Author Deependra Jhankal thank to UGC, New Delhi for providing SRF fellowship.References
- W. Tuichai, A. Karaphun and C. Ruttanapun, J. Alloys Compd., 2020, 849, 156516 CrossRef CAS.
- V. Ruiz, R. Santamaría, M. Granda and C. Blanco, Electrochim. Acta, 2009, 54, 4481–4486 CrossRef CAS.
- J. L. Yang, J. M. Cao, X. X. Zhao, K. Y. Zhang, S. H. Zheng, Z. Y. Gu and X. L. Wu, Energy Chem., 2022, 4, 100092 CrossRef CAS.
- A. Singh, S. K. Ojha, M. Singh and A. K. Ojha, Electrochim. Acta, 2020, 349, 136349 CrossRef CAS.
- S. Ramesh, H. M. Yadav, K. Karuppasamy, D. Vikraman, H. S. Kim, J. H. Kim and H. S. Kim, J. Mater. Res. Technol., 2019, 8, 4227–4238 CrossRef CAS.
- Y. Ge, Z. Liu, Y. Wu and R. Holze, Electrochim. Acta, 2021, 366, 137390 CrossRef CAS.
- T. Chen, F. Wang, S. Cao, Y. Bai, S. Zheng, W. Li, S. Zhang, S.-X. Hu and H. Pang, Adv. Mater., 2022, 34, 2201779 CrossRef CAS PubMed.
- M. Yu, Z. Wang, Y. Han, Y. Tong, X. Lu and S. Yang, J. Mater. Chem. A, 2016, 4, 4634–4658 RSC.
- J. Zhang, J. Jiang, H. Li and X. S. Zhao, Energy Environ. Sci., 2011, 4, 4009–4015 RSC.
- C. H. Ng, H. N. Lim, S. Hayase, Z. Zainal, S. Shafie and N. M. Huang, Electrochim. Acta, 2017, 229, 173–182 CrossRef CAS.
- Y. G. Wang, Z. D. Wang and Y. Y. Xia, Electrochim. Acta, 2005, 50, 5641–5646 CrossRef CAS.
- H. Jiang, H. Niu, X. Yang, Z. Sun, F. Li, Q. Wang and F. Qu, Chem. – Eur. J., 2018, 24, 10683–10688 CrossRef CAS.
- S. Korkmaz, A. Kariper, O. Karaman and C. Karaman, Ceram. Int., 2021, 47, 34514–34520 CrossRef CAS.
- P. Yang, Y. Ding, Z. Lin, Z. Chen, Y. Li, P. Qiang, M. Ebrahimi, W. Mai, C. Ping Wong and Z. Lin Wang, Nano Lett., 2014, 14(2), 731–736 CrossRef CAS.
- Q. Liu, Z. Guo, C. Wang, S. Guo, Z. Xu, C. Hu, Y. Liu, Y. Wang, J. He and W. Y. Wong, Adv. Sci., 2023, 10, 1–13 Search PubMed.
- P. Ragupathy, H. N. Vasan and N. Munichandraiah, J. Electrochem. Soc., 2008, 155, A34 CrossRef CAS.
- Z. Ma, F. Jing, Y. Fan, L. Hou, L. Su, L. Fan and G. Shao, Small, 2019, 15, 1–11 Search PubMed.
- J. Jiang and A. Kucernak, Electrochim. Acta, 2002, 47, 2381–2386 CrossRef CAS.
- Q. Z. Zhang, D. Zhang, Z. C. Miao, X. L. Zhang and S. L. Chou, Small, 2018, 14, 1–15 Search PubMed.
- R. Jiang, T. Huang, J. Liu, J. Zhuang and A. Yu, Electrochim. Acta, 2009, 54, 3047–3052 CrossRef CAS.
- Y. Xiao, Y. Cao, Y. Gong, A. Zhang, J. Zhao, S. Fang, D. Jia and F. Li, J. Power Sources, 2014, 246, 926–933 CrossRef CAS.
- E. Beaudrouet, A. Le Gal La Salle and D. Guyomard, Electrochim. Acta, 2009, 54, 1240–1248 CrossRef CAS.
- K. Ghosh, C. Y. Yue, Md. M. Sk, R. K. Jena and S. Bi, Sustainable Energy Fuels, 2018, 2, 280–293 RSC.
- X. Zheng, P. Li, H. Zhu, K. Rui, G. Zhao, J. Shu, X. Xu, W. Sun and S. X. Dou, Energy Storage Mater., 2018, 15, 257–265 CrossRef.
- J. Zhu, J. Hu, L. Wei, J. Liu and M. Zheng, J. Power Sources, 2018, 393, 135–144 CrossRef CAS.
- J. Ju, H. Zhao, W. Kang, N. Tian, N. Deng and B. Cheng, Electrochim. Acta, 2017, 258, 116–123 CrossRef CAS.
- R. K. Sharma, A. C. Rastogi and S. B. Desu, Electrochim. Acta, 2008, 53, 7690–7695 CrossRef CAS.
- C. Liu, Y. Bai, W. Li, F. Yang, G. Zhang and H. Pang, Angew. Chem., Int. Ed., 2022, 61, e202116282 CrossRef CAS PubMed.
- Y. Huang, H. Cheng, D. Shu, J. Zhong, X. Song, Z. Guo, A. Gao, J. Hao, C. He and F. Yi, Chem. Eng. J., 2017, 320, 634–643 CrossRef CAS.
- Y. Xie, C. Yang, P. Chen, D. Yuan and K. Guo, J. Power Sources, 2019, 425, 1–9 CrossRef CAS.
- M. S. Khan, D. Jhankal, P. Shakya, A. K. Sharma, M. K. Banerjee and K. Sachdev, Carbon, 2023, 208, 227–237 CrossRef CAS.
- G. A. M. Ali, J. Electron. Mater., 2020, 49, 5411–5421 CrossRef CAS.
- L. Li, S. Pang, X. Fan, Y. Wang, H. Cheng, D. Fang, L. Qin, M. Deng and Z. Lu, Mater. Technol., 2021, 1–9 Search PubMed.
- M. Geerthana, S. Prabhu and R. Ramesh, J. Energy Storage, 2022, 47, 103529 CrossRef.
- D. J. Tarimo, K. O. Oyedotun, A. A. Mirghni, N. F. Sylla and N. Manyala, Electrochim. Acta, 2020, 353, 136498 CrossRef CAS.
- B. Zhao, P. Liu, Y. Jiang, D. Pan, H. Tao, J. Song, T. Fang and W. Xu, J. Power Sources, 2012, 198, 423–427 CrossRef CAS.
- L. Zhang, H. Liu, H. Ruan, Y. Su, R. Hu, L. Tian, Z. Hu and J. Li, Int. J. Electrochem. Sci., 2016, 11, 10815–10826 CrossRef CAS.
- A. Ogata, S. Komaba, R. Baddour-Hadjean, J. P. Pereira-Ramos and N. Kumagai, Electrochim. Acta, 2008, 53, 3084–3093 CrossRef CAS.
- C. Gomez-Navarro, R. T. Weitz, A. M. Bittner, M. Scolari, A. Mews, M. Burghard and K. Kern, Nano Lett., 2009, 9, 2206 CrossRef CAS.
- S. Ghasemi, S. R. Hosseini and O. Boore-talari, Ultrason. Sonochem., 2018, 40, 675–685 CrossRef CAS.
- M. Xu, L. Kong, W. Zhou and H. Li, J. Phys. Chem. C, 2007, 111, 19141–19147 CrossRef CAS.
- N. Sharma, V. Sharma, S. K. Sharma and K. Sachdev, Mater. Lett., 2019, 236, 444–447 CrossRef CAS.
- M. Choi, S. Kumar, D. Yoon, J. Hwang, S. Min and J. Kim, J. Power Sources, 2016, 309, 202–211 CrossRef CAS.
- V. Sannasi and K. Subbian, J. Mater. Sci.: Mater. Electron., 2020, 31, 17120–17132 CrossRef CAS.
- G. Qin, H. Zhang, H. Liao, Z. Li, J. Tian, Y. Lin, D. Zhang and Q. Wu, J. Mater. Sci., 2017, 52, 10981–10992 CrossRef CAS.
- J. Zhang, Y. Xu, Z. Liu, W. Yang and J. Liu, RSC Adv., 2015, 5, 54275–54282 RSC.
- K. H. Ye, Z. Q. Liu, C. W. Xu, N. Li, Y. B. Chen and Y. Z. Su, Inorg. Chem. Commun., 2013, 30, 1–4 CrossRef CAS.
- Z. Li, Y. Mi, X. Liu, S. Liu, S. Yang and J. Wang, J. Mater. Chem., 2011, 21, 14706–14711 RSC.
- D. Guo, S. Dou, X. Li, J. Xu, S. Wang, L. Lai, H. K. Liu, J. Ma and S. X. Dou, Int. J. Hydrogen Energy, 2016, 41, 5260–5268 CrossRef CAS.
- D. P. Dubal, A. D. Jagadale, S. V. Patil and C. D. Lokhande, Mater. Res. Bull., 2012, 47, 1239–1245 CrossRef CAS.
- M. Saraf, K. Natarajan and S. M. Mobin, ACS Appl. Mater. Interfaces, 2018, 10, 16588–16595 CrossRef CAS PubMed.
- J. Wang, J. Polleux, J. Lim and B. Dunn, J. Phys. Chem. C, 2007, 111, 14925–14931 CrossRef CAS.
- N. Kanaujiya, N. Kumar, M. Singh, Y. Sharma and G. D. Varma, J. Energy Storage, 2021, 35, 102302 CrossRef.
- J. Pati, H. Raj, S. K. Sapra, A. Dhaka, A. K. Bera, S. M. Yusuf and R. S. Dhaka, J. Mater. Chem. A., 2022, 10, 15460–15473 RSC.
- T. Brezesinski, J. Wang, S. H. Tolbert and B. Dunn, Nat. Mater., 2010, 9, 146–151 CrossRef CAS PubMed.
- N. Choudhary, C. Li, J. Moore, N. Nagaiah, L. Zhai, Y. Jung and J. Thomas, Adv. Mater., 2017, 1605336 CrossRef PubMed.
- R. Thangappan, S. Kalaiselvam, A. Elayaperumal, R. Jayavel, M. Arivanandhan, R. Karthikeyan and Y. Hayakawa, Dalton Trans., 2016, 45, 2637–2646 RSC.
- S.-L. Kuo and N.-L. Wu, J. Electrochem. Soc., 2006, 153, A1317 CrossRef CAS.
- M. Toupin, T. Brousse and D. Bélanger, Chem. Mater., 2004, 16, 3184–3190 CrossRef CAS.
- D. Guo, X. Chen, Z. Fang, Y. He, C. Zheng, Z. Yang, K. Yang, Y. Chen and S. Huang, Electrochim. Acta, 2015, 176, 207–214 CrossRef CAS.
- D. Jhankal, M. S. Khan, B. Yadav, P. Shakya, N. Bhardwaj, K. K. Jhankal and K. Sachdev, Energy Storage, 2023, 1–11 Search PubMed.
- S. Liang, H. Wang, Y. Li, H. Qin, Z. Luo and L. Chen, Appl. Surf. Sci., 2021, 567, 150809 CrossRef CAS.
- J. Ye, B. Hu, Y. Jin, Z. Wang, Y. Xi, L. Fang and Q. Pan, Electrochim. Acta, 2020, 349, 136372 CrossRef CAS.
- S. Rani, N. Kumar, A. Tandon and Y. Sharma, IEEE Trans. Electron Devices, 2021, 68, 251–256 CAS.
- N. Kurra, S. Uzun, G. Valurouthu and Y. Gogotsi, Energy Storage Mater., 2021, 39, 347–353 CrossRef.
- P. Makkar and N. N. Ghosh, Ind. Eng. Chem. Res., 2021, 60(4), 1666–1674 CrossRef CAS.
- H. Fei, N. Saha, N. Kazantseva, R. Moucka and Q. Cheng, Materials, 2017, 10, 1251 CrossRef.
- E. Miniach, A. Śliwak, A. Moyseowicz, L. Fernández-Garcia, Z. González, M. Granda, R. Menendez and G. Gryglewicz, Electrochim. Acta, 2017, 240, 53–62 CrossRef CAS.
- P. Wu, M. Gao, S. Yu, M. Feng, S. Liu and J. Fu, Electrochim. Acta, 2020, 354, 136681 CrossRef CAS.
Footnote |
| † Electronic supplementary information (ESI) available. See DOI: https://doi.org/10.1039/d3ya00469d |
| This journal is © The Royal Society of Chemistry 2024 |

