Ultrafast dynamics in plasmon–exciton core–shell systems: the role of heat
Felix
Stete
 ab,
Matias
Bargheer
ac and
Wouter
Koopman
 *a
*a
aInstitut für Physik & Astronomie, Universität Potsdam, Karl-Liebknecht-Str. 24-25, 14476 Potsdam, Germany. E-mail: wouter.koopman@uni-potsdam.de
bSchool of Analytical Sciences Adlershof (SALSA), Humboldt-Universität zu Berlin, Unter den Linden 6, 10999 Berlin, Germany
cHelmholtz Zentrum Berlin, Albert-Einstein-Str. 15, 12489 Berlin, Germany
First published on 1st September 2023
Abstract
Strong coupling between plasmons and excitons gives rise to new hybrid polariton states with potential applications in various fields. Despite a plethora of research on plasmon–exciton systems, their transient behaviour is not yet fully understood. Besides Rabi oscillations in the first few femtoseconds after optical excitation, coupled systems show interesting non-linear features on the picosecond time scale. Here, we conclusively show that the source of these features is heat that is generated inside the particles. Until now, this hypothesis was only based on phenomenological arguments. We investigate the role of heat by recording the transient spectra of plasmon–exciton core–shell nanoparticles with excitation off the polariton resonance. We present analytical simulations that precisely recreate the measurements solely by assuming an initial temperature rise of the electron gas inside the particles. The simulations combine established strategies for describing uncoupled plasmonic particles with a recently published model for static spectra. The simulations are consistent for various excitation powers, confirming that heating of the particles is indeed the root of the changes in the transient signals.
The small mode volume of localized surface plasmons on gold nanoparticles greatly enhances external electric fields. This enhancement enables high coupling strengths with excitonic emitters on the particle surface. In the so-called strong coupling regime, new hybrid resonances emerge, an upper and a lower polariton mode. These polaritons possess both plasmonic and excitonic characteristics, a feature that is of interest for applications such as in quantum networks,1 parametric optical signal amplification,2 manipulation of chemical reactions,3 thresholdless lasing4 and many more.
Strong coupling between excitonic emitters and metal nanoparticles has been realized for various particle types. Examples are silver rods,5 silver triangles,6 silver shells,7 gold rods,8 and aluminium discs.9 When excited, the energy oscillates between purely plasmonic and purely excitonic modes at the Rabi frequency. For metal nanoparticles, this frequency is on the order of a few femtoseconds, making a direct observation difficult. Additionally, the short lifetime of plasmons on the order of 10 fs hinders a long coherent oscillation between excitonic and plasmonic parts. The strongly damped Rabi oscillations have been observed for surface plasmon polariton systems,10 and only very recently, coherent dynamics have been observed in colloidal systems.11
Also on longer time scales after initial excitation, strongly coupled plasmon–exciton nanoparticles show interesting non-linear features that can be of great importance for future applications. Several studies have discussed the transient behaviour of coupled plasmon–exciton systems on a time scale beyond the polariton lifetime.12–15 The main source of changes in the transient spectra at the polariton resonances was argued to be heat in the metal cores. However, the arguments were phenomenological rather than rigid. In particular, the modes were modelled as simple oscillators. However, for a detailed investigation of the role of heat in the system, the material properties of the particles need to be taken into account.
For bare nanoparticles, such a complete approach has been successfully introduced to explain the changes in the optical properties upon heating or the transient behaviour after initial excitation.16–18 The main idea is to model the metal's permittivity depending on the electron and lattice temperature in the particle since for bare particles, heat is the source of changes in the transient spectra. This model has not yet been applied to the situation of plasmon–exciton particles to precisely discuss the role of heat in the metal.
We want to close this gap with this study by presenting simulations of the transient spectra of coupled plasmon–exciton nanoparticles, which are excited off the polariton resonance. We combine, on the one hand, the well-established method of reproducing the transient behaviour of gold nanoparticles via Rosei's model18,19 and, on the other hand, a recently presented expansion of the Mie–Gans model to describe the static extinction of coupled core–shell particles taking into account the power broadening of the emitters induced by the plasmonic cavity.20 The simulations essentially model how the increased electron temperature changes the occupied electronic states according to the Fermi-distribution and the lattice temperature adds a correction to the free electron damping. We calibrate the simulations by comparing the static spectra of the bare gold particles with those of the core–shell particles. Finally, we model the electron and phonon temperatures in a two-temperature model and compare the simulated spectra to the results of pump–probe measurements of coupled plasmon–exciton core–shell nanorods. Our model system consists of a gold core and shell of the cyanine dye TDBC. The particles show strong coupling or at least verge on the strong coupling regime.21,22 The comparison between the simulations and measurements for various pump powers demonstrates good agreement supporting previous studies which had to argue phenomenologically.12,13
Experimental methods
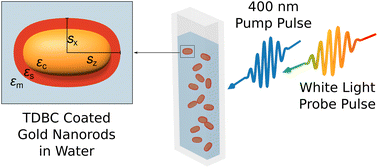
We measured the change in transmission of white light laser pulses through a solution of dye coated gold nanorods for various delay times after excitation with a femtosecond-pump pulse at 400 nm (Fig. 1).TDBC-coated gold nanorods
The cyanine dye 5,5′,6,6′-tetrachloro-1-1′-diethyl-3,3′-di (4-sulfobutyl)-benzimidazolocarbocyanine (TDBC) was obtained from FEW Chemicals and used as received. It was dissolved in an aqueous NaOH solution (cNaOH = 10−5 mol l−1) with a concentration of cTDBC = 1 mmol l−1, stirred for 5 min and placed in an ultrasonic bath for 15 min. Citrate stabilized gold nanorods with a nominal transverse diameter of 25 nm and a longitudinal plasmon resonance at 600 nm were purchased as a colloidal solution with a particle concentration of 1.2 × 10¹¹ ml−1 from Nanopartz. Contrary to CTAB ligands, conventionally used for stabilizing gold nanorods, citrate ligands can easily be exchanged with TDBC. Particle solution and dye solution were mixed in a ratio of 1![[thin space (1/6-em)]](https://www.rsc.org/images/entities/char_2009.gif) :
:![[thin space (1/6-em)]](https://www.rsc.org/images/entities/char_2009.gif) 1, placed in an ultrasonic bath for 15 min and left undisturbed for 48 h. After this resting time, the unadsorbed TDBC was removed by centrifuging twice for 30 min at 3000 rpm and refilling with purified water. During the measurements, the particle solution was placed in cuvettes with a path length of 1 mm.
1, placed in an ultrasonic bath for 15 min and left undisturbed for 48 h. After this resting time, the unadsorbed TDBC was removed by centrifuging twice for 30 min at 3000 rpm and refilling with purified water. During the measurements, the particle solution was placed in cuvettes with a path length of 1 mm.
Static measurements
Static transmission spectra were recorded with a Cary 5e spectrometer.Pump–probe measurements
Laser pulses with a pulse length of 140 fs at a central wavelength of 795 nm and a repetition rate of 5 kHz were generated in a Ti:sapphire laser system (MaiTai/Spitfire Pro by Spectra-Physics). A part of the light was frequency doubled and focussed on the particle solution as a pump beam with a focal spot size of approximately 300 μm. The power was varied between 1 mW and 4.5 mW. A small part of the output of the laser system was used to generate super continuum (white light) pulses in a 1 mm thick sapphire plate. These white light pulses were used to probe the transmission through the sample with an arbitrary delay to the pump excitation. After correction for the chirp of the white light as measured by polarisation-gated frequency-resolved optical gating (PG-FROG), the white light conserves the time resolution of the pump pulse. The time delay t between the pump and probe could be controlled with a delay stage. The pump beam was chopped at a rate of 125 Hz to measure the relative change in transmission between the pumped (T0 + ΔT) and the unpumped (T0) sample. The change in transmission is directly connected to the change in extinction Δσext of the particles via ΔT(t) ≈ nLΔσext(t), with n representing the particle density and L the sample thickness.19Simulations
This study discusses simulations of transient spectra of core–shell nanoparticles based on the heat-induced change of the core's permittivity εc. For simplicity, we assume here that the excitonic shell permittivity εc is not affected by the excitation.The simulation procedure was performed as follows: in the first step, we simulated the static spectra at room temperature by combining the theoretical description of the gold permittivity at room temperature by Rosei23–26 with the Mie–Gans model for core–shell nanospheroids.20 Transient spectra were then obtained by modelling the effect of the transient temperature rise on the Rosei-permittivity. The single steps of this route are described in detail below.
Static spectra
We simulated the static spectrum of our particles based on the Mie–Gans model.20 The extinction cross section σext of a nanoparticle can be obtained by calculating its polarisability α. In a dipolar approximation, the polarisability α0,j along the long (j = z) or the short (j = x, y) axis of a spheroid is given by27,28 | (1) |
To account for the finite particle size, we applied the modified long wavelength approximation (MLWA) as29
 | (2) |
 | (3) |
For this study, the particles were dissolved in water and thus randomly oriented in reference to the light polarisation. This is taken into account by weighing the contribution of each main axis with a factor of 1/3.
Apparently, the extinction is directly related to the permittivities εi of the involved materials. In the following, we want to present the models for εs and εc.
For a correct simulation of the shell permittivity εs, the power broadening of the molecular transition by the strong electric fields at the particle surface has to be taken into account. The permittivity of a two-level system in a cavity is given by20
 | (4) |
A theoretical model for the temperature-dependence of the Au-permittivity was established by Rosei and colleagues23–26 and has successfully been used to describe the transient behaviour of gold nanoparticles.18,19 It includes the contribution of the conduction electrons εDrvia the Drude model and the contribution of interband transitions εIBvia the joint density of states. Combining the different contributions allows the calculation of the imaginary part Im(ε). The real part of the permittivity Re(ε) is then obtained via the Kramers–Kronig integral.
The optical response of the quasi-free electrons at the Fermi edge is described by the Drude contribution to the permittivity as follows:
 | (5) |
To correctly describe the permittivity of gold in the visible region down to 400 nm, three interband transitions need to be taken into account in addition to the Drude contribution: the transition from the d band to the p band close to the X point of the Brillouin zone (Fig. 2a) and the transitions from the d band to the p band and from the p band to the s band in the vicinity of the L point of the Brillouin zone19 (Fig. 2b). The basis for the contribution of the transition from band i to band j is the energy distribution of the joint density of states.23 It describes the density of transitions with energy and initial energy E. To find the probability of a transition this term needs to be weighted with the probability that the initial state is occupied while the final state is not. This occupation probability is determined using the Fermi distribution f(E, T) whose edge at the Fermi energy changes with temperature (Fig. 2c). The transition probability from band i to band j with energy ħω is then given as follows:19
 | (6) |
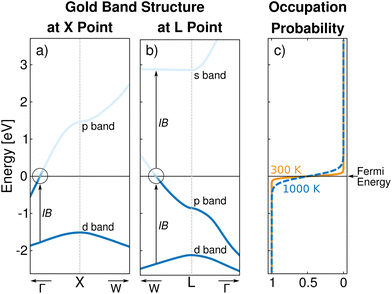 | ||
| Fig. 2 Band structure of gold at the X (a) and L (b) points in the Brillouin zone and the corresponding occupation probability given by the Fermi distribution f(E, T) (c). The vertical arrows indicate the interband transitions (IB) with transition energies in the visible region. The Fermi distribution is plotted for T = 300 K (solid orange line) and T = 1000 K (dashed blue line) to illustrate the smearing of the Fermi edge. The band structures were extracted from ref. 30. | ||
Each interband transition is weighted with oscillator strength Ai→j![[thin space (1/6-em)]](https://www.rsc.org/images/entities/char_2009.gif) 23 to model the imaginary part of the permittivity. Considering the contribution of the three relevant transitions, ħω then reads19
23 to model the imaginary part of the permittivity. Considering the contribution of the three relevant transitions, ħω then reads19
 | (7) |
Combining Drude and interband contributions, we obtain an ab initio expression for the imaginary part of the permittivity of gold. The real part is then directly retrieved via Kramers–Kronig integration. The necessary parameters for the model can be retrieved from the detailed calculated band structure of gold.19 However, for simplicity and higher precision, they are usually found by fitting the permittivity model to the experimental data. For this study, we used the values provided in ref. 31.
Temperature dependent spectra
The Rosei model allows simulation of the temperature dependence of the permittivity. Heating causes a smearing of the Fermi edge (Fig. 2c) and thus affectsas calculated in eqn (6). In other words, heating alters the occupation probability of the final or initial state and thus affects the different interband transitions. The Drude part is affected by heating via a change in the scattering rate γDr. For weak and moderate excitation, the change in electron–electron scattering can be neglected and γDr is purely modified by a change in the electron–phonon scattering32i.e. by the phonon temperature Tph.
To simulate the effect of transient gold heating, we need to find expressions for the time dependent electron and phonon temperatures, Te(t) and Tph(t), which are incorporated into the Rosei model to determine the time dependent permittivity εcore(t) of the gold. Subsequently, Δσext(t) is calculated viaeqn (1)–(3) and compared to the measured data.
In metals, the energy of an incoming laser pulse is absorbed only by the electrons. They thermalise within a few tens of femtoseconds. Due to the fast thermalisation (in comparison to the temporal resolution of the set-up), we can assume here that directly after the excitation, all electrons are described by a Fermi distribution with temperature Te,0. This temperature is derived from the absorbed pulse energy and the particle's absorption cross section. Since the interaction between the lattice and light can be neglected, the electrons and the lattice need to be described with two different temperatures, which equilibrate via electron–phonon coupling in the first few picoseconds after excitation. Since both subsystems contribute to the permittivity (the electron temperature to the interband transitions and the phonon temperature to the Drude part), a two-temperature model is required to describe the transient behaviour of metal nanoparticles. The temperatures Ti(t), where i represents the electron (e) or lattice (l) system, are connected via the system of coupled differential equations17
 | (8a) |
 | (8b) |
The two-temperature model is parameterized using the electron and lattice heat capacities Ci(Ti), as well as the electron–phonon coupling constant Ge–ph. Coupling to the environment has been neglected in this expression since it occurs on longer time scales than the ones discussed here. The heat capacity of the gold lattice is Cl = 3kBn where kB is the Boltzmann constant and n = 5.9 × 10⁻²⁸ m−3.18 The electron heat capacity is temperature dependent via Ce = γeTe with a Sommerfeld constant of γe = 71.5 J m−3 K−2.18 As electron phonon coupling, we use Ge–ph = 2.1 × 10¹⁶ W m−3.33
The solution of these equations yields the two temperatures and consequently allows for a calculation of the permittivity at any time after excitation. The electron temperature determines the form of the Fermi distribution while the phonon temperature affects the free electron scattering rate γDr as follows:19
 | (9) |
In conclusion, this model allows the simulation of the permittivity of gold and consequently of the strongly coupled plasmon–exciton system after initial excitation. In the following section, we will present the results of both measurement and simulation and their remarkable match.
Results and discussion
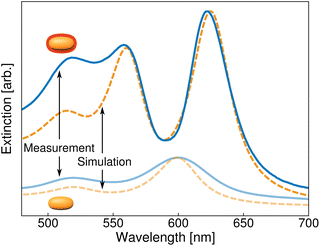
The static extinction spectrum of the dye coated nanorods shows three peaks (upper, dark blue line in Fig. 3). The transverse plasmon peak is located around 520 nm, while around 570 nm and 630 nm, the hybrid resonances of the coupled plasmon–exciton system become visible. In comparison, the extinction spectrum of bare gold nanorods (lower, bright blue line in Fig. 3) shows a longitudinal resonance around 600 nm. The splitting in the plasmon–exciton spectrum originates from the strong coupling of this longitudinal plasmon resonance to the exciton resonance of TDBC around 600 nm. The hybrid coupled excitations are known as the upper and lower polariton peak.The static simulations are represented by the dashed orange lines in Fig. 3. The parameters used here are identical to those in ref. 20. However, for this study, the gold permittivity is now not directly taken from measured data31 but simulated via the Rosei model that fully reproduces this measured permittivity. The simulations of the extinction of the bare and coupled systems agree quite well with the data. Only the intensity of the transverse resonance is not fully recovered. This is a well-known problem in simulations of nanorod spectra.34,35 In this case, nanospheres in the sample and particle clusters that can both be observed in SEM images seem to be the main reason for a higher peak in the measured data. In the region of interest, i.e. the region of the coupled resonances, the model fits the data very well. We hence conclude that our model is suitable to further investigate the transient behaviour of the coupled system.
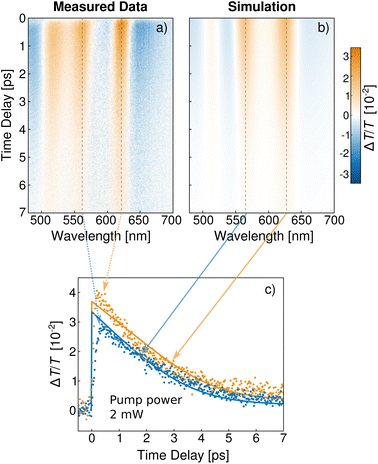
In the following, we discuss the transient spectra of the same particles. The relative change in transmission ΔT/T0 after excitation with a 400 nm pump pulse at a pump power of 2 mW is presented in Fig. 4a for various time delays. At the position of the static resonances, long lasting signal changes can be observed. The change at the transverse resonance can be directly attributed to the heating of the particles which effectively describes the broadening of the resonance.19 The two polariton resonances possess similar features with the same lifetime. At first glance, two possible explanations seem appropriate. On the one hand, the excitation of polaritons or dark states has been suggested previously.36,37 On the other hand, the signal change directly translates to a widening of the peaks. Therefore, a higher damping of the resonances caused by particle heating has been proposed to be the source of the signal change also at the polariton resonances.12,13
To calculate the influence of the transient heating, we inserted time dependent temperatures, obtained from the two-temperature model, into the simulation of the gold permittivity. This permittivity is then used in the Mie–Gans model. The initial conditions for solving eqn (8) are given by the electron and phonon temperatures at t = 0. The lattice is initially at room temperature Troom since the light is absorbed only by the electrons. Assuming that all absorbed light energy uniformly raises the temperature of the thermalised electron gas,19 the electron temperature at t = 0 is38
 | (10) |
Fig. 4 presents both measured and simulated data for a pump power of 2 mW. For the simulation (Fig. 4a), the only fitting parameter was Te,0 (and a normalisation parameter). With Te,0 = 1000 K (a realistic value in comparison with previous reports17,38,39), the model reproduces the measurement (Fig. 4b) quite well. While the simulation closely resembles the measurements at the polariton resonances, it somewhat underestimates the magnitude at the transverse plasmon resonance, due to the underestimation of the transverse peaks as discussed earlier. The agreement can be verified by taking a closer look at the behaviour at the polariton wavelengths (Fig. 4c). The simulation at these resonances agrees with the measurements reasonably well.
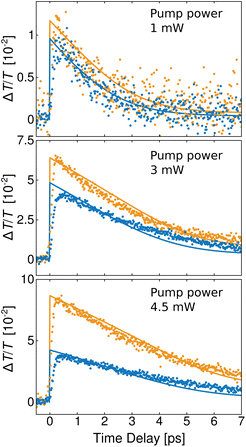
To further strengthen the hypothesis of a purely thermal origin of the transient signal as suspected in the literature,12,13 we additionally investigated the temporal behaviour for pump powers of 1 mW, 3 mW and 4.5 mW. We can safely assume that the energy deposited inside a particle ΔQ is proportional to the pump power. Consequently, using Te,0 = 1000 K for 2 mW pump power, eqn (10) predicts initial electron temperatures of 738 K, 1206 K and 1462 K for the pump powers of 1 mW, 3 mW and 4.5 mW, respectively. Fig. 5 presents the simulations using these initial temperatures in comparison with the measured data. The characteristic crossover from an exponential to an almost linear decay38 is nicely reproduced. Note that for the two higher pump powers, the ratio between the two signals (at upper and lower polariton positions) was not ideal for the simulations. We therefore had to normalise the two signals separately to account for the higher measured change of the lower polariton. This discrepancy might be rooted in the bleaching of the dye for higher pump powers, which is not incorporated into our model. Yet, this consistency of the model for different pump powers clearly supports the hypothesis of heat being the main source of transient signal also for strongly coupled nanoparticles. The high fluence transients can surely be fitted better if one allows for an adjustment of the various parameters entering the model and maybe in some way includes the influence of heat on the dye shell (our model predicts a phonon heating of 30 K under the highest excitation, we therefore can expect the dye shell to also show a temperature change on that magnitude, which has been found to influence both resonance and linewidth40). We think, however, that this consistent fit for several fluences demonstrates that the gold heating is at the origin of the observed dynamics.
Although the signal change arises mainly at the polariton positions, it is unlikely that excited coupled states induce this change. On the one hand, the particles were pumped with 400 nm, a wavelength at which polaritons are not directly excited; on the other hand, the lifetime of such plasmon–exciton states is in the order of a few tens of femtoseconds, a timescale far below the lifetime of the signals in our measurements. We therefore suspect that on a longer timescale, a resonant excitation will also result in the same heat induced transient spectra as we recorded here for the non-resonant case. This hypothesis is a matter of future experiments. In any case, our model allows one to extract and discriminate the influence of heat on the signal and consequently to investigate possible mechanisms that lie beneath this dominant effect.
Conclusion
In conclusion, we presented a method for the simulation of the full transient spectra of coupled plasmon-dye core–shell nanorods excited off the polariton resonance. To this end, we combined a well-established method for the transient description of bare gold nanoparticles with a method to simulate the spectra of strongly coupled metal–dye particles that includes dye saturation by strong plasmon fields. The remarkable agreement between measured and simulated data in the present work confirms the suggestion of earlier studies that the picosecond-dynamics of these hybrid nanoparticles is dominated by transient heating effects.Conflicts of interest
There are no conflicts to declare.Acknowledgements
We thank Günter Kewes for fruitful discussions. Additionally, F. S. acknowledges financial support by the Deutsche Forschungsgemeinschaft (DFG, German Research Foundation) via the SALSA graduate school of analytical sciences (SALSA.GSC 1013).References
- A. Imamoğlu, D. D. Awschalom, G. Burkard, D. P. DiVincenzo, D. Loss, M. Sherwin and A. Small, Phys. Rev. Lett., 1999, 83, 4204–4207 CrossRef.
- M. Saba, C. Ciuti, J. Bloch, V. Thierry-Mieg, R. André, L. S. Dang, S. Kundermann, A. Mura, G. Bongiovanni and J. Staehli, et al. , Nature, 2001, 414, 731 CrossRef CAS PubMed.
- J. A. Hutchison, T. Schwartz, C. Genet, E. Devaux and T. W. Ebbesen, Angew. Chem., Int. Ed., 2012, 51, 1592–1596 CrossRef CAS PubMed.
- P. Törmä and W. L. Barnes, Rep. Prog. Phys., 2014, 78, 013901 CrossRef PubMed.
- D. Zheng, S. Zhang, Q. Deng, M. Kang, P. Nordlander and H. Xu, Nano Lett., 2017, 17, 3809–3814 CrossRef CAS PubMed.
- G. Zengin, M. Wersäll, S. Nilsson, T. J. Antosiewicz, M. Käll and T. Shegai, Phys. Rev. Lett., 2015, 114, 157401 CrossRef PubMed.
- N. Zhou, M. Yuan, Y. Gao, D. Li and D. Yang, ACS Nano, 2016, 10, 4154–4163 CrossRef CAS PubMed.
- D. Melnikau, R. Esteban, D. Savateeva, A. Sánchez-Iglesias, M. Grzelczak, M. K. Schmidt, L. M. Liz-Marzán, J. Aizpurua and Y. P. Rakovich, J. Phys. Chem. Lett., 2016, 7, 354–362 CrossRef CAS PubMed.
- E. Eizner, O. Avayu, R. Ditcovski and T. Ellenbogen, Nano Lett., 2015, 15, 6215–6221 CrossRef CAS PubMed.
- P. Vasa, W. Wang, R. Pomraenke, M. Lammers, M. Maiuri, C. Manzoni, G. Cerullo and C. Lienau, Nat. Photonics, 2013, 7, 128–132 CrossRef CAS.
- N. Peruffo, F. Mancin and E. Collini, Adv. Opt. Mater., 2023, 2203010 CrossRef CAS.
- Y.-W. Hao, H.-Y. Wang, Y. Jiang, Q.-D. Chen, K. Ueno, W.-Q. Wang, H. Misawa and H.-B. Sun, Angew. Chem., 2011, 123, 7970–7974 CrossRef.
- T. Simon, D. Melnikau, A. Sánchez-Iglesias, M. Grzelczak, L. M. Liz-Marzán, Y. Rakovich, J. Feldmann and A. S. Urban, J. Phys. Chem. C, 2016, 120, 12226–12233 CrossRef CAS.
- E. Eizner, K. Akulov, T. Schwartz and T. Ellenbogen, Nano Lett., 2017, 17, 7675–7683 CrossRef CAS PubMed.
- D. Finkelstein-Shapiro, P.-A. Mante, S. Sarisozen, L. Wittenbecher, I. Minda, S. Balci, T. Pullerits and D. Zigmantas, Chem, 2021, 7, 1092–1107 CAS.
- C. Voisin, N. Del Fatti, D. Christofilos and F. Vallée, J. Phys. Chem. B, 2001, 105, 2264–2280 CrossRef CAS.
- J. H. Hodak, I. Martini and G. V. Hartland, J. Phys. Chem. B, 1998, 102, 6958–6967 CrossRef CAS.
- S. Park, M. Pelton, M. Liu, P. Guyot-Sionnest and N. F. Scherer, J. Phys. Chem. C, 2007, 111, 116–123 CrossRef CAS.
- T. Stoll, P. Maioli, A. Crut, N. Del Fatti and F. Vallée, Eur. Phys. J. B, 2014, 87, 260 CrossRef.
- F. Stete, W. Koopman, C. Henkel, O. Benson, G. Kewes and M. Bargheer, ACS Photonics, 2023, 10, 2511–2520 CrossRef CAS.
- F. Stete, W. Koopman and M. Bargheer, ACS Photonics, 2017, 4, 1669–1676 CrossRef CAS.
- F. Stete, P. Schoßau, M. Bargheer and W. Koopman, J. Phys. Chem. C, 2018, 122, 17976–17982 CrossRef CAS.
- R. Rosei, Phys. Rev. B: Solid State, 1974, 10, 474 CrossRef CAS.
- R. Rosei, F. Antonangeli and U. Grassano, Surf. Sci., 1973, 37, 689–699 CrossRef CAS.
- M. Guerrisi, R. Rosei and P. Winsemius, Phys. Rev. B: Solid State, 1975, 12, 557–563 CrossRef CAS.
- P. Winsemius, M. Guerrisi and R. Rosei, Phys. Rev. B: Solid State, 1975, 12, 4570–4572 CrossRef CAS.
- C. F. Bohren and D. R. Huffman, Absorption and Scattering of Light by Small Particles, John Wiley & Sons, 2008 Search PubMed.
- G. Zengin, G. Johansson, P. Johansson, T. J. Antosiewicz, M. Käll and T. Shegai, Sci. Rep., 2013, 3, 3074 CrossRef CAS PubMed.
- K. L. Kelly, E. Coronado, L. L. Zhao and G. C. Schatz, J. Phys. Chem. B, 2003, 107, 668–677 CrossRef CAS.
- N. E. Christensen and B. O. Seraphin, Phys. Rev. B: Solid State, 1971, 4, 3321–3344 CrossRef.
- R. L. Olmon, B. Slovick, T. W. Johnson, D. Shelton, S.-H. Oh, G. D. Boreman and M. B. Raschke, Phys. Rev. B: Condens. Matter Mater. Phys., 2012, 86, 235147 CrossRef.
- B. Rethfeld, D. S. Ivanov, M. E. Garcia and S. I. Anisimov, J. Phys. D: Appl. Phys., 2017, 50, 193001 CrossRef.
- J. Hohlfeld, S.-S. Wellershoff, J. Güdde, U. Conrad, V. Jähnke and E. Matthias, Chem. Phys., 2000, 251, 237–258 CrossRef CAS.
- V. Myroshnychenko, E. Carbó-Argibay, I. Pastoriza-Santos, J. Pérez-Juste, L. M. Liz-Marzán and F. J. García de Abajo, Adv. Mater., 2008, 20, 4288–4293 CrossRef CAS.
- H. Chen, L. Shao, Q. Li and J. Wang, Chem. Soc. Rev., 2013, 42, 2679–2724 RSC.
- S. Balci, C. Kocabas, B. Küçüköz, A. Karatay, E. Akhüseyin, H. G. Yaglioglu and A. Elmali, Appl. Phys. Lett., 2014, 105, 051105 CrossRef.
- N. Peruffo, F. Mancin and E. Collini, J. Phys. Chem. Lett., 2022, 13, 6412–6419 CrossRef CAS PubMed.
- N. Del Fatti, A. Arbouet and F. Vallée, Appl. Phys. B: Lasers Opt., 2006, 84, 175–181 CrossRef CAS.
- H. Inouye, K. Tanaka, I. Tanahashi and K. Hirao, Phys. Rev. B: Condens. Matter Mater. Phys., 1998, 57, 11334–11340 CrossRef CAS.
- S. Ceccarelli, J. Wenus, M. S. Skolnick and D. G. Lidzey, Superlattices Microstruct., 2007, 41, 289–292 CrossRef CAS.
| This journal is © The Royal Society of Chemistry 2023 |

