 Open Access Article
Fabrication of PANI/MWCNT supercapacitors based on a chitosan binder and aqueous electrolyte for enhanced energy storage†
Ezgi
Inci Yesilyurt
 ab,
Jürgen
Pionteck
 a,
Frank
Simon
 a and
Brigitte
Voit
 *ab
*ab
aLeibniz Institute of Polymer Research Dresden, Dresden, Germany. E-mail: inci@ipfdd.de; j-pionteck@ipfdd.de; frsimon@ipfdd.de; voit@ipfdd.de
bFaculty of Chemistry and Food Chemistry, Technische Universität Dresden, 01062 Dresden, Germany
First published on 29th August 2023
Abstract
In the mainstream renewable and sustainable nanotechnology, supercapacitors have emerged as critical energy conversion and storage systems. Carbon nanotubes (CNTs) are promising electrode materials in supercapacitors due to their excellent ability to conduct electricity and their high specific surface area. Due to its wide range of pseudocapacitive performance along with various oxidation states, polyaniline (PANI) has been widely used in energy storage applications as an electroactive material. In this study, the development of hybrid composite electrode materials containing multi-walled carbon nanotubes (MWCNTs) and conductive polyaniline (PANI) with different aniline/carbon ratios by in situ chemical oxidation polymerization is discussed. In the resulting PANI/MWCNT composites the CNTs are completely coated with PANI as concluded from scanning and transmission electron microscopy (SEM and TEM), Raman spectroscopy, X-ray photoelectron spectroscopy (XPS) and conductivity studies. The electrochemical performances of the electrodes produced with an eco-friendly chitosan binder were investigated with 0.5 M Na2SO4 aqueous electrolyte. Cyclic voltammograms (CV) and galvanostatic charge–discharge (GCD) curves of PANI/MWCNT composites show that the pseudo-capacitance of PANI improves the final electrochemical performance of the composites compared to that of pristine MWCNTs. While pure MWCNTs have a specific capacitance of 21.8 F g−1 and energy density of 0.7 W h kg−1, the PANI/MWCNT (30![[thin space (1/6-em)]](https://www.rsc.org/images/entities/char_2009.gif) :
:![[thin space (1/6-em)]](https://www.rsc.org/images/entities/char_2009.gif) 1) composite exhibits a high specific capacitance of 300 F g−1 and energy density of 9.8 W h kg−1. However, the presence of CNTs stabilizes the cycling performance of the composite electrode materials.
1) composite exhibits a high specific capacitance of 300 F g−1 and energy density of 9.8 W h kg−1. However, the presence of CNTs stabilizes the cycling performance of the composite electrode materials.
Introduction
Supercapacitors (SCs) have attracted a great deal of attention due to their unique characteristics of high power, long cycle life and environmental friendliness. SCs are part of alternative energy devices alongside conventional capacitors, fuel cells and batteries.1,2 SCs have a wide range of applications as electrochemical energy storage and supply devices, such as in consumer electronics, electrical utilities, transportation, power supplies, electric vehicles, digital cameras, storage of the energy generated by solar cells etc.3–6SCs are classified into three types based on the specific mechanism of charge storage: electric double layer capacitors (EDLCs), pseudo capacitors (faradaic charge transfer), and a combination of the two (hybrid SCs).2,7 Charge storage mechanisms of EDLCs have been observed in carbon aerogels, activated carbons (ACs), carbon nanotubes (CNTs), graphene, and carbide-derived carbon (CDC). Pseudo capacitors are based on conducting polymers or metal oxides, and the underlying principle is a rapid and reversible redox reaction.2,8,9
Because of its ease of fabrication, low cost, unique multiple redox states, and high specific capacitance, polyaniline (PANI) is a promising conducting polymer for use as a pseudo capacitor electrode.8 But, PANI as an electrode material has low mechanical resistance and poor film forming properties. In addition, due to ion insertion and removal, electrodes are not stable at high scan rates or during long-term cycling.9–11 To overcome these problems, carbon materials can be incorporated as a supportive additive. They can act as an electrode conductive additive for active materials and they can provide additional porosity and surface area resulting in higher capacitance values.12,13 Among various carbon structures, carbon nanotubes (CNTs) with a high surface area, mechanical strength, electrical conductivity, and chemical stability are widely incorporated into electrode materials to enhance their performance.14,15
The selection of binder is crucial for electro-active materials due to stiffness and binding capability. Recently, polyvinylidene fluoride (PVDF),16 polyvinyl alcohol,17 polyvinylpyrrolidone,18 Nafion,19–21 and carboxymethyl cellulose (CMC)22,23 have become popular binders. Among these binders, PVDF is the most commonly used binder; however, its applicability is limited since it is insoluble in water. For preparation of water-based inks, chitosan can be a good alternative. Chitosan is an attractive binder material due to its ease of fabrication, low cost, low toxicity, and flexibility. It also has sufficient thermal stability up to 200 °C.24–26 Compared to other cross-linked polymers, chitosan has a more rigid network and, as a result, better mechanical stability.27 According to previous studies, chitosan aqueous solution can provide enough mechanical strength to bind graphene. Water-based graphene inks can be prepared by using chitosan solution with acetic acid.28,29Chai et al. used chitosan as a binder for a spherical commercial graphite electrode considering that its viscosity can be optimized in aqueous slurries.26 But, as far as we know, this polymer has never been used as a binding material for PANI/MWCNT electrodes until now.
Electrolytes based on aqueous solutions are notable for their low cost and environmental friendliness. Furthermore, water is the best candidate for an electrolyte solvent due to its abundant availability and eco-friendly nature. Aqueous electrolytes provide several advantages over non-aqueous ones, including good ionic conductivity (>100 mS cm−1) enabling high power density. In previous studies, KOH, NaOH, LiOH, and Na2SO4 solutions were used as aqueous electrolytes with various electrodes.30 Among the several sulfate salts, Na2SO4 is a promising candidate mainly as an ion conductor due to its high cation mobility, relatively high solubility in water, and low cost resulting from its abundance in soil.31
In this study, PANI/MWCNT composites were synthesized by in situ chemical oxidation polymerization of aniline in the presence of MWCNTs. It is possible to manufacture materials that are cheap, electrically conductive, mechanically robust, and available in large quantities using this method. The fabricated composites are used as supercapacitor electrode materials. The special aspect of this work is the preparation of an electrode material using an eco-friendly chitosan binder and PANI/MWCNTs in the water medium. In addition, the morphology, specific surface area, and electrochemical performance of these electrodes are discussed in detail. As far as we know, such a water-based binder has never been used before for the preparation of such an electrode material.
Experimental
Materials
Aniline (99.8%, Acros Organics, Belgium), hydrochloric acid (HCl, 37%, Merck, Germany), and ammonium persulfate (APS, 98%, Sigma Aldrich, Darmstadt, Germany) were selected for the synthesis of polyaniline. Multiwalled carbon nanotubes (MWCNTs, NC7000, Nanocyl, Belgium) were selected for the preparation of high surface area carbon structures and synthesis of PANI/MWCNT composites.Na2SO4 (Sigma Aldrich, USA, 99.0 wt%) and a thin graphite sheet current collector T68A (T-Global Technology Co., Ltd, UK; the thickness of the layers is 35 μm with adhesive) were used for the preparation of electrodes and electrolytes. Chitosan (from shrimp shells, low-viscous, Sigma-Aldrich, Germany) was used for the preparation of the binder solution. A DuPont™ Kapton® 200HN film (50 μm thickness, KREMPEL GmbH, Germany) was used as a template for the doctor blade process.
Synthesis of PANI
PANI was synthesized by chemical oxidation polymerization.32 Ammonium persulfate (APS) was chosen as an oxidant. 150 mL of 1 M HCl solution is added to a round-bottom flask. Aniline (1 g, 10.7 mmol) is added under vigorous stirring (ice bath (0–4 °C), 4 h, 250 rpm). APS (2.45 g, 10.7 mmol) dissolved in 50 mL of 1 M HCl solution is then added dropwise to the reaction medium. The polymerization of aniline is performed at 0–4 °C for approximately 4 hours and then continued for 24 hours at 20 °C. The product is filtered and washed with 1 L of Millipore water, 0.5 L of ethanol and 0.5 L of acetone. Finally, the obtained powder is dried in a vacuum oven at 100 °C for 24 hours. The yield is about 1 g.Synthesis of PANI/MWCNT composites
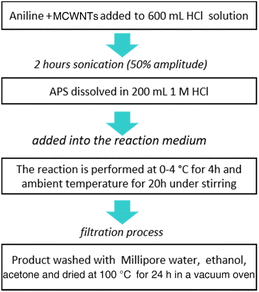
PANI/MWCNT composites were synthesized by in situ chemical oxidation polymerization of aniline in the presence of dispersed MWCNTs. Different weight ratios of aniline and MWCNTs (see Table 1) were mixed in 600 mL of 1 M HCl solution and sonicated (Hielscher Ultrasonics, UP400St, amplitude of 50% and power of 100 W) in a water bath at 0–4 °C for 120 min to produce a homogeneous dispersion before starting the polymerization by dropwise adding a certain amount of ammonium persulfate (APS) as an oxidant dissolved in 200 mL of 1 mol L−1 HCl solution to the reaction medium. The polymerization of aniline was performed at 0–4 °C for 4 h and then at room temperature for 20 h under stirring. The resulting green precipitate was filtered, washed with excess amounts of distilled water, ethanol and acetone, and then dried in a vacuum oven at 100 °C overnight. According to the composition, the composites are labelled PANI/MWCNT (mass ratio of aniline:MWCNTs). These are, respectively, PANI/MWCNT (5![[thin space (1/6-em)]](https://www.rsc.org/images/entities/char_2009.gif) :
:![[thin space (1/6-em)]](https://www.rsc.org/images/entities/char_2009.gif) 1), PANI/MWCNT (10
1), PANI/MWCNT (10![[thin space (1/6-em)]](https://www.rsc.org/images/entities/char_2009.gif) :
:![[thin space (1/6-em)]](https://www.rsc.org/images/entities/char_2009.gif) 1) and PANI/MWCNT (30
1) and PANI/MWCNT (30![[thin space (1/6-em)]](https://www.rsc.org/images/entities/char_2009.gif) :
:![[thin space (1/6-em)]](https://www.rsc.org/images/entities/char_2009.gif) 1). For all composites, the yield of the final powder product is roughly 22 ± 2 g. The scheme of the synthesis process is shown in Fig. 1.
1). For all composites, the yield of the final powder product is roughly 22 ± 2 g. The scheme of the synthesis process is shown in Fig. 1.
| Sample | Aniline![[thin space (1/6-em)]](https://www.rsc.org/images/entities/char_2009.gif) : :![[thin space (1/6-em)]](https://www.rsc.org/images/entities/char_2009.gif) APS (molar ratio) APS (molar ratio) |
Mass (aniline) (g) | Mass (MWCNTs) (g) |
|---|---|---|---|
PANI/MWCNT (5![[thin space (1/6-em)]](https://www.rsc.org/images/entities/char_2009.gif) : :![[thin space (1/6-em)]](https://www.rsc.org/images/entities/char_2009.gif) 1) 1) |
1![[thin space (1/6-em)]](https://www.rsc.org/images/entities/char_2009.gif) : :![[thin space (1/6-em)]](https://www.rsc.org/images/entities/char_2009.gif) 1 1 |
20 | 4 |
PANI/MWCNT (10![[thin space (1/6-em)]](https://www.rsc.org/images/entities/char_2009.gif) : :![[thin space (1/6-em)]](https://www.rsc.org/images/entities/char_2009.gif) 1) 1) |
1![[thin space (1/6-em)]](https://www.rsc.org/images/entities/char_2009.gif) : :![[thin space (1/6-em)]](https://www.rsc.org/images/entities/char_2009.gif) 1 1 |
20 | 2 |
PANI/MWCNT (30![[thin space (1/6-em)]](https://www.rsc.org/images/entities/char_2009.gif) : :![[thin space (1/6-em)]](https://www.rsc.org/images/entities/char_2009.gif) 1) 1) |
1![[thin space (1/6-em)]](https://www.rsc.org/images/entities/char_2009.gif) : :![[thin space (1/6-em)]](https://www.rsc.org/images/entities/char_2009.gif) 1 1 |
20 | 0.66 |
Preparation of electrode inks with the chitosan binder
Chitosan was used as a binder. For ink preparation, chitosan was mixed overnight with water and acetic acid in the chitosan/water/acetic acid ratio of 1.7 g/67.6 g/0.7 g (this solution is called “chitosan binder” in the text). Different inks were prepared by mixing 7 g of binder solution and 3 g of the active material, i.e., the PANI/MWCNT composite or, for comparison, pure PANI and pure MWCNTs. In the dry state, the composition of ink was approximately 5.4 binder/94.6 active material (wt%). Probe sonication (30 min, amplitude of 30%, 100 W) was applied to produce a homogeneous dispersion of the active material in water to prevent agglomeration in the composite ink during coating.Physical characterization
The specific surface areas of PANI/MWCNT composites were measured using an Autosorb iQ MP (Quantachrome, USA) using nitrogen (N2) at 77 K and argon (Ar) at 87 K as adsorbates. The filled sample cells were all heated for degassing at 80 °C in a Quadrasorb under 5 × 10⁻¹⁰ mbar ultra-high vacuum. The surface areas were calculated using the multi-point Brunauer–Emmett–Teller (BET) method.The morphologies of the PANI and PANI/MWCNT composites were characterized with a scanning electron microscope (SEM, Carl Zeiss Microscopy Deutschland GmbH, Oberkochen, Germany) equipped with an XFlash 5060F energy-dispersive X-ray spectrometer (EDX) (Bruker Nano GmbH, Berlin, Germany). Before analysis, the samples were coated with 3 nm Pt by sputter coating. A cross-section of PANI/MWNCT was prepared by embedding the composite in a polystyrene film for EDX measurements. The cross-section block face was prepared with a diamond knife in an ultramicrotome, cutting the embedded particles. The SEM was operated at acceleration voltages of 3 kV and 6 kV for spectroscopy and 6 kV for element mapping. Further morphological examinations of the composites were performed by transmission electron microscopy (Libra120 and Libra200 TEMs, Carl Zeiss Microscopy Deutschland GmbH, Oberkochen, Germany) operated at 120 kV and 200 kV, respectively.
Raman spectra, X-ray diffractograms (XRDs), X-ray photoelectron spectra (XPS), and Fourier transform infrared (FTIR) spectra were used to characterize the structure of PANI/MWCNT composites. The Raman spectra were obtained with a Raman Confocal Imaging System WITEC alpha300R with a 532 nm excitation laser. XRDs were recorded using a two-circle diffractometer XRD 3003 TT (GE Inspection Technology GmbH, Germany) with Cu–K radiation (k = 0.1542 nm). X-ray photoelectron spectroscopy (XPS) was carried out by means of an Axis Ultra photoelectron spectrometer (Kratos Analytical, Manchester, UK) equipped with a monochromatic Al Kα (hν = 1486.6 eV) X-ray source of 300 W at 15 kV. The high-resolution spectra were deconvoluted by means of Kratos spectra deconvolution software.
The thermal properties of the composite samples were examined using a thermogravimetric analyser [TGA Q5000 TA Instruments]. Thermal gravimetric analyses were carried out at a heating rate of 10 °C min−1 up to 800 °C after 10 min isothermal treatment at room temperature under a nitrogen atmosphere.
Electrical properties
The powder electrical conductivity of PANI, MWCNTs, and PANI/MWCNT composites was tested using an in-house built device. Powder-like samples (50 mg) were tested after filling a poly(methyl methacrylate) (PMMA) cylinder with a cavity diameter of 5 mm with the samples. A gold-plated plunger (simultaneously acting as the upper electrode) compressed the sample at defined pressures (5 MPa, 10 MPa, 20 MPa, 25 MPa, and 30 MPa, respectively) against the lower gold-plated electrode simultaneously measuring pressure and electrode distance. The powder electrical conductivity was calculated according to the resistance detected using a DMM 2001 multimeter (Keithley Instruments, USA).Electrochemical characterization
The electrochemical properties of pristine MWCNTs and PANI/MWCNT composites were evaluated by standard cyclic voltammetry (CV) and galvanostatic charge–discharge (GCD) measurements within defined voltage ranges and at different scan rates and different current densities. All the electrochemical measurements were performed on an Ivium-n-Stat potentiostat/galvanostat (Eindhoven, The Netherlands) with both conventional two-electrode and three-electrode systems. 0.5 M Na2SO4 was used as an aqueous electrolyte. An Ag/AgCl electrode and a Pt coil were used as the reference and counter electrodes, respectively. The working electrode in the 3-electrode system was prepared by the doctor blade method. First, graphite current collectors were cut into 1 cm × 2 cm pieces. Polyimide (Kapton) film with a thickness of 50 μm was used as a mask for coating the active material ink (coating size of 1 cm × 1 cm) on the collector using a doctor blade (ERICHSEN MODEL 360, ERICHSEN GmbH & Co. KG, Germany). The active mass of the dried electrode was 0.5 to 1 mg.Fabrication of symmetric supercapacitors
Fabricated symmetric supercapacitors were used in two-electrode measurements. The supercapacitors were fabricated on polyethylene terephthalate (PET film, Melinex ST506 from DuPont Teijin Films, thickness 125 μm). First, a commercial graphite sheet current collector (size of 1 cm × 2 cm) was adhered to the PET film. The inks prepared from pristine MWNCTs and PANI/MWCNT composites were then coated onto the current collectors by using the doctor blade method. The coated electrodes were dried at 60 °C for 1 h. Then, 0.5 M Na2SO4 electrolyte was dropped on the coated electrode until it was completely wet. Finally, two identical electrodes and cellulose separator paper (Dreamweaver Titanium AR40 cellulose paper) were layered together to assemble the supercapacitors, and adhesive tape (468 MP from 3 M) was used for sealing the supercapacitors.Results and discussion
Table 2 shows the powder electrical conductivity values of pristine PANI, MWCNTs, and PANI/MWCNT composites determined at a pressure of 30 MPa. This high pressure is necessary to ensure good interparticle contact of the powder materials. It has been demonstrated that the electrical conductivity of single-walled carbon nanotubes (SWCNTs) ranges from the order of 102 to 106 S cm−1 and that of multi-walled carbon nanotubes (MWCNTs) from 103 to 105 S cm−1, while the conductivity of CNT fibres can range from 10 to 67,000 S cm−1.33,34 The measured MWCNT powder has the highest conductivity of 20 S cm−1 which is in the typical range for powder materials. Pure PANI has a conductivity of 0.09 S cm−1, which increases with rising MWCNT content in the PANI-MWCNT composites. This increase in conductivity in the composites tends to improve the capacitance performance of electrodes. However, the conductivity of all PANI/MWCNT composites is dominated by PANI conductivity, a first hint that direct contact between the MWCNTs is hindered due to the nearly complete coating with PANI.| Sample | Conductivity (S cm−1) |
|---|---|
| PANI | 0.09 |
| MWCNTs | 20 |
PANI/MWCNT (5![[thin space (1/6-em)]](https://www.rsc.org/images/entities/char_2009.gif) : :![[thin space (1/6-em)]](https://www.rsc.org/images/entities/char_2009.gif) 1) 1) |
0.9 |
PANI/MWCNT (10![[thin space (1/6-em)]](https://www.rsc.org/images/entities/char_2009.gif) : :![[thin space (1/6-em)]](https://www.rsc.org/images/entities/char_2009.gif) 1) 1) |
0.33 |
PANI/MWCNT (30![[thin space (1/6-em)]](https://www.rsc.org/images/entities/char_2009.gif) : :![[thin space (1/6-em)]](https://www.rsc.org/images/entities/char_2009.gif) 1) 1) |
0.28 |
Fig. 2 shows the SEM images of the MWCNTs, PANI, and PANI/MWCNT composites. Fig. 2a demonstrates that the MWCNTs have a smooth surface with entangled tube bundles. The outer nanotube diameter of MWCNTs is 10 ± 3 nm.35Fig. 2b shows that pristine PANI exhibits a morphology composed of both agglomerated granular and nanofibrillar particles. Fig. 2c–e show that plenty of PANI particles cover the CNT surface and no smooth MWCNT structures are visible. The high surface area of the nanotubes and their effect on the morphology of the PANI particles coated onto the CNTs increase the effective surface area and thus the number of active sites of the electrode material simultaneously. The diameters of the PANI coated MWCNTs are approximately 90 ± 10 nm in the composite PANI/MWCNT (5![[thin space (1/6-em)]](https://www.rsc.org/images/entities/char_2009.gif) :
:![[thin space (1/6-em)]](https://www.rsc.org/images/entities/char_2009.gif) 1). In addition to the typically granular agglomerated PANI particles, nanofiber-like PANI particles are formed, and they all cover the surface of the MWCNTs (Fig. 2c). Moreover, the weight ratio of aniline to carbon significantly affects the morphology of the composites. The PANI/MWCNT (30
1). In addition to the typically granular agglomerated PANI particles, nanofiber-like PANI particles are formed, and they all cover the surface of the MWCNTs (Fig. 2c). Moreover, the weight ratio of aniline to carbon significantly affects the morphology of the composites. The PANI/MWCNT (30![[thin space (1/6-em)]](https://www.rsc.org/images/entities/char_2009.gif) :
:![[thin space (1/6-em)]](https://www.rsc.org/images/entities/char_2009.gif) 1) composite has higher agglomeration and more granular particles than the others (Fig. 2e).
1) composite has higher agglomeration and more granular particles than the others (Fig. 2e).
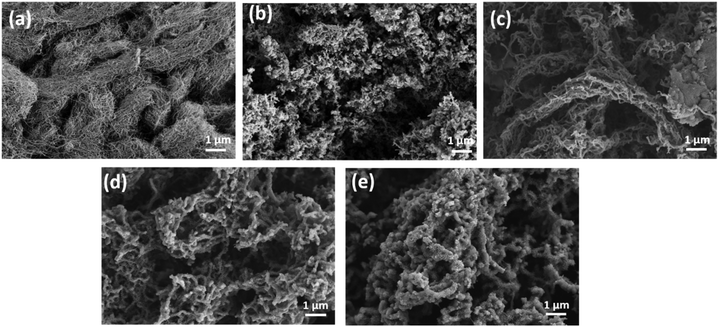 | ||
Fig. 2 SEM images of (a) MWCNTs; (b) pristine PANI; (c) PANI/MWCNT (5![[thin space (1/6-em)]](https://www.rsc.org/images/entities/char_2009.gif) : :![[thin space (1/6-em)]](https://www.rsc.org/images/entities/char_2009.gif) 1); (d) PANI/MWCNT (10 1); (d) PANI/MWCNT (10![[thin space (1/6-em)]](https://www.rsc.org/images/entities/char_2009.gif) : :![[thin space (1/6-em)]](https://www.rsc.org/images/entities/char_2009.gif) 1); and (e) PANI/MWCNT (30 1); and (e) PANI/MWCNT (30![[thin space (1/6-em)]](https://www.rsc.org/images/entities/char_2009.gif) : :![[thin space (1/6-em)]](https://www.rsc.org/images/entities/char_2009.gif) 1). 1). | ||
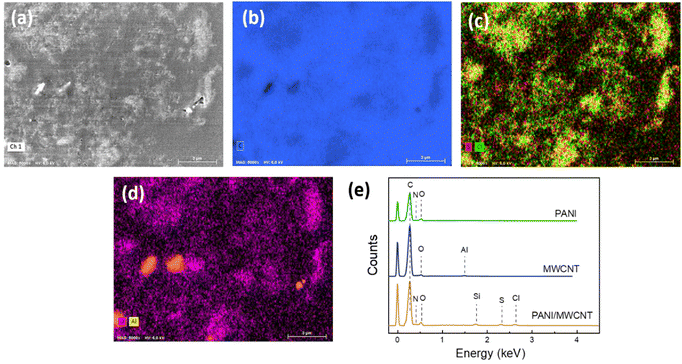
To provide further evidence for the structure of the PANI/MWCNT composites EDX analysis was carried out. Fig. 3 exhibits the SEM image, elemental mapping, and EDX spectra of cross-sections of the particles of the composite material embedded in polystyrene. C, N and O elements exist in the composite main components MWCNTs and PANI. Cl and S ions arise from the oxidant APS and reaction medium HCl used for aniline polymerization. There is also a small amount of Al, which comes from metal impurities of MWCNTs. Si comes from the silicon substrate. In the composite structure, the expected elements of both PANI and MWCNT have been identified.
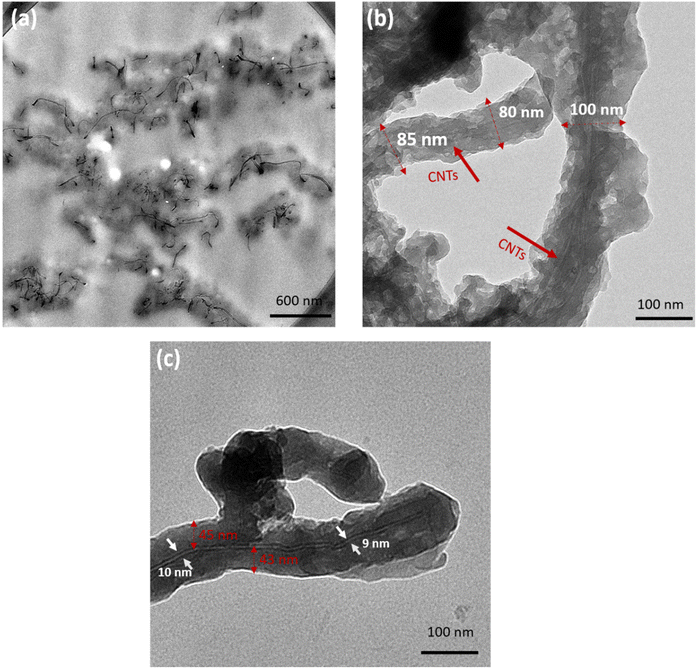
Fig. 4 shows TEM images of PANI/MWCNT composites (5![[thin space (1/6-em)]](https://www.rsc.org/images/entities/char_2009.gif) :
:![[thin space (1/6-em)]](https://www.rsc.org/images/entities/char_2009.gif) 1). Fig. 4a shows a TEM image of a thin section of the composite particles embedded in epoxy resin. The uniform distribution of PANI agglomerates (darker grey) coated on CNTs (black) can be noticed throughout. This indicates that PANI particles are successfully coated on the CNT particles. No uncoated CNTs were found. CNTs coated with PANI can be clearly seen in Fig. 4b and c. The dashed red lines indicate the diameters of individual PANI/MWCNT (5
1). Fig. 4a shows a TEM image of a thin section of the composite particles embedded in epoxy resin. The uniform distribution of PANI agglomerates (darker grey) coated on CNTs (black) can be noticed throughout. This indicates that PANI particles are successfully coated on the CNT particles. No uncoated CNTs were found. CNTs coated with PANI can be clearly seen in Fig. 4b and c. The dashed red lines indicate the diameters of individual PANI/MWCNT (5![[thin space (1/6-em)]](https://www.rsc.org/images/entities/char_2009.gif) :
:![[thin space (1/6-em)]](https://www.rsc.org/images/entities/char_2009.gif) 1) fibers. In agreement with the SEM studies, these are between 80 nm and 100 nm, respectively, corresponding to a coating thickness of between 35 and 45 nm. In Fig. 4c an individual tube with a diameter of 10 ± 2 nm, coated with a PANI layer of 45 ± 10 nm, is shown.
1) fibers. In agreement with the SEM studies, these are between 80 nm and 100 nm, respectively, corresponding to a coating thickness of between 35 and 45 nm. In Fig. 4c an individual tube with a diameter of 10 ± 2 nm, coated with a PANI layer of 45 ± 10 nm, is shown.
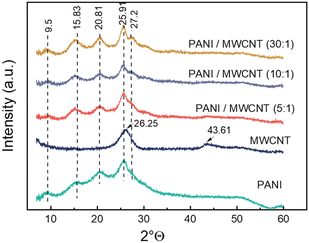
The XRD patterns of the samples are shown in Fig. 5. The diffraction pattern of pristine PANI shows broad peaks at 2θ = 9.5, 15.8°, 20.8°, 25.9°, and 27.2 which are the characteristic peaks of doped PANI.36,37 The diffraction peaks at 2θ = 26.25° and 2θ = 43.61° observed in the MWCNTs correspond to the (002) and (100) surfaces, respectively.38 All composite structures exhibit a crystalline structure similar to that of pristine PANI. In addition, the presence of MWCNTs did not create an additional detectable crystalline order in the composite structure, except a more dominant diffraction at 2θ = 27.2° in the composite.
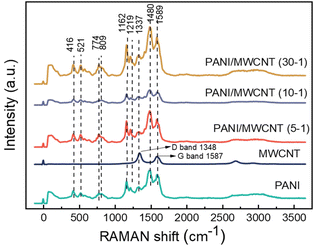
Fig. 6 shows an overview of the Raman spectrum for structural features of MWCNTs, PANI, and PANI/MWCNT composites. First-order Raman spectra of CNTs demonstrate two predominant sharp peaks which are at around 1587 cm−1, G band, and 1348 cm−1, D band. These are consistent with the typical characteristics of graphitic CNTs.39–41 The Raman spectrum of the polyaniline salt shows the typical spectrum of the protonated emeraldine form. The band at 1589 cm−1 represents the C![[double bond, length as m-dash]](https://www.rsc.org/images/entities/char_e001.gif) C stretching of quinoid rings.42–44 Also, the potential contribution of C
C stretching of quinoid rings.42–44 Also, the potential contribution of C![[double bond, length as m-dash]](https://www.rsc.org/images/entities/char_e001.gif) N stretching vibrations in the quinonoid units at 1490 cm−1 is feasible.44 The band seen at 1336 cm−1 shows the C∼N˙+ stretching of the radical cation, a characteristic of doped materials.45 The 1219 cm−1 band represents the benzenoid C–N stretching of PANI.46 The band at 1162 cm−1 displays the C–H in-plane bending vibrations of the semi-quinonoid or benzenoid rings.43,46 The band located at 810 cm−1 is associated with benzene ring deformations.42 The out-of-plane deformations of the ring can be characterized by the bands at 521 and 416 cm−1.47 In different PANI/MWCNT composite materials, all the characteristic peaks of PANI and MWCNTs are observed. However, the signals from MWCNTs strongly overlap with the PANI absorptions and PANI dominates the spectra of all the composites, caused by the low MWCNT content and limited penetration depth of the laser beam, which is a few 100 nm in transparent materials but less in such dark composites.
N stretching vibrations in the quinonoid units at 1490 cm−1 is feasible.44 The band seen at 1336 cm−1 shows the C∼N˙+ stretching of the radical cation, a characteristic of doped materials.45 The 1219 cm−1 band represents the benzenoid C–N stretching of PANI.46 The band at 1162 cm−1 displays the C–H in-plane bending vibrations of the semi-quinonoid or benzenoid rings.43,46 The band located at 810 cm−1 is associated with benzene ring deformations.42 The out-of-plane deformations of the ring can be characterized by the bands at 521 and 416 cm−1.47 In different PANI/MWCNT composite materials, all the characteristic peaks of PANI and MWCNTs are observed. However, the signals from MWCNTs strongly overlap with the PANI absorptions and PANI dominates the spectra of all the composites, caused by the low MWCNT content and limited penetration depth of the laser beam, which is a few 100 nm in transparent materials but less in such dark composites.
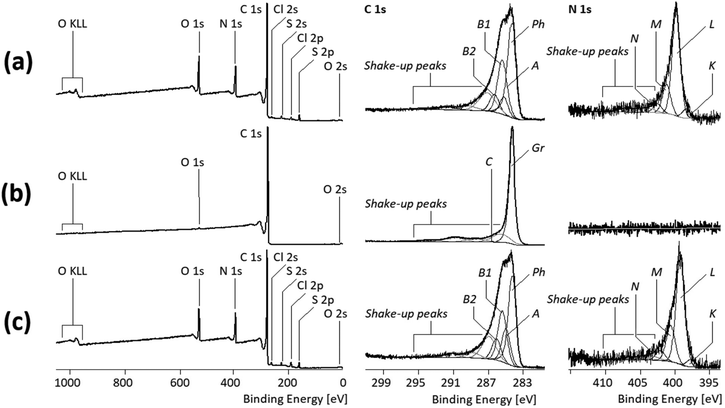
Studies with XPS, a very surface-sensitive analytical method with a maximum information depth of not more than 8 nm, also showed the dominance of PANI on the surface of the PANI/MWCNT composite materials. This is immediately evident when comparing the shapes of the C 1s spectra of the pure PANI polymer (Fig. 7a, middle column) and those of the PANI/MWCNT (5![[thin space (1/6-em)]](https://www.rsc.org/images/entities/char_2009.gif) :
:![[thin space (1/6-em)]](https://www.rsc.org/images/entities/char_2009.gif) 1) composites (Fig. 7c, middle column).
1) composites (Fig. 7c, middle column).
The complex shape of the C 1s spectrum recorded from the pure PANI polymer resulted from the high number of different binding states of the carbon atoms and the involvement of their sp2-hybridized electrons in conjugated π-electron systems. Photoelectrons that escaped from the electronic ground state of the PANI molecules contributed to the component peaks Ph, A, B1, and B2, while the shake-up peaks resulted from photoelectrons that escaped from the excited molecular states of PANI (Fig. 7a). Photoelectrons from carbon atoms, forming the phenyl rings of the PANI units and not having nitrogen atoms as a binding partner, were observed as component peak Ph at 284.12 eV. Traces of saturated hydrocarbons (carbon atoms in the sp3 hybrid state) were observed as component peak A at 285.00 eV. Such carbon atoms must not be constituents of the PANI polymer; they are more indicative of surface contaminations lowering the surface free energy of the PANI particles. The component peak B1 (at 285.24 eV) shows carbon atoms bonded to electrically neutral nitrogen atoms, such as those in the amino groups (B1![[C with combining low line]](https://www.rsc.org/images/entities/char_0043_0332.gif) –NH–B1
–NH–B1![[C with combining low line]](https://www.rsc.org/images/entities/char_0043_0332.gif) ) and imino groups (B1
) and imino groups (B1![[C with combining low line]](https://www.rsc.org/images/entities/char_0043_0332.gif)
![[double bond, length as m-dash]](https://www.rsc.org/images/entities/char_e001.gif) N–B1
N–B1![[C with combining low line]](https://www.rsc.org/images/entities/char_0043_0332.gif) ↔ B1
↔ B1![[C with combining low line]](https://www.rsc.org/images/entities/char_0043_0332.gif) –N
–N![[double bond, length as m-dash]](https://www.rsc.org/images/entities/char_e001.gif) B1
B1![[C with combining low line]](https://www.rsc.org/images/entities/char_0043_0332.gif) ). The stronger shifted component peak B2 (at 285.91 eV) resulted from the photoelectrons removed from carbon atoms bonded to the nitrogen atoms carrying a more or less localized positive charge (B2
). The stronger shifted component peak B2 (at 285.91 eV) resulted from the photoelectrons removed from carbon atoms bonded to the nitrogen atoms carrying a more or less localized positive charge (B2![[C with combining low line]](https://www.rsc.org/images/entities/char_0043_0332.gif) –N⊕H
–N⊕H![[double bond, length as m-dash]](https://www.rsc.org/images/entities/char_e001.gif) B2
B2![[C with combining low line]](https://www.rsc.org/images/entities/char_0043_0332.gif) ↔ B2
↔ B2![[C with combining low line]](https://www.rsc.org/images/entities/char_0043_0332.gif)
![[double bond, length as m-dash]](https://www.rsc.org/images/entities/char_e001.gif) N⊕H–B2
N⊕H–B2![[C with combining low line]](https://www.rsc.org/images/entities/char_0043_0332.gif) and B2
and B2![[C with combining low line]](https://www.rsc.org/images/entities/char_0043_0332.gif) –N⊕H2–B2C). The deconvolution of the N 1s spectrum is consistent with that of the C 1s spectrum. The PANI molecules show only nitrogen–carbon bonds. However, the electron density on the nitrogen atoms varies due to doping and their protonation, so different component peaks (K, L, M, and N) are separated in the N 1s spectrum. The most intense component peak L (at 399.26 eV) resulted from B1C–L
–N⊕H2–B2C). The deconvolution of the N 1s spectrum is consistent with that of the C 1s spectrum. The PANI molecules show only nitrogen–carbon bonds. However, the electron density on the nitrogen atoms varies due to doping and their protonation, so different component peaks (K, L, M, and N) are separated in the N 1s spectrum. The most intense component peak L (at 399.26 eV) resulted from B1C–L![[N with combining low line]](https://www.rsc.org/images/entities/char_004e_0332.gif) H–B1C bridges (secondary amino groups) that connect two phenyl rings. On the lower energy side of component peak L, a weak component peak K was observed at 397.85 eV. The value is extraordinarily low for organically bonded nitrogen atoms. The high local electron density at the nitrogen atoms of imine links (B1C
H–B1C bridges (secondary amino groups) that connect two phenyl rings. On the lower energy side of component peak L, a weak component peak K was observed at 397.85 eV. The value is extraordinarily low for organically bonded nitrogen atoms. The high local electron density at the nitrogen atoms of imine links (B1C![[double bond, length as m-dash]](https://www.rsc.org/images/entities/char_e001.gif) K
K![[N with combining low line]](https://www.rsc.org/images/entities/char_004e_0332.gif) –B1
–B1![[C with combining low line]](https://www.rsc.org/images/entities/char_0043_0332.gif) ↔ B1C–K
↔ B1C–K![[N with combining low line]](https://www.rsc.org/images/entities/char_004e_0332.gif)
![[double bond, length as m-dash]](https://www.rsc.org/images/entities/char_e001.gif) B1C) explains the binding energy value found. The Brønsted basicity of the electrically neutral nitrogen atoms in the secondary amino groups and in the imino groups is subject to protonation/deprotonation equilibria. The protonation of the secondary amino groups resulted in positively charged nitrogen atoms (B2C–M
B1C) explains the binding energy value found. The Brønsted basicity of the electrically neutral nitrogen atoms in the secondary amino groups and in the imino groups is subject to protonation/deprotonation equilibria. The protonation of the secondary amino groups resulted in positively charged nitrogen atoms (B2C–M![[N with combining low line]](https://www.rsc.org/images/entities/char_004e_0332.gif) ⊕H2–B2C), which we observed as the component peak M (at 400.64 eV). The binding energy value found for the component peak M is in the lower expected range for protonated amino groups. One reason for these findings is the strong interaction of the protonated nitrogen atoms with counterions, such as Cl⊖, which are located immediately along the polymer chains (PANI⊕ ← Cl⊖). Furthermore, the positive charge, which should actually be localized on the nitrogen atom, can itself move away from its site due to the polarization field caused by the freely mobile π-electrons. The structure that is formed in the PANI molecules in this way is called a polaron lattice. Photoelectrons from protonated imino groups (B2C–M
⊕H2–B2C), which we observed as the component peak M (at 400.64 eV). The binding energy value found for the component peak M is in the lower expected range for protonated amino groups. One reason for these findings is the strong interaction of the protonated nitrogen atoms with counterions, such as Cl⊖, which are located immediately along the polymer chains (PANI⊕ ← Cl⊖). Furthermore, the positive charge, which should actually be localized on the nitrogen atom, can itself move away from its site due to the polarization field caused by the freely mobile π-electrons. The structure that is formed in the PANI molecules in this way is called a polaron lattice. Photoelectrons from protonated imino groups (B2C–M![[N with combining low line]](https://www.rsc.org/images/entities/char_004e_0332.gif) ⊕H
⊕H![[double bond, length as m-dash]](https://www.rsc.org/images/entities/char_e001.gif) B2C ↔ B2C
B2C ↔ B2C![[double bond, length as m-dash]](https://www.rsc.org/images/entities/char_e001.gif) M
M![[N with combining low line]](https://www.rsc.org/images/entities/char_004e_0332.gif) ⊕H–B2C) also contributed to component peak M if they are part of a polaronic lattice. Protonated amino and imino groups with a positive charge strongly localized at the nitrogen atom were observed as component peak N at 401.95 eV. The involvement of the nitrogen atoms in the conjugated π-electron systems was recognized from the shake-up peaks occurring on the higher energy side of the N 1s spectrum. The presence of partially protonated amine and imine structures accounts for the emeraldine base and salt forms of PANI.9
⊕H–B2C) also contributed to component peak M if they are part of a polaronic lattice. Protonated amino and imino groups with a positive charge strongly localized at the nitrogen atom were observed as component peak N at 401.95 eV. The involvement of the nitrogen atoms in the conjugated π-electron systems was recognized from the shake-up peaks occurring on the higher energy side of the N 1s spectrum. The presence of partially protonated amine and imine structures accounts for the emeraldine base and salt forms of PANI.9
The C 1s spectrum of the MWCNT sample shows only the component peak Gr (at 284.08 eV) representing the sp2-hybridized carbon atoms forming the graphite-like lattices of the MWCNTs (Fig. 7b, middle column). Electronically excited states resulted in tailing of the component peak Gr and the presence of extended shake-up peaks on the high-energy side of the C 1s spectrum. Traces of oxygen ([O]![[thin space (1/6-em)]](https://www.rsc.org/images/entities/char_2009.gif) :
:![[thin space (1/6-em)]](https://www.rsc.org/images/entities/char_2009.gif) [C] = 0.006) detected in the wide-scan spectrum (Fig. 7, left column) are presumably present as phenolic OH groups (component peak C at 286.36 eV).
[C] = 0.006) detected in the wide-scan spectrum (Fig. 7, left column) are presumably present as phenolic OH groups (component peak C at 286.36 eV).
Since the MWCNTs do not contain nitrogen, the fractions of PANI at the surface of the PANI/MWCNT composite materials can be estimated from the relative nitrogen contents ([N]![[thin space (1/6-em)]](https://www.rsc.org/images/entities/char_2009.gif) :
:![[thin space (1/6-em)]](https://www.rsc.org/images/entities/char_2009.gif) [C]). Table 3 summarizes the nitrogen and aromatic carbon contents in PANI and the various PANI/MWCNT composites.
[C]). Table 3 summarizes the nitrogen and aromatic carbon contents in PANI and the various PANI/MWCNT composites.
![[thin space (1/6-em)]](https://www.rsc.org/images/entities/char_2009.gif) :
:![[thin space (1/6-em)]](https://www.rsc.org/images/entities/char_2009.gif) [C]) and partial areas of the component peaks Ph, B1, and B2 of the total area of the C 1s spectra of the pure PANI polymer and the PANI/MWCNT composite materials
[C]) and partial areas of the component peaks Ph, B1, and B2 of the total area of the C 1s spectra of the pure PANI polymer and the PANI/MWCNT composite materials
[N]![[thin space (1/6-em)]](https://www.rsc.org/images/entities/char_2009.gif) : :![[thin space (1/6-em)]](https://www.rsc.org/images/entities/char_2009.gif) [C] [C] |
[Ph]![[thin space (1/6-em)]](https://www.rsc.org/images/entities/char_2009.gif) : :![[thin space (1/6-em)]](https://www.rsc.org/images/entities/char_2009.gif) [C] [C] |
([B1] + [B2])![[thin space (1/6-em)]](https://www.rsc.org/images/entities/char_2009.gif) : :![[thin space (1/6-em)]](https://www.rsc.org/images/entities/char_2009.gif) [C] [C] |
|
|---|---|---|---|
| Pure PANI | 0.156 | 0.447 | 0.285 |
PANI/MWCNT (5![[thin space (1/6-em)]](https://www.rsc.org/images/entities/char_2009.gif) : :![[thin space (1/6-em)]](https://www.rsc.org/images/entities/char_2009.gif) 1) 1) |
0.150 | 0.371 | 0.277 |
PANI/MWCNT (10![[thin space (1/6-em)]](https://www.rsc.org/images/entities/char_2009.gif) : :![[thin space (1/6-em)]](https://www.rsc.org/images/entities/char_2009.gif) 1) 1) |
0.163 | 0.348 | 0.295 |
PANI/MWCNT (30![[thin space (1/6-em)]](https://www.rsc.org/images/entities/char_2009.gif) : :![[thin space (1/6-em)]](https://www.rsc.org/images/entities/char_2009.gif) 1) 1) |
0.135 | 0.380 | 0.252 |
It appears that photoelectrons from the carbon atoms of the MWCNTs do not contribute to the spectral information of the C 1s spectra recorded from the PANI/MWCNT composites. Furthermore, there is no decrease of the relative nitrogen content ([N]![[thin space (1/6-em)]](https://www.rsc.org/images/entities/char_2009.gif) :
:![[thin space (1/6-em)]](https://www.rsc.org/images/entities/char_2009.gif) [C]) with increasing MWCNT content, which one would expect if CNTs contribute to the XPS spectra. In conclusion, the XPS results confirm the complete coating of the CNTs with PANI in the composite.
[C]) with increasing MWCNT content, which one would expect if CNTs contribute to the XPS spectra. In conclusion, the XPS results confirm the complete coating of the CNTs with PANI in the composite.
The TGA weight loss curves and first derivative TGA curves of pristine MWCNTs, pristine PANI, and PANI/MWCNT composites analysed under a nitrogen atmosphere are presented in Fig. 8a and b. The weight loss of pristine MWCNTs at 800° C owing to the thermal decomposition of the carboxyl and hydroxyl groups on MWCNTs at high temperatures is about 4.7 wt%.48 Pristine PANI and PANI/MWCNT composites have a weight loss of about 4.5 wt% at room temperature due to moisture loss in the composite system during the 10 min isothermal treatment at the beginning of the measurement. The weight losses up to around 300 °C are due to the loss of water and volatile components. The thermal decomposition of polyaniline causes major weight loss at around 520 °C.49 The final decomposition stage is above 640°.50 All stages are also seen in composite structures. In the end, the TGA curves of PANI/MWCNT (5![[thin space (1/6-em)]](https://www.rsc.org/images/entities/char_2009.gif) :
:![[thin space (1/6-em)]](https://www.rsc.org/images/entities/char_2009.gif) 1), PANI/MWCNT (10
1), PANI/MWCNT (10![[thin space (1/6-em)]](https://www.rsc.org/images/entities/char_2009.gif) :
:![[thin space (1/6-em)]](https://www.rsc.org/images/entities/char_2009.gif) 1), and PANI/MWCNT (30
1), and PANI/MWCNT (30![[thin space (1/6-em)]](https://www.rsc.org/images/entities/char_2009.gif) :
:![[thin space (1/6-em)]](https://www.rsc.org/images/entities/char_2009.gif) 1) show increasing weight loss with the PANI content of 49.5%, 53.5%, and 57.2%, respectively, while the pristine PANI has a weight loss of 55.4%, which is lower than that of the PANI/MWCNT (30
1) show increasing weight loss with the PANI content of 49.5%, 53.5%, and 57.2%, respectively, while the pristine PANI has a weight loss of 55.4%, which is lower than that of the PANI/MWCNT (30![[thin space (1/6-em)]](https://www.rsc.org/images/entities/char_2009.gif) :
:![[thin space (1/6-em)]](https://www.rsc.org/images/entities/char_2009.gif) 1) sample. The derivative curves clearly show that the degradation behaviour of the pristine PANI and composites is characterized by four different weight loss steps, the sharpness and intensity of which alter with composition. The temperature peaks of derivative weight (Tmax), taken from the derivative curves, and residual masses at the final temperature are reported in Table 4. There is no good correlation between MWCNT content and weight loss, and both the degradation temperatures and the quantity of weight losses are variable at each step. This may be due to different amounts of volatile components in the different materials. Evaporation of volatile components seems to be hampered in the presence of MWCNTs. A weak stabilizing effect of MWCNTs on the thermal degradation at low filler contents is detected, but at higher MWCNT contents the thermal degradation temperature is lowered, possibly caused by the remaining catalysts used for MWCNT preparation.
1) sample. The derivative curves clearly show that the degradation behaviour of the pristine PANI and composites is characterized by four different weight loss steps, the sharpness and intensity of which alter with composition. The temperature peaks of derivative weight (Tmax), taken from the derivative curves, and residual masses at the final temperature are reported in Table 4. There is no good correlation between MWCNT content and weight loss, and both the degradation temperatures and the quantity of weight losses are variable at each step. This may be due to different amounts of volatile components in the different materials. Evaporation of volatile components seems to be hampered in the presence of MWCNTs. A weak stabilizing effect of MWCNTs on the thermal degradation at low filler contents is detected, but at higher MWCNT contents the thermal degradation temperature is lowered, possibly caused by the remaining catalysts used for MWCNT preparation.
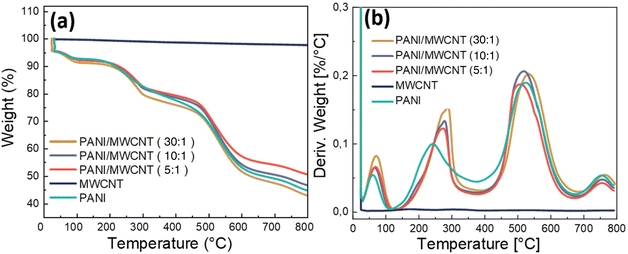 | ||
| Fig. 8 TGA weight loss curves (a) and TGA derivative weight loss curves (b) of pristine PANI, pristine MWCNTs and PANI/MWCNT composites. | ||
| Sample | T max at first stage | T max at second stage | T max at third stage | T max at final stage | Residue at 800 °C |
|---|---|---|---|---|---|
| PANI | 60 | 242 | 525 | 748 | 44.6 |
PANI/MWCNT (5![[thin space (1/6-em)]](https://www.rsc.org/images/entities/char_2009.gif) : :![[thin space (1/6-em)]](https://www.rsc.org/images/entities/char_2009.gif) 1) 1) |
68 | 275 | 505 | 754 | 50.5 |
PANI/MWCNT (10![[thin space (1/6-em)]](https://www.rsc.org/images/entities/char_2009.gif) : :![[thin space (1/6-em)]](https://www.rsc.org/images/entities/char_2009.gif) 1) 1) |
67 | 278 | 518 | 756 | 46.5 |
PANI/MWCNT (30![[thin space (1/6-em)]](https://www.rsc.org/images/entities/char_2009.gif) : :![[thin space (1/6-em)]](https://www.rsc.org/images/entities/char_2009.gif) 1) 1) |
70 | 287 | 532 | 763 | 42.8 |
N2 (77 K) and Ar (87 K) adsorption and desorption isotherms were used to quantify the specific surface area of pristine PANI, MWCNTs, and composites. Table 5 shows that the specific surface areas of PANI, MWCNTs, PANI/MWCNT (5![[thin space (1/6-em)]](https://www.rsc.org/images/entities/char_2009.gif) :
:![[thin space (1/6-em)]](https://www.rsc.org/images/entities/char_2009.gif) 1), PANI/MWCNT (10
1), PANI/MWCNT (10![[thin space (1/6-em)]](https://www.rsc.org/images/entities/char_2009.gif) :
:![[thin space (1/6-em)]](https://www.rsc.org/images/entities/char_2009.gif) 1), PANI/MWCNT (30
1), PANI/MWCNT (30![[thin space (1/6-em)]](https://www.rsc.org/images/entities/char_2009.gif) :
:![[thin space (1/6-em)]](https://www.rsc.org/images/entities/char_2009.gif) 1) are 45 m2 g−1, 202 m2 g−1, 75 m2 g−1, 69 m2 g−1 and 62 m2 g−1, respectively, when argon is used as the adsorbent. The corresponding results when nitrogen is used as the absorbent are 55 m2 g−1, 232 m2 g−1, 86 m2 g−1, 96 m2 g−1, and 73 m2 g−1, respectively. Nitrogen is a diatomic molecule with a quadrupole moment that produces specific interactions at the gas–solid interface, while argon is much less reactive, which means it has no dipole or quadrupole moment, resulting in more accurate results.51 This may be the reason for the higher values in the case of the N2 absorbent. For both N2 and Ar measurements, the specific surface area of MWCNTs is much higher than that of pristine PANI, but the MWCNT addition causes higher specific surface area of the composites than that of pristine PANI. This increase in surface area may lead to higher capacitances, as shown below.
1) are 45 m2 g−1, 202 m2 g−1, 75 m2 g−1, 69 m2 g−1 and 62 m2 g−1, respectively, when argon is used as the adsorbent. The corresponding results when nitrogen is used as the absorbent are 55 m2 g−1, 232 m2 g−1, 86 m2 g−1, 96 m2 g−1, and 73 m2 g−1, respectively. Nitrogen is a diatomic molecule with a quadrupole moment that produces specific interactions at the gas–solid interface, while argon is much less reactive, which means it has no dipole or quadrupole moment, resulting in more accurate results.51 This may be the reason for the higher values in the case of the N2 absorbent. For both N2 and Ar measurements, the specific surface area of MWCNTs is much higher than that of pristine PANI, but the MWCNT addition causes higher specific surface area of the composites than that of pristine PANI. This increase in surface area may lead to higher capacitances, as shown below.
| Sample | Specific surface area (m2 g−1) (Ar) | Specific surface area (m2 g−1) (N2) |
|---|---|---|
| PANI | 45 | 55 |
| MWCNTs | 202 | 232 |
PANI/MWCNT-(5![[thin space (1/6-em)]](https://www.rsc.org/images/entities/char_2009.gif) : :![[thin space (1/6-em)]](https://www.rsc.org/images/entities/char_2009.gif) 1) 1) |
75 | 86 |
PANI/MWCNT-(10![[thin space (1/6-em)]](https://www.rsc.org/images/entities/char_2009.gif) : :![[thin space (1/6-em)]](https://www.rsc.org/images/entities/char_2009.gif) 1) 1) |
69 | 96 |
PANI/MWCNT-(30![[thin space (1/6-em)]](https://www.rsc.org/images/entities/char_2009.gif) : :![[thin space (1/6-em)]](https://www.rsc.org/images/entities/char_2009.gif) 1) 1) |
62 | 73 |
Results of electrochemical measurements
In order to evaluate the electrochemical properties of PANI/MWCNT composites and their potential as a supercapacitor electrode, standard cyclic voltammograms of PANI/MWCNT composites within a potential window of 0 V to 1 V were recorded by using Ag/AgCl as a reference electrode with three-electrode measurement. Fig. 9 shows the cyclic voltammograms of different PANI/MWCNT composites at different scan rates, 5 mV s−1, 20 mV s−1, 50 mV s−1, and 100 mV s−1, respectively. The capacitance of all samples is strongly dependent on the potential scan rate. The composite PANI/MWCNT (5![[thin space (1/6-em)]](https://www.rsc.org/images/entities/char_2009.gif) :
:![[thin space (1/6-em)]](https://www.rsc.org/images/entities/char_2009.gif) 1) has a higher electrochemical current, which leads to higher capacitance than in the other samples. Furthermore, the shape of the CV curves indicates that the pseudocapacitive behaviour of PANI contributes to the final performance of the supercapacitors. Broad oxidation and reduction peaks can be seen, while their intensity depends on the composition and scan rates.
1) has a higher electrochemical current, which leads to higher capacitance than in the other samples. Furthermore, the shape of the CV curves indicates that the pseudocapacitive behaviour of PANI contributes to the final performance of the supercapacitors. Broad oxidation and reduction peaks can be seen, while their intensity depends on the composition and scan rates.
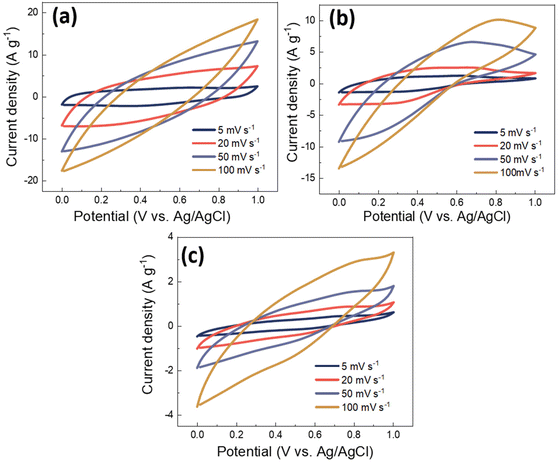 | ||
Fig. 9 Cyclic voltammograms of PANI/MWCNT composites at different scan rates: (a) PANI/MWCNT (5![[thin space (1/6-em)]](https://www.rsc.org/images/entities/char_2009.gif) : :![[thin space (1/6-em)]](https://www.rsc.org/images/entities/char_2009.gif) 1), (b) PANI/MWCNT (10 1), (b) PANI/MWCNT (10![[thin space (1/6-em)]](https://www.rsc.org/images/entities/char_2009.gif) : :![[thin space (1/6-em)]](https://www.rsc.org/images/entities/char_2009.gif) 1) and (c) PANI/MWCNT (30 1) and (c) PANI/MWCNT (30![[thin space (1/6-em)]](https://www.rsc.org/images/entities/char_2009.gif) : :![[thin space (1/6-em)]](https://www.rsc.org/images/entities/char_2009.gif) 1), respectively. 1), respectively. | ||
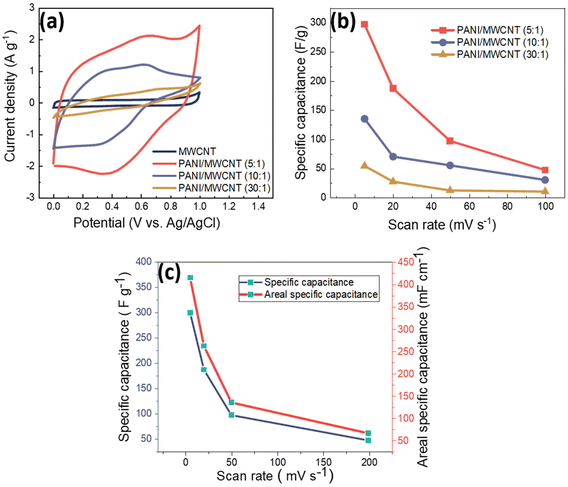
Fig. 10a shows the comparison of the cyclic voltammograms of pristine MWCNTs and different PANI/MWCNT composites at a scan rate of 5 mV s−1 with 0.5 M Na2SO4 neutral electrolyte. The pristine MWCNTs show a typical EDLC rectangular shape which indicates the existence of electrostatic interaction between the MWCNTs and electrolyte. On the other hand, the composites PANI/MWCNT (5![[thin space (1/6-em)]](https://www.rsc.org/images/entities/char_2009.gif) :
:![[thin space (1/6-em)]](https://www.rsc.org/images/entities/char_2009.gif) 1) and PANI/MWCNT (10
1) and PANI/MWCNT (10![[thin space (1/6-em)]](https://www.rsc.org/images/entities/char_2009.gif) :
:![[thin space (1/6-em)]](https://www.rsc.org/images/entities/char_2009.gif) 1) show typical pseudocapacitive behaviour. The broad redox peaks correspond to faradaic transitions between distinct PANI states, such as fully reduced leucoemeraldin, fully oxidized pernigraniline, and the intermediate state of emeraldine.9
1) show typical pseudocapacitive behaviour. The broad redox peaks correspond to faradaic transitions between distinct PANI states, such as fully reduced leucoemeraldin, fully oxidized pernigraniline, and the intermediate state of emeraldine.9
The composite PANI/MWCNT (30![[thin space (1/6-em)]](https://www.rsc.org/images/entities/char_2009.gif) :
:![[thin space (1/6-em)]](https://www.rsc.org/images/entities/char_2009.gif) 1) shows lower electrochemical current at a scan rate of 5 mV s−1, which may cause lower electrochemical performance. This might be explained by the lower surface area of PANI/MWCNT (30
1) shows lower electrochemical current at a scan rate of 5 mV s−1, which may cause lower electrochemical performance. This might be explained by the lower surface area of PANI/MWCNT (30![[thin space (1/6-em)]](https://www.rsc.org/images/entities/char_2009.gif) :
:![[thin space (1/6-em)]](https://www.rsc.org/images/entities/char_2009.gif) 1) and lower powder electrical conductivity, as these properties might affect the interaction at the electrode–electrolyte interface.52 The specific capacitances (F g−1) of samples are calculated from the CV plots according to the following equation:
1) and lower powder electrical conductivity, as these properties might affect the interaction at the electrode–electrolyte interface.52 The specific capacitances (F g−1) of samples are calculated from the CV plots according to the following equation:
 | (1) |
Fig. 10b shows the specific capacitance results of the composites at different scan rates. At all scan rates, the capacity of the PANI/MWCNT (5![[thin space (1/6-em)]](https://www.rsc.org/images/entities/char_2009.gif) :
:![[thin space (1/6-em)]](https://www.rsc.org/images/entities/char_2009.gif) 1) composite was the highest. The increase in the weight ratio of aniline to MWCNTs resulted in a decrease in specific capacitance at all scan rates. The composite PANI/MWCNT (5
1) composite was the highest. The increase in the weight ratio of aniline to MWCNTs resulted in a decrease in specific capacitance at all scan rates. The composite PANI/MWCNT (5![[thin space (1/6-em)]](https://www.rsc.org/images/entities/char_2009.gif) :
:![[thin space (1/6-em)]](https://www.rsc.org/images/entities/char_2009.gif) 1) has specific capacitance values of 300 F g−1, 187 F g−1, 97 F g−1 and 47 F g−1 at scan rates of 5 mV s−1, 20 mV s−1, 50 mV s−1, and 100 mV s−1, respectively. The specific capacitance values of PANI/MWCNT (10
1) has specific capacitance values of 300 F g−1, 187 F g−1, 97 F g−1 and 47 F g−1 at scan rates of 5 mV s−1, 20 mV s−1, 50 mV s−1, and 100 mV s−1, respectively. The specific capacitance values of PANI/MWCNT (10![[thin space (1/6-em)]](https://www.rsc.org/images/entities/char_2009.gif) :
:![[thin space (1/6-em)]](https://www.rsc.org/images/entities/char_2009.gif) 1) are 135 F g−1, 70 F g−1, 55 F g−1 and 30 F g−1 at scan rates of 5 mV s−1, 20 mV s−1, 50 mV s−1 and 100 mV s−1, respectively. The PANI/MWCNT (30
1) are 135 F g−1, 70 F g−1, 55 F g−1 and 30 F g−1 at scan rates of 5 mV s−1, 20 mV s−1, 50 mV s−1 and 100 mV s−1, respectively. The PANI/MWCNT (30![[thin space (1/6-em)]](https://www.rsc.org/images/entities/char_2009.gif) :
:![[thin space (1/6-em)]](https://www.rsc.org/images/entities/char_2009.gif) 1) has the lowest capacitance values. These values are 54 F g−1, F g−1, 11.6 F g−1, and 10.4 F g−1 at the same scan rates, respectively. The agglomeration of the composite revealed by SEM (Fig. 2e), lower specific surface area (62 m2 g−1), and lower electrical conductivity (0.28 S cm−1) might explain the inferior electrochemical performance of the PANI/MWCNT (30
1) has the lowest capacitance values. These values are 54 F g−1, F g−1, 11.6 F g−1, and 10.4 F g−1 at the same scan rates, respectively. The agglomeration of the composite revealed by SEM (Fig. 2e), lower specific surface area (62 m2 g−1), and lower electrical conductivity (0.28 S cm−1) might explain the inferior electrochemical performance of the PANI/MWCNT (30![[thin space (1/6-em)]](https://www.rsc.org/images/entities/char_2009.gif) :
:![[thin space (1/6-em)]](https://www.rsc.org/images/entities/char_2009.gif) 1) composite. At a scan rate of 5 mV s−1, the specific capacitance of pure MWCNTs is only 19.6 F g−1 (Table 6), which is significantly lower than that of any PANI/MWCNT composites. Fig. 10c illustrates the specific capacitance (F g−1) and areal specific capacitance (mF cm−1) of the PANI/MWCNT (5
1) composite. At a scan rate of 5 mV s−1, the specific capacitance of pure MWCNTs is only 19.6 F g−1 (Table 6), which is significantly lower than that of any PANI/MWCNT composites. Fig. 10c illustrates the specific capacitance (F g−1) and areal specific capacitance (mF cm−1) of the PANI/MWCNT (5![[thin space (1/6-em)]](https://www.rsc.org/images/entities/char_2009.gif) :
:![[thin space (1/6-em)]](https://www.rsc.org/images/entities/char_2009.gif) 1) electrode at various scan rates. The areal specific capacitance values were calculated using cyclic voltammograms of electrodes with an area of 1 cm−2. Areal specific capacitance values are 416 mF cm−1, 262.8 mF cm−1, 136 mF cm−1, and 66.6 mF cm−1 at scan rates of 5 mV s−1, 20 mV s−1, 50 mV s−1, and 100 mV s−1, respectively. See Table S1 in the ESI† for areal specific capacitance results across all composites.
1) electrode at various scan rates. The areal specific capacitance values were calculated using cyclic voltammograms of electrodes with an area of 1 cm−2. Areal specific capacitance values are 416 mF cm−1, 262.8 mF cm−1, 136 mF cm−1, and 66.6 mF cm−1 at scan rates of 5 mV s−1, 20 mV s−1, 50 mV s−1, and 100 mV s−1, respectively. See Table S1 in the ESI† for areal specific capacitance results across all composites.
| Sample | Specific capacitancea (CV, F g−1) | Specific capacitanceb (GCD, F g−1) | Energy densityc (W h kg−1) |
|---|---|---|---|
| a From cyclic voltammetry. b From galvanostatic charge discharge, calculated according to eqn (2) and (3). c From galvanostatic charge discharge, calculated according to eqn (4). | |||
| MWCNTs | 19.6 | 21.8 | 0.7 |
PANI/MWCNT (5![[thin space (1/6-em)]](https://www.rsc.org/images/entities/char_2009.gif) : :![[thin space (1/6-em)]](https://www.rsc.org/images/entities/char_2009.gif) 1) 1) |
300 | 277 | 9.8 |
PANI/MWCNT (10![[thin space (1/6-em)]](https://www.rsc.org/images/entities/char_2009.gif) : :![[thin space (1/6-em)]](https://www.rsc.org/images/entities/char_2009.gif) 1) 1) |
135 | 266 | 5.1 |
PANI/MWCNT (30![[thin space (1/6-em)]](https://www.rsc.org/images/entities/char_2009.gif) : :![[thin space (1/6-em)]](https://www.rsc.org/images/entities/char_2009.gif) 1) 1) |
54 | 168 | 0.96 |
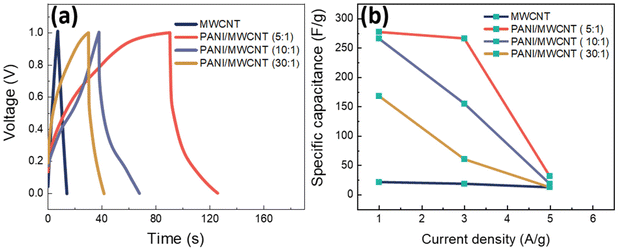
MWCNT and PANI/MWCNT electrodes were used to assemble symmetric SCs with 0.5 M Na2SO4 aqueous electrolyte. Fig. 11a shows the galvanostatic charging discharging (GCD) curves of the pristine MWCNTs and PANI/MWCNT composites at a current density of 1 A g−1. It is observed that the GCD curve of MWCNTs is ideally triangular shaped and well corroborated with the reported literature on activated carbon, carbon nanotubes, carbon black, etc.53,54 In the case of composites, the fact that the discharge curves are not ideal straight lines indicates the presence of a faradaic reaction.55 The shape of the GCD curves of PANI/MWCNT supercapacitors is similar to the reported results in the literature.56,57 From GCD measurements, the specific cell capacitances (Ccell, F) under certain potential were calculated using the equation:
 | (2) |
| Csp = 4Ccell | (3) |
According to the GCD curves in Fig. 11a, the specific capacitance values of pristine MWCNTs, PANI/MWCNT (5![[thin space (1/6-em)]](https://www.rsc.org/images/entities/char_2009.gif) :
:![[thin space (1/6-em)]](https://www.rsc.org/images/entities/char_2009.gif) 1), PANI/MWCNT (10
1), PANI/MWCNT (10![[thin space (1/6-em)]](https://www.rsc.org/images/entities/char_2009.gif) :
:![[thin space (1/6-em)]](https://www.rsc.org/images/entities/char_2009.gif) 1), and PANI/MWCNT (30
1), and PANI/MWCNT (30![[thin space (1/6-em)]](https://www.rsc.org/images/entities/char_2009.gif) :
:![[thin space (1/6-em)]](https://www.rsc.org/images/entities/char_2009.gif) 1) are 21.8 F g−1, 277 F g−1, 266 F g−1, and 168 F g−1 at a current density of 1 A g−1. The capacitances of pristine MWCNTs and composites decrease when the current densities increase (Fig. 11b). This could be mainly caused by the faradaic reaction of ions in the electrolyte and electrode materials during the scanning process. At higher scan rates, the ability of the electrolyte ions to penetrate the surface of the electrode materials is reduced.58,59 The specific capacitance value of the hybrid PANI/MWCNT composite is higher than that of pristine MWCNTs. See Fig. S1 and S2 in the ESI† for all calculated GCD curves at various current densities and cyclic voltammograms of symmetric supercapacitors at different scan rates.
1) are 21.8 F g−1, 277 F g−1, 266 F g−1, and 168 F g−1 at a current density of 1 A g−1. The capacitances of pristine MWCNTs and composites decrease when the current densities increase (Fig. 11b). This could be mainly caused by the faradaic reaction of ions in the electrolyte and electrode materials during the scanning process. At higher scan rates, the ability of the electrolyte ions to penetrate the surface of the electrode materials is reduced.58,59 The specific capacitance value of the hybrid PANI/MWCNT composite is higher than that of pristine MWCNTs. See Fig. S1 and S2 in the ESI† for all calculated GCD curves at various current densities and cyclic voltammograms of symmetric supercapacitors at different scan rates.
One of the most essential parameters for evaluating the performance of energy storage systems is energy density. Based on the GCD curves, the energy density (E, W h kg−1) of these SCs was calculated as follows:
 | (4) |
![[thin space (1/6-em)]](https://www.rsc.org/images/entities/char_2009.gif) :
:![[thin space (1/6-em)]](https://www.rsc.org/images/entities/char_2009.gif) 1) composites, as expected. Pristine MWCNTs have the lowest energy density value which is 0.7 W h kg−1 at 1 A g−1. The enhanced energy density observed in the composites shows that the pseudocapacitance of PANI results in high energy storage capabilities of the final device. However, the energy density values decrease when the aniline/carbon weight ratio increases (Table 6), showing the importance of the presence of highly conductive CNTs for the electrochemical performance of the composite.
1) composites, as expected. Pristine MWCNTs have the lowest energy density value which is 0.7 W h kg−1 at 1 A g−1. The enhanced energy density observed in the composites shows that the pseudocapacitance of PANI results in high energy storage capabilities of the final device. However, the energy density values decrease when the aniline/carbon weight ratio increases (Table 6), showing the importance of the presence of highly conductive CNTs for the electrochemical performance of the composite.
Fig. 12 displays the capacitance retention and coulombic efficiency of PANI/MWCNT (10![[thin space (1/6-em)]](https://www.rsc.org/images/entities/char_2009.gif) :
:![[thin space (1/6-em)]](https://www.rsc.org/images/entities/char_2009.gif) 1) using galvanostatic charge/discharge at 5 A g−1 for 1000 cycles. According to the published research, the cyclic capacitance retention of multi-walled carbon nanotubes can reach higher than 90%, while that of pure PANI is around 75%.60–63 The PANI/MWCNT supercapacitor demonstrated excellent cycling stability, retaining over 90% of its initial capacitance. This result indicates that the presence of MWCNTs increases the capacitance retention value and stability of the final supercapacitor. After undergoing 1000 cycles, the electrode exhibits a remarkably high coulombic efficiency, reaching approximately 80% when subjected to the rather high charging rate of 5 A g−1.
1) using galvanostatic charge/discharge at 5 A g−1 for 1000 cycles. According to the published research, the cyclic capacitance retention of multi-walled carbon nanotubes can reach higher than 90%, while that of pure PANI is around 75%.60–63 The PANI/MWCNT supercapacitor demonstrated excellent cycling stability, retaining over 90% of its initial capacitance. This result indicates that the presence of MWCNTs increases the capacitance retention value and stability of the final supercapacitor. After undergoing 1000 cycles, the electrode exhibits a remarkably high coulombic efficiency, reaching approximately 80% when subjected to the rather high charging rate of 5 A g−1.
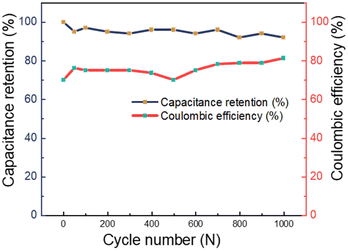 | ||
Fig. 12 Capacitance retention and coulombic efficiency of the PANI/MWCNT (10![[thin space (1/6-em)]](https://www.rsc.org/images/entities/char_2009.gif) : :![[thin space (1/6-em)]](https://www.rsc.org/images/entities/char_2009.gif) 1) supercapacitor for 1000 cycles measured at a current density of 5 A g−1. 1) supercapacitor for 1000 cycles measured at a current density of 5 A g−1. | ||
The behaviour of a supercapacitor is dependent on the charge transport properties of the material, which are influenced by a variety of parameters, including electrolyte resistance, active material/electrolyte interface resistance, and charge transfer resistance.64,65 Therefore, the Nyquist plot of EIS data of the PANI/MWCNT electrode is provided in Fig. S3c in the ESI† to investigate the interfacial properties of the electrode. The Nyquist plot of EIS data of the PANI/MWCNT (10![[thin space (1/6-em)]](https://www.rsc.org/images/entities/char_2009.gif) :
:![[thin space (1/6-em)]](https://www.rsc.org/images/entities/char_2009.gif) 1) symmetric two electrode configuration consists of a semi-circle at high frequencies between points Rs (electrolyte resistance) and Rct (charge transfer resistance) and a nearly vertical line at low frequencies (Warburg diffusion), which is already observed behaviour in other PANI based electrodes.66,67
1) symmetric two electrode configuration consists of a semi-circle at high frequencies between points Rs (electrolyte resistance) and Rct (charge transfer resistance) and a nearly vertical line at low frequencies (Warburg diffusion), which is already observed behaviour in other PANI based electrodes.66,67
Conclusion
In this study, PANI/MWCNT hybrid composites were synthesized by in situ chemical oxidation polymerization of aniline in the presence of MWCNTs. As shown by different analytical methods, in the obtained composites the CNTs are completely coated by PANI, which dominates the material characteristics. Nevertheless, the composites exhibit higher powder electrical conductivities and higher specific surface areas than pristine PANI. For electrochemical measurements, PANI/MWCNT electrode inks with different CNT contents were prepared using the eco-friendly and sustainable bio-polymer chitosan as a binder in water. Sodium sulfate was used as a neutral electrolyte. The PANI/MWCNT composites showed higher specific capacitance (up to 300 F g−1) than the pristine MWCNT electrode (21.8 F g−1) thanks to the combination of electrostatic charge accumulation and reversible redox reactions at the interface between the electrode and the electrolyte. GCD measurements of the PANI/MWCNT (5![[thin space (1/6-em)]](https://www.rsc.org/images/entities/char_2009.gif) :
:![[thin space (1/6-em)]](https://www.rsc.org/images/entities/char_2009.gif) 1) composite show a high energy density of 9.8 W h kg−1 at a current density of 1 A g−1, which is much higher than the values of the pristine MWCNTs, PANI/MWCNT (10
1) composite show a high energy density of 9.8 W h kg−1 at a current density of 1 A g−1, which is much higher than the values of the pristine MWCNTs, PANI/MWCNT (10![[thin space (1/6-em)]](https://www.rsc.org/images/entities/char_2009.gif) :
:![[thin space (1/6-em)]](https://www.rsc.org/images/entities/char_2009.gif) 1), and PANI/MWCNT (30
1), and PANI/MWCNT (30![[thin space (1/6-em)]](https://www.rsc.org/images/entities/char_2009.gif) :
:![[thin space (1/6-em)]](https://www.rsc.org/images/entities/char_2009.gif) 1). These results also indicate that the energy storage mechanism of the final supercapacitor is based on both the pseudocapacitance mechanism and the EDLCs, with the former mechanism dominating. However, the presence of the highly conductive CNTs is required for obtaining good electrochemical performance of the electrode material combined with high cycling stability.
1). These results also indicate that the energy storage mechanism of the final supercapacitor is based on both the pseudocapacitance mechanism and the EDLCs, with the former mechanism dominating. However, the presence of the highly conductive CNTs is required for obtaining good electrochemical performance of the electrode material combined with high cycling stability.
This work demonstrated the feasibility of the eco-friendly chitosan binder for fabrication of PANI/MWCNT electrodes operating in aqueous systems. This will be extended in future work for other PANI based electrode materials.
Author contributions
E. I. Y.: data curation, formal analysis, investigation, methodology, validation, visualization, writing – original draft; J. P.: conceptualization, funding acquisition, methodology, project administration, supervision, writing – review & editing; F. S.: data curation, formal analysis, validation, review & editing; B. V.: data curation, resources, supervision, writing – review & editing.Conflicts of interest
There are no conflicts to declare.Acknowledgements
We appreciate Christine Steinbach for the BET test, Dieter Fischer and Julia Muche for the Raman test, Manuela Heber for SEM analysis, Petr Formanek for EDX and TEM analyses, Regine Boldt for XRD analysis, Kerstin Arnold for TGA analysis and Nanocyl for providing the MWCNTs (NC7000). This work has received funding from the European Union's Horizon 2020 Research and Innovation Programme for project InComEss under Grant Agreement Number 862597.References
- L. L. Zhang and X. Zhao, Chem. Soc. Rev., 2009, 38, 2520–2531 RSC.
- K. Sharma, A. Arora and S. K. Tripathi, J. Energy Storage, 2019, 21, 801–825 CrossRef.
- Y.-S. Chen and C.-C. Hu, Electrochem. Solid-State Lett., 2003, 6, A210 CrossRef CAS.
- G. Wang, L. Zhang and J. Zhang, Chem. Soc. Rev., 2012, 41, 797–828 RSC.
- W. Lu, R. Hartman, L. Qu and L. Dai, J. Phys. Chem. Lett., 2011, 2, 655–660 CrossRef CAS.
- C. Yuan, B. Gao, L. Shen, S. Yang, L. Hao, X. Lu, F. Zhang, L. Zhang and X. Zhang, Nanoscale, 2011, 3, 529–545 RSC.
- M. S. Halper and J. C. Ellenbogen, Supercapacitors: A Brief Overview, The MITRE Corporation, McLean, Virginia, USA, 2006, p. 1 Search PubMed.
- Q. Meng, K. Cai, Y. Chen and L. Chen, Nano Energy, 2017, 36, 268–285 CrossRef CAS.
- X. Zhao, M. Gnanaseelan, D. Jehnichen, F. Simon and J. Pionteck, J. Mater. Sci., 2019, 54, 10809–10824 CrossRef CAS.
- H. Yu, G. Xin, X. Ge, C. Bulin, R. Li, R. Xing and B. Zhang, Compos. Sci. Technol., 2018, 154, 76–84 CrossRef CAS.
- V. Branzoi, F. Branzoi and L. Pilan, Surf. Interface Anal., 2010, 42, 1266–1270 CrossRef CAS.
- A. Fialkov, Russ. J. Electrochem., 2000, 36, 345–366 CrossRef CAS.
- A. G. Pandolfo and A. F. Hollenkamp, J. Power Sources, 2006, 157, 11–27 CrossRef CAS.
- Q. Wang, B. Niu, Y. Han, Q. Zheng, L. Li and M. Cao, Chem. Eng. J., 2023, 452, 139042 CrossRef CAS.
- H. Lin, L. Li, J. Ren, Z. Cai, L. Qiu, Z. Yang and H. Peng, Sci. Rep., 2013, 3, 1353 CrossRef PubMed.
- J. Dong, Z. Wang and X. Kang, Colloids Surf., A, 2016, 489, 282–288 CrossRef CAS.
- M. A. A. M. Abdah, N. A. Rahman and Y. Sulaiman, Electrochim. Acta, 2018, 259, 466–473 CrossRef.
- M. Aslan, D. Weingarth, P. Herbeck-Engel, I. Grobelsek and V. Presser, J. Power Sources, 2015, 279, 323–333 CrossRef CAS.
- S. Cheng, H. Liu and B. E. Logan, Environ. Sci. Technol., 2006, 40, 364–369 CrossRef CAS PubMed.
- J. Xu, Q. Zhang and Y.-T. Cheng, J. Electrochem. Soc., 2015, 163, A401 CrossRef.
- F. Lufrano and P. Staiti, Electrochim. Acta, 2004, 49, 2683–2689 CrossRef CAS.
- L. El Ouatani, R. Dedryvère, J.-B. Ledeuil, C. Siret, P. Biensan, J. Desbrières and D. Gonbeau, J. Power Sources, 2009, 189, 72–80 CrossRef CAS.
- Z. Wang, N. Dupré, A.-C. Gaillot, B. Lestriez, J.-F. Martin, L. Daniel, S. Patoux and D. Guyomard, Electrochim. Acta, 2012, 62, 77–83 CrossRef CAS.
- N. A. Salleh, S. Kheawhom and A. A. Mohamad, Results Phys., 2021, 25, 104244 CrossRef.
- L. Ng and A. Mohamad, J. Membr. Sci., 2008, 325, 653–657 CrossRef CAS.
- L. Chai, Q. Qu, L. Zhang, M. Shen, L. Zhang and H. Zheng, Electrochim. Acta, 2013, 105, 378–383 CrossRef CAS.
- D. Bresser, D. Buchholz, A. Moretti, A. Varzi and S. Passerini, Energy Environ. Sci., 2018, 11, 3096–3127 RSC.
- M. Arvani, J. Keskinen, D. Lupo and M. Honkanen, J. Energy Storage, 2020, 29, 101384 CrossRef.
- H. Pourkheirollah, J. Keskinen, M. Mäntysalo and D. Lupo, J. Power Sources, 2022, 535, 231475 CrossRef CAS.
- K. Chen and D. Xue, Chem. Rec., 2018, 18, 282–292 CrossRef CAS PubMed.
- A. Virya, J. Abella, A. Grindal and K. Lian, The Electrochemical Society, 2019, 1517–1517 Search PubMed.
- N. Gospodinova and L. Terlemezyan, Prog. Polym. Sci., 1998, 23, 1443–1484 CrossRef CAS.
- A. Lekawa-Raus, J. Patmore, L. Kurzepa, J. Bulmer and K. Koziol, Adv. Funct. Mater., 2014, 24, 3661–3682 CrossRef CAS.
- B. Earp, D. Dunn, J. Phillips, R. Agrawal, T. Ansell, P. Aceves, I. De Rosa, W. Xin and C. Luhrs, Mater. Res. Bull., 2020, 131, 110969 CrossRef CAS.
- J.-P. Tessonnier, D. Rosenthal, T. W. Hansen, C. Hess, M. E. Schuster, R. Blume, F. Girgsdies, N. Pfänder, O. Timpe and D. S. Su, Carbon, 2009, 47, 1779–1798 CrossRef CAS.
- X. Lu, H. Dou, S. Yang, L. Hao, L. Zhang, L. Shen, F. Zhang and X. Zhang, Electrochim. Acta, 2011, 56, 9224–9232 CrossRef CAS.
- B. S. Singu, P. Srinivasan and S. Pabba, J. Electrochem. Soc., 2011, 159, A6 CrossRef.
- D. Y. Lee, M.-H. Lee, K. J. Kim, S. Heo, B.-Y. Kim and S.-J. Lee, Surf. Coat. Technol., 2005, 200, 1920–1925 CrossRef CAS.
- M. Zdrojek, W. Gebicki, C. Jastrzebski, T. Melin and A. Huczko, Solid State Phenom., 2004, 265–268 CAS.
- M. S. Mohamed Saheed, M. M. Norani and Z. A. Burhanudin, Materials Science Forum, Trans Tech Publications Ltd., 2013, 156–163 Search PubMed.
- M. S. Dresselhaus, G. Dresselhaus, R. Saito and A. Jorio, Phys. Rep., 2005, 409, 47–99 CrossRef.
- M.-I. Boyer, S. Quillard, E. Rebourt, G. Louarn, J. Buisson, A. Monkman and S. Lefrant, J. Phys. Chem. B, 1998, 102, 7382–7392 CrossRef CAS.
- G. Louarn, M. Lapkowski, S. Quillard, A. Pron, J. Buisson and S. Lefrant, J. Phys. Chem., 1996, 100, 6998–7006 CrossRef CAS.
- J. Stejskal, M. Trchová, P. Bober, P. Humpolíček, V. Kašpárková, I. Sapurina, M. A. Shishov and M. Varga, Encycl. Polym. Sci. Technol., 2002, 1–44 Search PubMed.
- T. Fukuda, H. Takezoe, K. Ishikawa, A. Fukuda, H. S. Woo, S. K. Jeong, E. J. Oh and J. S. Suh, Synth. Met., 1995, 69, 175–176 CrossRef CAS.
- W. Wang, F. Yang, C. Chen, L. Zhang, Y. Qin and M. Knez, Adv. Mater. Interfaces, 2017, 4, 1600806 CrossRef.
- P. Colomban, S. Folch and A. Gruger, Macromolecules, 1999, 32, 3080–3092 CrossRef CAS.
- S. Song, S. Xia, S. Jiang, X. Lv, S. Sun and Q. Li, Materials, 2018, 11, 347 CrossRef PubMed.
- V. Saadattalab, A. Shakeri and H. Gholami, Prog. Nat. Sci.: Mater. Int., 2016, 26, 517–522 CrossRef CAS.
- S. B. Brachetti-Sibaja, D. Palma-Ramírez, A. M. Torres-Huerta, M. A. Domínguez-Crespo, H. J. Dorantes-Rosales, A. E. Rodríguez-Salazar and E. Ramírez-Meneses, Polymers, 2021, 13, 351 CrossRef CAS PubMed.
- J. Silvestre-Albero, A. Silvestre-Albero, F. Rodríguez-Reinoso and M. Thommes, Carbon, 2012, 50, 3128–3133 CrossRef CAS.
- R. Jose, S. Krishnan, B. Vidyadharan, I. Misnon, M. Harilal, R. Aziz, J. Ismail and M. Yusoff, Mater. Today: Proc., 2016, 3, S48–S56 CrossRef.
- R. Xu, J. Wei, F. Guo, X. Cui, T. Zhang, H. Zhu, K. Wang and D. Wu, RSC Adv., 2015, 5, 22015–22021 RSC.
- L. Zhang, Y. Chi, Z. Li, X. Sun, H. Gu, H. Zhang, Y. Chen and G. Z. Chen, J. Electrochem. Soc., 2020, 167, 040524 CrossRef CAS.
- C. Chen, Q. Zhang and C. Peng, Polym. Polym. Compos., 2017, 25, 483–488 CAS.
- J. Iqbal, M. O. Ansari, A. Numan, S. Wageh, A. Al-Ghamdi, M. G. Alam, P. Kumar, R. Jafer, S. Bashir and A. Rajpar, Polymers, 2020, 12, 2918 CrossRef CAS PubMed.
- J. Ben, Z. Song, X. Liu, W. Lü and X. Li, Nanoscale Res. Lett., 2020, 15, 1–8 CrossRef PubMed.
- Q. B. Le, T.-H. Nguyen, H. Fei, C. Bubulinca, L. Munster, N. Bugarova, M. Micusik, R. Kiefer, T. T. Dao and M. Omastova, Sci. Rep., 2022, 12, 664 CrossRef CAS PubMed.
- T. Brousse, M. Toupin, R. Dugas, L. Athouel, O. Crosnier and D. Belanger, J. Electrochem. Soc., 2006, 153, A2171 CrossRef CAS.
- P. Zhang, X. Zhai, H. Huang, J. Zhou, X. Li, Y. He and Z. Guo, J. Mater. Sci.: Mater. Electron., 2020, 31, 14625–14634 CrossRef CAS.
- S. K. Ujjain, R. Bhatia, P. Ahuja and P. Attri, PLoS One, 2015, 10, e0131475 CrossRef PubMed.
- G. A. Ali, E. Megiel, P. Cieciórski, M. R. Thalji, J. Romański, H. Algarni and K. F. Chong, J. Mol. Liq., 2020, 318, 114064 CrossRef CAS.
- H. Lyu, Polymers, 2019, 12, 49 CrossRef PubMed.
- B. Dolah, M. Othman, M. Deraman, N. Basri, R. Farma, I. Talib and M. Ishak, J. Phys.: Conf. Ser., 2013, 431, 012015 CrossRef CAS.
- H. S. Magar, R. Y. Hassan and A. Mulchandani, Sensors, 2021, 21, 6578 CrossRef CAS PubMed.
- R. L. Razalli, M. M. Abdi, P. M. Tahir, A. Moradbak, Y. Sulaiman and L. Y. Heng, RSC Adv., 2017, 7, 25191–25198 RSC.
- Q. Zheng, H. Wu, Z. Shen, W. Gao, Y. Yu, Y. Ma, W. Guang, Q. Guo, R. Yan and J. Wang, Analyst, 2015, 140, 6660–6670 RSC.
Footnote |
| † Electronic supplementary information (ESI) available. See DOI: https://doi.org/10.1039/d3lp00061c |
| This journal is © The Royal Society of Chemistry 2023 |

