 Open Access Article
Creative Commons Attribution 3.0 Unported Licence
Imidazolium and picolinium-based electrolytes for electrochemical reduction of CO2 at high pressure†
Sofia
Messias
a,
Vitória
Paz
a,
Hugo
Cruz
 a,
Carmen M.
Rangel
 b,
Luís C.
Branco
 a and
Ana S.
Reis-Machado
 *a
*a
aLAQV, REQUIMTE, Departamento de Química, Nova School of Science and Technology-FCT-NOVA, Caparica, 2829-516, Portugal. E-mail: ams.machado@fct.unl.pt
bLaboratório Nacional de Energia e Geologia, Estrada do Paço do Lumiar, 22 Lisboa, 1649-038, Portugal
First published on 30th March 2022
Abstract
Ionic liquids (ILs) have been considered among one of the most promising materials under investigation for integration of CO2 capture and electrochemical reduction (ECR). In the design of an IL-based electrolyte that can be employed industrially, the understanding of the influence of IL structure on ECR was considered essential. In this context, electrolytes with trifluoromethanosulfonate (OTf) anion were investigated as aqueous electrolytes for electrochemical reduction of CO2 at high pressure and near room temperature with zinc electrodes. The effect of replacing the 1-ethyl-3-methyl-imidazolium cation [EMIM] by 1-ethyl-3-picolinium [C2(3)pic] and by 1-ethyl-4-picolinium [C2(4)pic] cations was studied. The use of picolinium-based electrolytes in ECR is for the first time reported. A high-pressure single compartment test bed was used for electrolyte screening. Carbon monoxide productivities and selectivities were determined for the several electrolytes with different water contents. The electrolytes were characterized by cyclic voltammetry and electrochemical impedance spectroscopy. Electrolyte conductivities and diffusion coefficients were estimated. The effect of the cations is complex as it affects conductivity, double layer structure, reaction reversibility and even the ionic liquid physical state. Notwithstanding, it is possible to tune these properties to achieve similar CO productions with reduced IL amounts, considering the nature of the cation and the water content, leading to the design of more cost effective electrolytes for efficient ECR process.
1. Introduction
Ionic liquids (ILs) are emerging as an eco-friendly alternative resource with applications in a wide range of technological fields. One of these applications is in electrochemical CO2 reduction (ECR). In fact, they have been considered among one of the most promising materials under investigation for this process.1 ECR is a CO2 utilization research technology that is being intensively investigated not only for obtaining chemical building blocks and fuels, but as an excellent future option to store energy from renewable sources, such as solar and wind energy, that are seasonal, intermittent and geographically dependent.Some families of ILs exhibit high CO2 absorption capacity,2,3 reasonable ionic conductivities, wide electrochemical stability windows,4 high thermal and chemical stability,5 negligible volatility6 and the ability to stabilize CO2 charged species facilitating ECR. These properties make them particularly suited as electrolytes for CO2 reduction. There have been several explanations for the role of ILs in promoting ECR. Some authors proposed that the imidazolium cations act as co-catalysts by reducing the activation energy for the formation of the CO2 radical anion,7 or by the formation of imidazolinium radicals. In the first case, possibly through protons at the C2, N1, and N3 positions,8 or by hydrogen bonding with C4 and C5 positions. In the second case by the reduction on an Ag electrode surface, while other types of cations, such as ammonium and pyrrolidinium are effective by modifying the electrochemical double layer.9
Besides the ILs capability to act as co-catalyst, they offer the possibility of further integration with CO2 capture, once ionic liquids are also being used as CO2 capture agents at pilot scale.10 This also contributes to increase the energy efficiency of the whole process of CO2 capture and conversion.
In an earlier study,11 the authors have reported for the first time, a process for co-electrolysis of CO2 and water into syngas, near room temperature in a pressurized reactor using an IL-based electrolyte according to the reactions given by eqn (1)–(3). Equilibrium cell potentials in standard conditions are also indicated.12,13
| CO2 + 2H+ + 2e− →CO + H2O E0 = −0.10 V vs. SHE | (1) |
| 2H+ + 2e− → H2 E0 = 0.0 V vs. SHE | (2) |
| H2O → 2H+ + ½ O2 + 2e− E0 = + 1.23 V vs. SHE | (3) |
This reactor can operate up to 100 bar and 80 °C, with a configuration similar to an alkaline electrolyser, for hydrogen production suitable to be used industrially. A zinc cathode was selected due to its high selectivity for CO and low cost. This metal has been shown to be an effective catalyst for ECR.14,15
ILs are also characterised by their tuneable properties. These properties arise from the possibility of combining different cations and anions yielding a large number of possibilities. Several works have reviewed electrochemical reduction of CO2 in ILs.16–21 According to literature only a relative limited number of IL-based electrolytes have been reported. In order to design an IL-based electrolyte that can be employed industrially, the understanding of the influence of IL structure on ECR is crucial. In this work, aqueous solutions of ILs belonging to the family of imidazolium and picolinium ionic liquids are characterized and compared to each other. To the authors best knowledge this is the first report of the use of picolinium-based electrolytes in ECR. In particular, the effect of replacing the 1-ethyl-3-methyl-imidazolium cation [EMIM] by the 1-ethyl-3-picolinium [C2(3)pic] and 1-ethyl-4-picolinium [C2(4)pic] cations of ILs combined with trifluoromethanosulfonate (OTf) anion are investigated as electrolytes for electrochemical reduction of CO2 at high pressure with zinc electrodes.
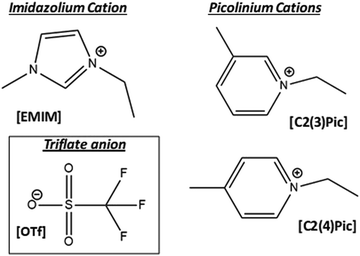
Fig. 1 shows the chemical structure of the ionic liquids employed in this work. [C2(4)pic][OTf] is solid at room temperature, but liquid at the temperature of 45 °C, under which all electrolytes were tested.
ILs are generally more viscous than water, leading to mass transfer limitations. Few studies report the influence of water in ECR in aqueous IL electrolytes.22 The use of aqueous IL solutions is advantageous as water can play the role of viscosity reducing agent, proton source as well as active reaction mediator. These solutions will also be more cost effective than pure ILs. However, increased water contents may decrease CO2 absorption by the electrolyte affecting negatively both CO2 capture and ECR processes. The authors are undertaking screening studies of aqueous IL systems in order to design aqueous IL solutions that can be used as media to integrate CO2 capture with conversion, and it is possible to work well at higher water contents. Thus, the effect of different water contents is studied. The nature of the electrolyte considerably influences the performance of ECR.23 Due to the complexity of the reaction system, it is not straightforward to establish structure–activity correlations. The authors also used electrochemical impedance spectroscopy to determine parameters useful in order to establish correlations for IL-based electrolyte screening.
2. Experimental
2.1 Materials and reagents
1-Ethyl-3-methyl-imidazolium trifluoromethanesulfonate (triflate) (Iolitec > 99% purity) was dried overnight before use. 1-Ethyl-3-picolinium triflate ([C2(3)pic][OTf]) and 1-ethyl-4-picolinium triflate ([C2(4)pic][OTf]) were synthetized in our lab according optimized synthetic procedure. The chemicals required for the preparation of ILs, were used without further purification including 3- and 4-methylpyridine (99%, Sigma-Aldrich), 1-bromoethane (98%, Alfa Aesar), and sodium triflluoromethanesulfonate (98+%, Alfa Aesar). 1H and 19F NMR spectra in DMSO (from Euriso-Top) were recorded on a Bruker AMX400 spectrometer at room temperature. Chemical shifts are reported downfield in parts per million (ppm). Elemental analysis was obtained on a Thermofinnigan Flash EA 1112 Series instrument, and it was performed by the Laboratório de Análises at LAQV-REQUIMTE.Carbon dioxide and Nitrogen from Air Liquide (N45 purity 99.995% and 99.999 purity respectively) were used.
2.2 Synthesis of ionic liquids
The first synthetic step was based on microwave reaction by mixing the equivalent molar ratio between 3- or 4-methylpiridine with 1-bromoethane in acetonitrile at 120 °C during 30 min. After reaction, the mixture was purified by evaporation of the solvent and then extractions with diethyl ether. The final product was dried under vacuum. The second step was based on the anion exchange reaction using the previous bromide salts [C2(3)pic][Br] and [C2(4)pic][Br] dissolved in ethanol and a slight excess (1.1 molar equivalent) of the sodium trifluoromethanesulfonate. The mixture was stirred at room temperature during 24 h. The mixture was filtrated and the desired product was isolated and dried under vacuum.2.3. Electrochemical experiments
3. Results and discussion
3.1. Cyclic voltammetry characterization
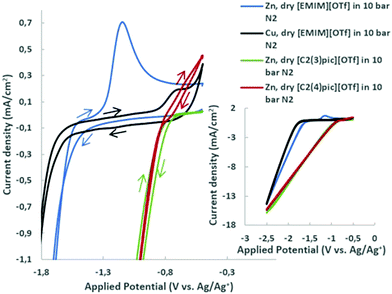
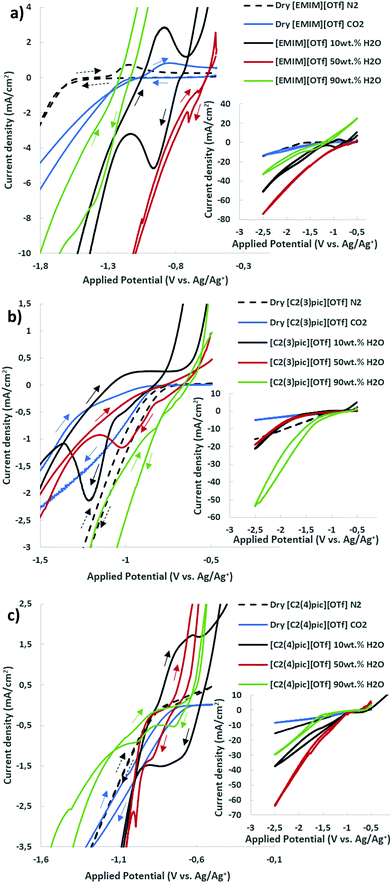
The voltammograms of dry ILs at 45 °C in 10 bar N2 atmosphere are presented in Fig. 2 for copper and zinc cathodes. Onset potentials were evaluated in the conditions under study and defined as the potential at which the current density reaches −1 mA cm−2.25 It can be clearly observed, in the aforementioned Figure, that the replacement of the cation [EMIM]+ by [C2(3)pic]+ and [C2(4)pic]+ cations substantially changes the onset potential from −1.8 V vs. Ag/Ag+ (QRE) to −0.96 V and −0.99 V vs. Ag/Ag+ (QRE), respectively. On the contrary, the position of the methyl substitution on the pyridine ring doesn’t affect significantly the onset potential. The oxidation peak at −0.70 V vs. Ag/Ag+ (QRE) in the voltammogram of dry EMIMOTf in nitrogen atmosphere was assigned to the oxidation of reduced [EMIM]+ cations26,27 and is consistent with the results obtained by Wang et al. for copper surfaces,28 who have indicated that reduce imidazolium cation layer serves as the active site for ECR. Thus, reduced [EMIM]+ cations or related species are formed on the surface of Cu electrode and yield the oxidation peak on the reverse scan. In the same conditions, a more prominent oxidation peak at −1.18 V vs. Ag/Ag+ (QRE) can be observed for the zinc electrode. This reduced [EMIM]+ cation layer was shown to facilitate CO2 reduction, while simultaneously suppressing hydrogen evolution on copper surfaces.28 The reduced species has been proposed to be [EMIM]+ radical. This oxidation peak is not visible in the voltammograms of the picolinium ILs. Oxidation of zinc cathode may not allow the observation of this peak.The effect of different water compositions on the voltammograms was also investigated. Fig. 3 shows the cyclic voltammograms of the aqueous IL-based electrolytes together with the voltammograms of the dry ILs in N2 and CO2 atmosphere for comparison.
For the dried electrolyte with [EMIM]+ cation in CO2 atmosphere, Fig. 3(a), the oxidation peak at −0.86 V vs. Ag/Ag+ (QRE) is shifted to less negative potentials, when compared with the oxidation peak at −1.18 V vs. Ag/Ag+ (QRE) in N2 atmosphere. However, when water is added (10 wt%) the oxidation peak increases significantly and is correlated with a clear reduction process. This latter process involves not only CO2, but also the [EMIM]+ cation, as the oxidation peak is observed in N2 atmosphere. This illustrates also the role of water in promoting the catalytic activity of imidazolium cation. For the electrolytes with the [EMIM]+ cation, the highest current densities can be observed for a water composition of 50 wt%. For this composition, a small reduction peak is observed at −0.70 V vs. Ag/Ag+ (QRE) and a shoulder at −0.63 V vs. Ag/Ag+ (QRE) probably corresponding to the oxidation process of the [EMIM]+ cation. Onset potentials (Eonset) decrease with increasing water content but increase for water content of 90 wt% (see Table S1 of ESI†). These shifts in potential must be considered with care as they will depend on activity coefficients of water and H+ at the different concentrations. When the water content is 90 wt%, current densities decrease significantly, possibly reflecting the decrease in CO2 solubility when water content increases,29 possible equilibrium potential shifts may not be disregarded.30
For the electrolytes with the [C2(3)pic]+ cation (Fig. 3b)) Eonset decreases with increasing water content (Table S1, ESI†) with the exception of the 50 wt% composition that shows the most negative Eonset at −1.22 V vs. Ag/Ag+ (QRE). The highest current densities are obtained with the electrolyte with 90 wt% of water. One intense irreversible reduction process is observed for the composition of 10 wt% water with a peak at −1.22 V vs. Ag/Ag+ (QRE). Water plays clearly an important role in the reaction. This peak is shifted to −0.98 V vs. Ag/Ag+ (QRE) when water composition increases to 50 wt%. No peaks are observed for 90 wt% water composition.
For the electrolytes with the [C2(4)pic]+ cation (Fig. 3c)), Eonset doesn’t decrease significantly with increasing water content (Table S1, ESI†), but it becomes more negative for water content of 90 wt%. An oxidation peak at −0.62 V vs. Ag/Ag+ (QRE) for 10 wt% of water assigned to the oxidation of the [C2(4)pic]+ cation radical (Table S1, Fig. S2, ESI†) can be observed. The highest current densities are obtained with the electrolyte with 10 wt% water for the low overpotential region. For 90 wt% water the voltammogram shows two peaks at −0.73 V and −0.97 V vs. Ag/Ag+ (QRE). These peaks are probably due to the reduction of physically adsorbed and chemisorbed CO2 through a complex of electrogenerated picolinium radical, respectively. Two reduction peaks shifted to more negative values −0.88 V and −0.99 V vs. Ag/Ag+ (QRE) are also observed when water content decreases to 50 wt%. At more negative potentials the electrolyte with 50 wt% water shows the highest current densities. Fig. S2 (ESI†) compares the CVs of different electrolytes with the same water composition. For the composition of 10 wt% and 50 wt% of water the [EMIM]+ cation shows the highest reduction current density. With the increase of the percentage of water to 90 wt% [C2(3)pic]+ and [C2(4)pic]+ cations show the highest cathodic current densities in the low overpotential region.
3.2. Electrochemical reduction of CO2
CO2 electrochemical reduction was carried out at 45 °C in 10 bar CO2 atmosphere, with zinc as cathode and sacrificial anode and 10 C charge passed. A first set of electrolyses were undertaken at an applied current density range of −0.65 to −0.85 mA cm−2. In Fig. 4 the productions of H2 and CO obtained are presented for the different electrolyte solutions. It can be observed that for the [Emim]+ based-electrolyte when water content in the electrolyte is increased the production of CO tends to decrease, on the other hand for picolinium cations [C2(3)pic]+ and [C2(4)pic]+ the opposite trend is observed. Comparing CO production obtained with the [EMIM]+ electrolyte with 10 wt% of water, with the [C2(4)pic]+ electrolyte with 90 wt% of water it is possible conclude that these two results are quite similar, with CO production of ca. 14 μmol cm−2. Fig. 4 also depicts the H2/CO ratios of the electrolyses. It can also be observed that the higher current densities obtained with the [EMIM][OTf] electrolyte with 50 wt% water correspond to a higher selectivity for hydrogen production.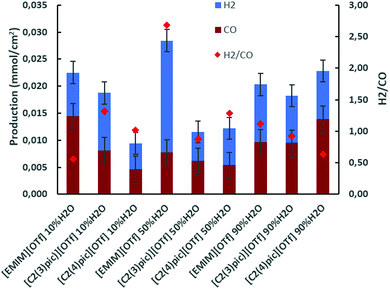 | ||
| Fig. 4 Electrolysis on Zinc cathodes at 45 °C, 10 bar CO2 applied current density in the range of −0.65 to −0.85 mA cm−2 and 10 C of charge passed. | ||
A second set of electrolyses was carried out in the same conditions as previously but for applied current densities in the range of −6 to −7.3 mA cm−2 and 50 C charge passed. Fig. 5 shows H2 and CO productions. This Figure shows that the same trend of increased CO production with increasing content of water in the picolinium-based electrolytes, persists at these higher currents.
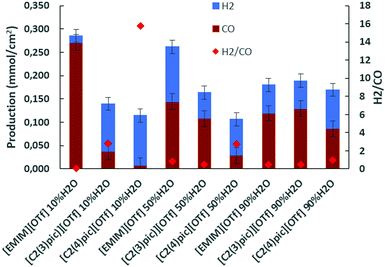 | ||
| Fig. 5 Electrolysis on Zinc cathodes at 45 °C, 10 bar CO2 applied current density of −7 mA cm−2 and 50 C of charge passed. | ||
The selectivity to the products is measured by the faradaic efficiency (FE) of the electrochemical reaction, calculated by the following equation,
 | (4) |
 | (5) |
| Cation | [H2O] in the electrolyte (wt%) | Production (mmol cm−2) | NFE (%) | Total FE (%) |
|---|---|---|---|---|
| [EMIM]+ | 10 | H2: 8.10 × 10⁻³ | H2: 35.96 | 61.03 |
| CO: 1.44 × 10⁻² | CO: 64.04 | |||
| [C2(3)pic]+ | 10 | H2: 1.07 × 10⁻² | H2: 56.81 | 57.49 |
| CO: 8.10 × 10⁻³ | CO: 43.19 | |||
| [C2(4)pic]+ | 10 | H2: 4.74 × 10⁻³ | H2: 50.35 | 21.27 |
| CO: 4.68 × 10⁻³ | CO: 49.65 | |||
| [EMIM]+ | 50 | H2: 2.07 × 10⁻² | H2: 72.82 | 64.21 |
| CO: 7.73 × 10⁻³ | CO: 27.18 | |||
| [C2(3)pic]+ | 50 | H2: 5.39 × 10⁻³ | H2: 46.70 | 37.60 |
| CO: 6.15 × 10⁻³ | CO: 53.30 | |||
| [C2(4)pic]+ | 50 | H2: 6.88 × 10⁻³ | H2: 56.22 | 30.70 |
| CO: 5.36 × 10⁻³ | CO: 43.78 | |||
| [EMIM]+ | 90 | H2: 1.07 × 10⁻² | H2: 52.62 | 56.05 |
| CO: 9.62 × 10⁻³ | CO: 47.38 | |||
| [C2(3)pic]+ | 90 | H2: 8.78 × 10⁻³ | H2: 48.05 | 57.32 |
| CO: 9.50 × 10⁻³ | CO: 51.95 | |||
| [C2(4)pic]+ | 90 | H2: 8.86 × 10⁻³ | H2: 38.85 | 57.20 |
| CO: 1.39 × 10⁻² | CO: 61.15 |
From Table 1 it can be observed that a higher selectivity for CO production is achieved when the electrolytes with [EMIM]+ cation at 10 wt% of water and [C2(4)pic]+ cation at 90 wt% of water are used with values of NFE of 64% and 61%, respectively. The lower selectivity for CO production was obtained with the electrolyte composition of [EMIM]+ cation with 50 wt% of water.
Table 2 lists the production of gaseous products and faradaic efficiencies in electrolyses at 45 °C, 10 bar CO2 atmosphere, with zinc as cathode, 50 C charge passed and applied current density of ca. −7 mA cm−2. By inspection of Table 2 it can be verified that the selectivity for CO increases to 95% and CO production increases one order of magnitude for [EMIM][OTf] with 10 wt% of water at these higher applied current densities.
| Cation | [H2O] in the electrolyte (wt%) | Production (mmol cm−2) | NFE (%) | Total FE (%) |
|---|---|---|---|---|
| [EMIM]+ | 10 | H2: 1.5 × 10⁻² | H2: 5.13 | 105.77 |
| CO: 2.7 × 10⁻¹ | CO: 94.87 | |||
| [C2(3)pic]+ | 10 | H2: 1.0 × 10⁻¹ | H2: 73.88 | 51.89 |
| CO: 3.7 × 10⁻² | CO: 26.12 | |||
| [C2(4)pic]+ | 10 | H2: 1.1 × 10⁻¹ | H2: 91.32 | 35.56 |
| CO: 7.0 × 10⁻³ | CO: 8.68 | |||
| [EMIM]+ | 50 | H2: 1.2 × 10⁻¹ | H2: 45.05 | 109.58 |
| CO: 1.44 × 10⁻¹ | CO: 54.95 | |||
| [C2(3)pic]+ | 50 | H2: 5.6 × 10⁻² | H2: 34.19 | 60.56 |
| CO: 1.1 × 10⁻¹ | CO: 65.81 | |||
| [C2(4)pic]+ | 50 | H2: 7.8 × 10⁻² | H2: 73.02 | 47.99 |
| CO: 2.9 × 10⁻² | CO: 26.98 | |||
| [EMIM]+ | 90 | H2: 6.1 × 10⁻² | H2: 33.75 | 75.06 |
| CO: 1.2 × 10⁻¹ | CO: 66.25 | |||
| [C2(3)pic]+ | 90 | H2: 6.0 × 10⁻² | H2: 31.60 | 78.90 |
| CO: 1.3 × 10⁻¹ | CO: 68.40 | |||
| [C2(4)pic]+ | 90 | H2: 8.4 × 10⁻² | H2: 49.31 | 76.60 |
| CO: 8.6 × 10⁻² | CO: 50.69 |
The results obtained by CV and electrolysis allow to discuss a possible mechanism for electrochemical activation of CO2 by 1-ethyl-3-methyl imidazolium based on the mechanism proposed by Wang et al. for the ionic liquid 1-ethyl-3-methyl imidazolium tetrafluoroborate.28 This mechanism is depicted in Fig. 6.
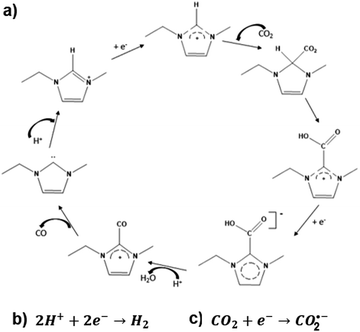 | ||
| Fig. 6 Mechanism for electrochemical activation of CO2 by 1-ethyl-3-methyl imidazolium based on the mechanism proposed by Wang et al.28 | ||
The proposed mechanism reflects the competition of IL, protons and CO2 for the catalytic sites at the surface of the cathode. When IL concentration is high, it leads to its significant adsorption on the surface of the cathode, ECR will proceed via pathway a) with formation of CO2–IL complex-based species. On the contrary, when protons occupy the catalytic sites in an appreciable extent, the hydrogen evolution reaction (HER) will be the favoured reaction (pathway b), instead of ECR. Pathway c) will be followed for CO2 molecules directly adsorbed on the cathode surface.
This mechanism also allows explaining the obtained total FE significantly below 100%. When the catalytic cycle stops at IL carboxylate formation,31 electric current used is not accounted for, as only CO and H2 are quantified by GC. This seems to happen particularly with the picoline based-electrolytes, which carboxylates are seemingly more stable than EMIM carboxylates, due to their aromatic configuration.
3.3. Electrochemical Impedance Spectroscopy characterization
The most widely used approach for interpretation of EIS data is equivalent circuit modelling, as the response of the cell can be described in terms of electric elements in order to represent the different physical and chemical processes occurring in CO2 electro-reduction. Furthermore, it is possible to deconvolute charge and mass transfer processes. As a reasonable approximation of the electrochemical cell, Randles circuits were used to represent the charge transfer reactions at the metal/electrolyte interface and diffusion processes. Fig. 7 represents the equivalent circuit model that was selected to represent the processes under study. It consists of a resistance in series with two Randles circuits also in series to account for the proposed mechanism.
Results are represented by Nyquist plots, in which three different regions are analysed and electric circuit elements assigned to cell processes: high frequency (electrolyte resistance, modelled by resistor R0), medium frequency (charge transfer resistance and double layer effects, modelled by the RC circuit, the capacitor C is generalized as constant phase element CPE, and low frequency (diffusion processes modelled by Warburg elements, W).
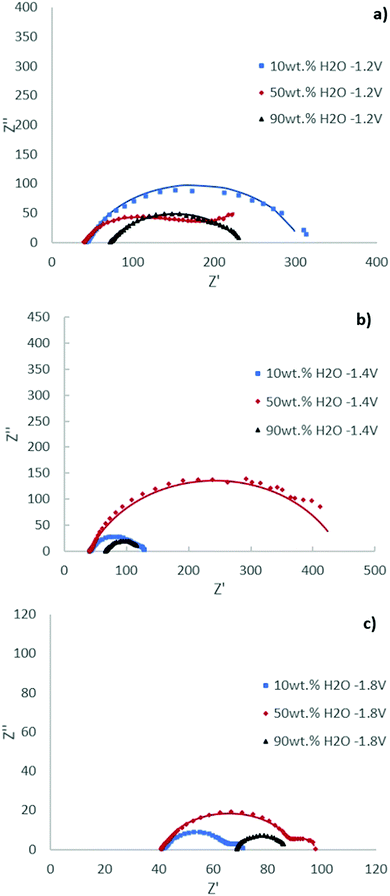
The Nyquist plots of the [EMIM][OTf] electrolytes with different water compositions at applied potentials of −1.2 V, −1.4 V and −1.8 V vs. Ag/Ag+ (QRE) exhibit depressed semi-circles depicted in Fig. 8. The impedance parameters obtained after the fitting of the experimental results by using the equivalent circuit displayed in Fig. 7 are presented in Tables 3, 4 and 5 with respective chi-squared values. The results suggest the existence of two time constants. The model shows, in general, a good agreement with experimental results. As the water concentration increases diffusional components are more evident in the spectra, with the results for 90 wt% water fully fitted by the equivalent circuit of Fig. 7 with two Warburg elements Ws.
| Ionic liquid | [EMIM][OTf] 10 wt% H2O | [EMIM][OTf] 50 wt% H2O | [EMIM][OTf] 90 wt% H2O |
|---|---|---|---|
| Chi-squared | 2.63 × 10⁻³ | 3.36 × 10⁻⁴ | 3.12 × 10⁻⁴ |
| R 0/Ω | 41.62 | 39.62 | 71.27 |
| Q 1/Ω−1 sn cm−2 | 1.71 × 10⁻⁴ | 3.23 × 10⁻⁴ | 2.97 × 10⁻⁴ |
| n 1 | 0.71 | 0.89 | 0.63 |
| R 1/Ω | 3.59 | 54.41 | 10 |
| Ws1–R | — | — | 106.7 |
| Ws1–T | — | — | 0.0034 |
| Ws1–P | — | — | 0.5 |
| Q 2/Ω−1 sn cm−2 | 1.59 × 10⁻⁴ | 2.39 × 10⁻³ | 1.86 × 10⁻⁴ |
| n 2 | 0.81 | 0.56 | 1.14 |
| R 2/Ω | 260.7 | 124.3 | 20 |
| Ws2–R | — | 120 | 25.13 |
| Ws2–T | — | 15.19 | 0.214 |
| Ws2–P | — | 0.56 | 0.5 |
| Ionic liquid | [EMIM][OTf] 10 wt% H2O | [EMIM][OTf] 50 wt% H2O | [EMIM][OTf] 90 wt% H2O |
|---|---|---|---|
| Chi-squared | 2.60 × 10⁻³ | 6.01 × 10⁻³ | 3.48 × 10⁻⁴ |
| R 0/Ω | 41.36 | 40.55 | 66.29 |
| Q 1/Ω−1 sn cm−2 | 8.58 × 10⁻⁴ | 2.46 × 10⁻⁴ | 2.31 × 10⁻⁴ |
| n 1 | 0.62 | 0.99 | 0.98 |
| R 1/Ω | 60.17 | 105 | 16.06 |
| Q 2/Ω−1 sn cm−2 | 1.46 × 10⁻⁴ | 8.94 × 10⁻⁴ | 6.88 × 10⁻⁴ |
| n 2 | 1 | 0.65 | 0.62 |
| R 2/Ω | 29.06 | 358.3 | 42.45 |
| Ws2–R | — | — | 7.801 |
| Ws2–T | — | — | 0.141 |
| Ws2–P | — | — | 0.651 |
| Ionic liquid | [EMIM][OTf] 10 wt% H2O | [EMIM][OTf] 50 wt% H2O | [EMIM][OTf] 90 wt% H2O |
|---|---|---|---|
| Chi-squared | 6.63 × 10⁻⁴ | 7.84 × 10⁻⁴ | 1.44 × 10⁻⁴ |
| R 0/Ω | 41.7 | 41.19 | 68.38 |
| Q 1/Ω−1 sn cm−2 | 1.49 × 10⁻⁴ | 2.04 × 10⁻⁴ | 2.25 × 10⁻⁴ |
| n 1 | 0.79 | 0.83 | 0.79 |
| R 1/Ω | 24.3 | 48.51 | 18.85 |
| Q 2/Ω−1 sn cm−2 | 1.55 × 10⁻² | 4.55 × 10⁻² | — |
| n 2 | 0.96 | 0.98 | — |
| R 2/Ω | 4.73 | 8.315 | — |
At −1.2 V vs. Ag/Ag+ (QRE) the results for the electrolyte with 10 wt% H2O are simplified to two RC (CPE) circuits in series without Warburg elements.
Considering the mechanism depicted in Fig. 6 the first time constant process is assigned to the reduction of the [EMIM]+ cation, previously adsorbed on the surface forming a film.32
The competition of water molecules for the catalytic sites interferes with the formation of the adsorbed IL film, this is notable when the concentration of water increases from 10 wt% to 50 wt%, leading to an increase of R1 and a diffusion limitation (Ws).
The behaviour of the 90 wt% water electrolyte is expectedly mainly determined by the significant lower quantities of dissolved CO2 and consequently CO2 diffusion plays an important role modelled by two Warburg elements, which might change the mechanism pathway. With the increase in water concentration to 90 wt% the resistance of the electrolyte (R0) is notably increased, as expected.
The second electronic transfer can most probably be assigned to the step of the ECR process corresponding to the formation of the bulky complex CO2–IL radical anion subject to diffusional limitations.
The Nyquist plots at −1.4 V and −1.8 V vs. Ag/Ag+ (QRE) exhibit significant changes. The two semicircles become more resolved. For the 90 wt% water composition the system is best described by one Randles circuit, indicating the absence of an IL film. The coefficient of the constant phase element n1 for all water compositions studied showed a deviation from the real capacitance. This can most probably be explained considering that the ionic liquid reduced/adsorbed on the cathode induces dispersive behaviour.
In general, an increase in the resistance is observed for 50 wt% water composition (R1 and R2) which will promote the competition of the HER explaining the elevated selectivity for hydrogen production observed in electrolyses (pathway b).
In order to further examine the transition from electrolytes with high IL contents to high water contents, the 50 wt% water electrolytes were investigated by EIS.
Fig. 9 shows the Nyquist plots obtained for the different ILs for a composition of 50 wt% of water for an applied potential of −1.2 V vs. Ag/Ag+ (QRE) and Fig. 10 shows the Nyquist plots obtained for the different IL for a 50 wt% of water for an applied potential of −1.4 V vs. Ag/Ag+ (QRE). The fitting parameters are given in Tables 6 and 7. At −1.2 V vs. Ag/Ag+ (QRE) all fitted resistances for [C2(4)pic]+ are very high reflecting the high resistance of the electrolyte R0 in agreement with the low CO productivities obtained in the electrolyses. The models show in general a good agreement with experimental results. The error is higher for the [C2(3)pic]+-based electrolytes and for data obtained at −1.4 V vs. Ag/Ag+ (QRE) that presents a higher value of chi-squared. This is due to the instability of the low frequency data points that renders the comparison of fitted values difficult. Two times constants can be observed for all the electrolytes.
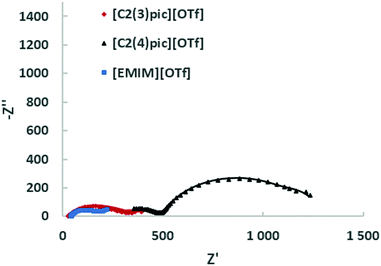 | ||
| Fig. 9 EIS on the Zn cathodes in a solution of 50 wt% water an ionic liquid at 10 bar CO2 with an applied potential of −1.2 V vs. Ag/Ag+ (QRE); the continuous line corresponds to the fitting. | ||
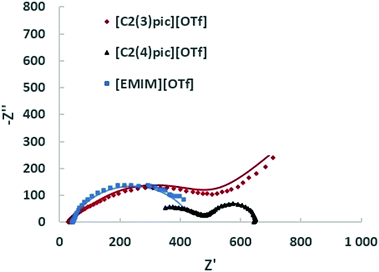 | ||
| Fig. 10 EIS on the Zn cathodes in a solution of 50 wt% water an ionic liquid at 10 bar CO2 with an applied potential of −1.4 V vs. Ag/Ag+ (QRE); the continuous line corresponds to the fitting. | ||
| Ionic liquid | [EMIM]+ | [C2(3)pic]+ | [C2(4)pic]+ |
|---|---|---|---|
| Chi-squared | 3.36 × 10⁻⁴ | 8.18 × 10⁻³ | 1.96 × 10⁻⁴ |
| R 0/Ω | 39.62 | 29.04 | 240.40 |
| Q 1/Ω−1 sn cm−2 | 3.23 × 10⁻⁴ | 1.28 × 10⁻⁴ | 4.63 × 10⁻⁶ |
| n 1 | 0.89 | 0.68 | 0.51 |
| R 1/Ω | 54.41 | 264.9 | 257.60 |
| Q 2/Ω−1 sn cm−2 | 2.39 × 10⁻³ | 6.04 × 10⁻³ | 1.54 × 10⁻⁴ |
| n 2 | 0.56 | 0.80 | 0.78 |
| R 2/Ω | 124.3 | 88.23 | 765 |
| Ws2–R | 120 | — | — |
| Ws2–T | 15.19 | — | — |
| Ws2–P | 0.56 | — | — |
| Ionic liquid | [EMIM]+ | [C2(3)pic]+ | [C2(4)pic]+ |
|---|---|---|---|
| Chi-squared | 6.01 × 10⁻³ | 2.22 × 10⁻³ | 1.06 × 10⁻⁴ |
| R 0/Ω | 40.55 | 29.41 | 225.2 |
| Q 1/Ω−1 sn cm−2 | 2.46 × 10⁻⁴ | 1.74 × 10⁻⁵ | 5.53 × 10⁻⁶ |
| n 1 | 0.99 | 0.78 | 0.49 |
| R 1/Ω | 105 | 46 | 275 |
| Q 2/Ω−1 sn cm−2 | 8.94 × 10⁻⁴ | 6.35 × 10⁻⁵ | 6.36 × 10⁻⁵ |
| n 2 | 0.65 | 0.67 | 0.87 |
| R 2/Ω | 358.3 | 445.1 | 155.2 |
In Table 8 the conductivity of different electrolytes calculated from EIS data at different applied potentials is presented. Conductivity was calculated according to eqn (6),
 | (6) |
| Ionic liquid | Potential (V) | Water (%) | σ (mS cm−1) |
|---|---|---|---|
| [EMIM][OTf] | −1.2 | 10 | 27.68 |
| 50 | 29.12 | ||
| 90 | 16.00 | ||
| −1.4 | 10 | 27.79 | |
| 50 | 28.45 | ||
| 90 | 17.39 | ||
| [C2(3)pic][OTf] | −1.2 | 50 | 39.54 |
| −1.4 | 39.03 | ||
| [C2(4)pic][OTf] | −1.2 | 50 | 4.81 |
| −1.4 | 5.23 |
Within experimental errors, conductivities are independent of applied potential as they should be. The conductivity of the [EMIM][OTf] electrolyte with 90 wt% of water is the lowest, due to the significant decrease in the concentration of ionic charge transporters. Among the electrolytes with 50 wt% water composition [C2(3)pic][OTf] shows the highest conductivity, while [C2(4)pic][OTf] shows a conductivity one order of magnitude lower. The conductivity of [EMIM][OTf] at 25 °C and atmospheric pressure is 2.9 mS cm−1,33 water addition as expected is thus effective for increasing conductivity. Although the results clearly show a trade-off between higher viscosity with lower ion mobility and higher water concentrations that leads to lower ion concentration and thus, a lower number of charge transporters.34
In the cases, where EIS provided the necessary data, diffusion coefficients were also calculated according to eqn (7),
 | (7) |
The diffusion coefficient of CO2 in [EMIM][OTf] determined at 25 °C and atmospheric pressure was 1 × 10⁻¹⁰ m2s−1![[thin space (1/6-em)]](https://www.rsc.org/images/entities/char_2009.gif) 35 and in water at 25 °C at infinite dilution is 1.92 × 10⁻⁹ m2s−1.36 The diffusion coefficients of the lower frequency semi-circle determined in the present work indicated in Table 9 are several orders of magnitude lower than these values. Most probably, the calculated diffusion coefficient for the high frequency semi-circle corresponds to the diffusion of CO2 in the IL, while the diffusion coefficient calculated for the lower frequency semicircle corresponds to the diffusion of the bulkier IL complex.
35 and in water at 25 °C at infinite dilution is 1.92 × 10⁻⁹ m2s−1.36 The diffusion coefficients of the lower frequency semi-circle determined in the present work indicated in Table 9 are several orders of magnitude lower than these values. Most probably, the calculated diffusion coefficient for the high frequency semi-circle corresponds to the diffusion of CO2 in the IL, while the diffusion coefficient calculated for the lower frequency semicircle corresponds to the diffusion of the bulkier IL complex.
| Ionic liquid | Potential (V) | Water (%) | D 1 (cm2 s−1) | D 2 (cm2 s−1) |
|---|---|---|---|---|
| [EMIM][OTf] | −1.2 | 50 | — | 2.09 × 10⁻¹⁵ |
| 90 | 5.72 × 10⁻¹¹ | 1.07 × 10⁻¹² | ||
| −1.4 | 90 | — | 8.75 × 10⁻¹³ | |
| [C2(3)pic][OTf] | −1.4 | 50 | — | 1.54 × 10⁻¹⁵ |
Conclusions
This work illustrates how differences in structure of ionic liquids have a profound influence in their behaviour as electrolytes. For instance, changing only the position of the methyl group in the picolinium cation turns [C2(4)pic]+ into a solid at room temperature, while [C2(3)pic]+ is a liquid at this temperature. This has significant consequences on the conductivity of the electrolytes and hence on their performance. The present work shows that the [EMIM]+ and [C2(4)pic]+ cations behave as co-catalysts with Zn electrodes due to the formation of the corresponding radicals. The degree of reversibility depends on the cation structure and nature of the electrode. [C2(3)pic]+ seems to be effective by modifying the electrochemical double layer. These facts are in accordance with the results of Zhao et al.9 Based on productivity and electrochemical data, the behaviour of [EMIM]+ -based electrolytes with different water contents seems to be determined mainly by the variation of CO2 solubility and conductivity. With the current available data, for the studied picolinium-based electrolytes, at low current densities, there is no obvious influence of conductivity, while the reversibility of the reaction and conductivity at higher currents seem to play a more determinant role. The investigated picolinium-based electrolytes yield low CO productivities at low water contents. However, their performance is significantly increased by the addition of water. Further screening studies are necessary to find an IL-based electrolyte with a high content of water that can achieve a CO production preferably higher than [EMIM][OTf] with 10 wt% of water.Author contributions
Conceptualization: A. S. R. M., L. C. B.; formal analysis: S. M.; investigation: S. M., V. P.; methodology: A. S. R. M.; HC, Impedance experimental support; supervision: A. S. R. M., L. C. B.; interpretation and discussion of results – C. M. R., A. S. R. M., L. C. B., S. M., writing – original draft: S. M., A. S. R. M.; writing – review and editing: C. M. R., A. S. R. M., L. C. B., S. M., V. P.Conflicts of interest
There are no conflicts of interest.Acknowledgements
This work was performed under the project “SunStorage – Harvesting and storage of solar energy”, with reference POCI-01-0145-FEDER-016387 and PORLisboa POCI-01-0145-FEDER-016387, funded by European Regional Development Fund (ERDF), through COMPETE 2020 – Operational Programme for Competitiveness and Internationalisation (OPCI), and by national funds, through FCT – Fundação para a Ciência e a Tecnologia I.P. The authors also acknowledge Fundação para a Ciência e a Tecnologia for funding the Project CO2RED under the reference PTDC/EQU-EPQ/2195/2021 and project INIESC National Research Infrastructure in Solar Energy Concentration, FCT_22113 (AAC 01/SAICT/2016), Portugal.Notes and references
- D. Faggion Jr., W. D. G. Gonçalves and J. Dupont, Front. Chem., 2019, 7, 102, DOI:10.3389/fchem.2019.00102.
- L. A. Blanchard, Z. Y. Gu and J. F. Brennecke, J. Phys. Chem. B, 2001, 105, 2437–2444, DOI:10.1021/jp003309d.
- C. Cadena, J. L. Anthony, J. K. Shah, T. I. Morrow, J. F. Brennecke and E. J. Maginn, J. Am. Chem. Soc., 2004, 126, 5300–5308, DOI:10.1021/ja039615x.
- H. Matsumoto, Electrochemical windows of room temperature ionic liquids, in Electrochemical Aspects of Ionic Liquids, ed. H. Ohno, J. Wiley & Sons, Inc., 2005, ch. 4, p. 35 DOI:10.1002/0471762512.
- S. Aparicio, M. Atilhan and F. Karadas, Ind. Eng. Chem. Res., 2010, 49(20), 9580–9595, DOI:10.1021/ie101441s.
- J. L. Anthony, E. J. Maginn and J. F. Brennecke, J. Phys. Chem. B, 2001, 105(44), 10942–10949, DOI:10.1021/jp0112368.
- B. A. Rosen, A. Salehi-Khojin, M. R. Thorson, W. Zhu, D. T. Whipple, P. J. A. Kenis and R. I. Masel, Science, 2011, 334, 643–644, DOI:10.1126/science.1209786.
- D. Niu, H. Wang, H. Li, Z. Wu and X. Zhang, Electrochim. Acta, 2015, 158, 138–142, DOI:10.1016/j.electacta.2015.01.096.
- S.-F. Zhao, M. Horne, A. M. Bond and J. Zhang, J. Phys. Chem. C, 2016, 120(42), 23989–24001, DOI:10.1021/acs.jpcc.6b08182.
- A. S. Reis-Machado and M. Nunes da Ponte, Curr. Opin Green Sustainable Chem., 2018, 11, 86–90, DOI:10.1016/j.cogsc.2018.05.009.
- S. Messias, M. M. Sousa, M. Nunes da Ponte, C. M. Rangel, T. Pardal and A. S. Reis-Machado, React. Chem. Eng., 2019, 4, 1982–1990, 10.1039/C9RE00271E.
- D. J. A. Lange's, Handbook of Chemistry, McGraw-Hill, New York, 15th edn, 1999, p. 165 Search PubMed.
- D. R. Lide, CRC Handbook, CRC Press, BocaRaton, Florida, 84th edn, 2003 Search PubMed.
- T. Pardal, S. Messias, M. Sousa, A. S. Reis-Machado, C. M. Rangel, D. Nunes, R. Martins and M. Nunes da Ponte, J. CO2 Util., 2017, 18, 62–72, DOI:10.1016/j.jcou.2017.01.007.
- W. Luo, J. Zhang, M. Li and A. Züttel, ACS Catal., 2019, 9(5), 3783–3791, DOI:10.1021/acscatal.8b05109.
- M. Alvarez-Guerra, J. Albo, E. Alvarez-Guerra and A. Irabien, Energy Environ. Sci., 2015, 8, 2574–2599, 10.1039/C5EE01486G.
- H.-K. Lim and H. Kim, Molecules, 2017, 22, 536, DOI:10.3390/molecules22040536.
- J. Feng, S. Zeng, J. Feng, H. Dong and X. Zhang, Chin. J. Chem., 2018, 36, 961–970, DOI:10.1002/cjoc.201800252.
- P. P. Sharma and X.-D. Zhou, Wiley Interdiscip. Rev.: Energy Environ., 2017, 6, e239, DOI:10.1002/wene.239.
- E. E. L. Tanner, C. Batchelor-McAuley and R. G. Compton, J. Phys. Chem. C, 2016, 120, 26442–26447, DOI:10.1021/acs.jpcc.6b10564.
- L. M. Welch, M. Vijayaraghavan, F. Greenwell, J. Satherly and A. J. Cowan, Faraday Discuss., 2021, 230, 331–343, 10.1039/D0FD00140F.
- S. S. Neubauer, R. K. Krause, B. Schmid, D. M. Guldi and G. Schmid, Adv. Energy Mater., 2016, 6, 1502231, DOI:10.1002/aenm.201502231.
- M. König, J. Vaes, E. Klemm and D. Pant, iScience, 2019, 19, 135–160, DOI:10.1016/j.isci.2019.07.014.
- T. Pardal, S. Messias, M. Sousa, A. S. Reis-Machado, C. M. Rangel, D. Nunes, R. Martins and M. Nunes da Ponte, J. CO2 Util., 2017, 18, 62–72 CrossRef CAS Suplementary Information.
- F. Endres, D. MacFarlane and A. Abbott, Electrodeposition from Ionic Liquids, Wiley-VCH, 2008. DOI:10.1002/9783527622917.
- B. Gorodetsky, T. Ramnial, N. R. Branda and J. A. C. Clyburne, Chem. Commun., 2004, 1972–1973, 10.1039/B407386J.
- F. A. Hanc-Scherer, M. A. Montiel, V. Montiel, E. Herrero and C. M. Sánchez-Sánchez, Phys. Chem. Chem. Phys., 2015, 17, 23909–23916, 10.1039/C5CP02361K.
- Y. Wang, T. Hayashi, D. He, Y. Li, F. Jin and R. Nakamura, Appl. Catal., B, 2020, 264, 118495, DOI:10.1016/j.apcatb.2019.118495.
- M. E. Zakrzewska and M. Nunes da Ponte, J. Chem. Eng. Data, 2018, 63(4), 907–912, DOI:10.1021/acs.jced.7b00521.
- Y. Matsubara, D. C. Grills and Y. Kuwahara, ACS Catal., 2015, 5(11), 6440–6452, DOI:10.1021/accscatal.5b00656.
- L. Sun, G. K. Ramesha, P. V. Kamat and J. F. Brennecke, Langmuir, 2014, 30, 6302–6308, DOI:10.1021/la5009076.
- D.-w. Yang, Q.-y. Li, F.-x. Shen, Q. Wang, L. Li, N. Song, Y.-n. Dai and J. Shi, Electrochim. Acta, 2016, 189, 32–37, DOI:10.1016/j.electacta.2015.12.025.
- P. Hapiot and C. Lagrost, Chem. Rev., 2008, 108, 2238–2264, DOI:10.1021/cr0680686.
- Z. Liu, R. I. Masel, Q. Chen, R. Kutz, H. Yang, K. Lewinski, M. Kaplun, S. Luopa and D. L. Lutz, J. CO2 Util., 2016, 15, 50–56, DOI:10.1016/j.jcou.2016.04.011.
- I. Reche, I. Gallardo and G. Guirado, RSC Adv., 2014, 4, 65176–65183, 10.1039/C4RA11297K.
- E. L. Cussler, In: Mass Transfer in Fluid Systems, Cambridge University Press, 3rd edn, 2009 Search PubMed.
Footnote |
| † Electronic supplementary information (ESI) available. See DOI: 10.1039/d2ya00001f |
| This journal is © The Royal Society of Chemistry 2022 |

