Effect of nanostructuring on the interaction of CO2 with molybdenum carbide nanoparticles†
Carlos
Jimenez-Orozco
 *a,
Marc
Figueras
b,
Elizabeth
Flórez
a,
Francesc
Viñes
 *b,
José A.
Rodriguez
 c and
Francesc
Illas
 b
b
aUniversidad de Medellín, Facultad de Ciencias Básicas, Grupo de Materiales con Impacto (Mat&mpac), Carrera 87 No 30-65, Medellín, Colombia. E-mail: cjimenez@udemedellin.edu.co
bUniversitat de Barcelona, Departament de Ciència de Materials i Química Física & Institut de Química Teòrica i Computacional (IQTCUB), c/Martí i Franquès 1-11, 08028 Barcelona, Spain. E-mail: francesc.vines@ub.edu
cBrookhaven National Laboratory, Chemistry Division, Upton, New York 11973, USA
First published on 18th June 2022
Abstract
Transition metal carbides are increasingly used as catalysts for the transformation of CO2 into useful chemicals. Recently, the effect of nanostructuring of such carbides has started to gain relevance in tailoring their catalytic capabilities. Catalytic materials based on molybdenum carbide nanoparticles (MoCy) have shown a remarkable ability to bind CO2 at room temperature and to hydrogenate it into oxygenates or light alkanes. However, the involved chemistry is largely unknown. In the present work, a systematic computational study is presented aiming to elucidate the chemistry behind the bonding of CO2 with a representative set of MoCy nanoparticles of increasing size, including stoichiometric and non-stoichiometric cases. The obtained results provide clear trends to tune the catalytic activity of these systems and to move towards more efficient CO2 transformation processes.
1. Introduction
Carbon dioxide (CO2) valorization represents a real possibility to fight global warming while supplying chemical commodities that are essential to the chemical industry, thus contributing to the wealth of modern societies.1 One of the most appealing ways to valorize this greenhouse gas component is through hydrogenation, mainly targeting the production of carbon monoxide, methanol, and methane.2 Yet, the great stability of CO2 and the endothermic character of the involved reactions make this process difficult, requiring high temperatures and the effective use of a catalyst.3,4 Transition metals, most often in the form of nanoparticles supported on porous oxides, are broadly used as catalysts for industrial hydrogenation reactions to produce bulk chemicals such as ammonia5 and methanol.6 These metals exhibit a high activity, although the most abundant ones such as Fe, Ni, or Cu may exhibit unsatisfactory selectivity. In principle, this can be tuned by an appropriate combination of the metal and the support, as precisely shown in the case of catalysts for CO2 hydrogenation.3,7 On the other hand, late transition metals tend to be more selective in the transformation of CO2 into oxygenates. However, the scarcity of these elements, their concomitant high commercial cost, and the declining of available mineral deposits, represent a limitation for its use in the chemical industry thus calling for suited alternatives.Inspired by the seminal work of Levy and Boudart,8 reporting that transition metal carbides (TMCs) exhibit catalytic capabilities for hydrogenation reaction similar to that of expensive and scarce late transition metals, several investigations were launched to explore this feature in more detail.9,10 Interestingly, it was found that small Cu, Au, and Ni particles supported on TiC(001) surface exhibit a catalytic activity for CO2 hydrogenation to methanol, which largely overcomes that of laboratory models of the conventional Cu/ZnO catalyst.11 Likewise, theoretical calculations and experiments showed that MoC and Mo2C are able to activate CO2 and even to hydrogenate it,12,13 evidencing the important role of Mo/C ratio in determining the selectivity.14 However, an intrinsic limitation of these materials is the low surface area exhibited which limits the effective conversion. Very recently, it has been shown that this pitfall can be overcome by making use of MoCy nanoparticles, which, depending on the system size and Mo/C atomic ratio, can transform CO2 into oxygenates and light alkanes.15,16 Experiments carried out for C-rich MoC1.1 nanoparticles supported on Au(111) indicated that these new systems are able to dissociate and store significant amounts of hydrogen17 and to catalyze the CO2 hydrogenation.15 Exposing these hydrogenated nanoparticles to CO2 led to CO with a significant amount of methanol but without producing methane or other alkanes.16 Interestingly, these MoC1.1/Au(111) systems are also able to dissociate methane at room temperature.18 The experiments also evidenced the major role played by the Mo/C atomic ratio, since the C-deficient nanoparticles were very active towards CO2 but had problems of stability and selectivity, whereas the nearly stoichiometric ones were active, selective and stable.16 Density functional theory (DFT) based calculations carried out for a Mo12C12 nanoparticle supported on Au(111) provided the essential features of the underlying molecular mechanism, evidencing that the role of the Au(111) support was not relevant, opening the door to study the interaction of CO2 with these nanoparticles in a more systematic way by considering different sizes and stoichiometries. This is indeed the main goal of the present work. Due to the remarkable performance seen in previous catalytic studies,15,16 there is a clear need to identify key aspects in the intrinsic interaction of MoCy nanoparticles with CO2.
2. Nanoparticle models and computation details
The interaction of CO2 with a total of 14 types of nanoparticles with MoCy general formula was studied; these encompass three regimes, namely small clusters containing up to 12 atoms, intermediate clusters with up to 22 atoms, and larger nanoparticles with a maximum of 64 atoms. The set of small nanoparticles (Sset) includes Mo4C6, Mo5C6, Mo6C4, Mo6C5, and Mo6C6; those of intermediate size (Iset) are Mo8C12, Mo10C12, Mo12C6, Mo12C8, and Mo12C10; the first one in the series is a member of the metallocarbohedrene family also known as metcar,19 whereas the rest are generated from the Mo12C12 nanoparticle, which is the first member of the set involving large nanoparticles (Lset), including also the Mo14C13 nanocube, plus the Mo24C24 and Mo32C32 stoichiometric particles. Previous results for the extended δ-MoC(001), β-Mo2C(100)-C, and β-Mo2C(100)-Mo surfaces12,20 are considered as limiting cases. The above-described nanoparticles were used in a previous study concerning their interaction with ethylene.21 However, the present work considers new structures, especially for the Sset, because these cluster-like systems are likely to exhibit different structural isomers, although not reaching the diversity found in transition metal clusters.22,23 Hence, a systematic search of isomers in the respective potential energy surface (PES), computed as indicated below, was carried out by means of simulated annealing using the ASCEC program.24 This is a stochastic procedure, generating cluster structures that are candidates for a global minimum in random search using a modified Metropolis acceptance test in the simulated annealing procedure.25,26 The generated structures were later optimized with traditional gradient techniques as indicated below. The results of the current work using the ASCEC program24–26 complement those previously obtained using the cascade procedure.21The total energy of the different nanoparticles was obtained from DFT based calculations carried out using the Vienna ab initio simulation package (VASP) code.27 Since VASP is intrinsically a code exploiting periodic symmetry, supercells with an appropriate size were used to ensure a negligible interaction between periodic replicas, as in our previous work.21 Briefly, the different nanoparticles were located inside a large cubic box, ensuring a minimum vacuum region of 10 Å in all directions. Test calculations have been performed ensuring convergence of the CO2 adsorption energy with respect to the extent of the vacuum region, see Table S1 of the ESI.† Accordingly, calculations were carried out considering the Γ point only. The Perdew–Burke–Ernzerhof (PBE) exchange-correlation functional28 was chosen to compute the total energy, shown to be adequate to describe Mo-based carbides.29 The effect of dispersion was also considered adding the Grimme D3 approach (PBE-D3),30 which has been reported as necessary for the interaction of molecules with molybdenum carbide-based systems.31 The valence electron density was expanded in a set of plane-waves with a kinetic energy below 415 eV and the effect of the inner core electrons in the valence electron density was described by projected augmented wave (PAW) method.32,33 The convergence criteria in solving the Kohn–Sham equations was set to 10−5 eV. The structural optimization of the different nanoparticles was carried out using a gradient conjugate algorithm, considered converged when forces acting on the atoms were below 0.01 eV Å−1. Spin-polarized calculations were considered in all the cases. The structures of the most stable isomers are shown in Fig. 1 and 2, with details discussed in the next section.
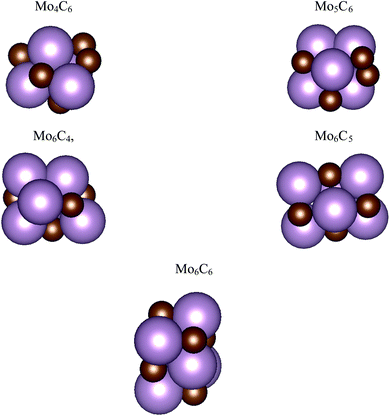 | ||
| Fig. 1 Atomic structures for the most stable isomers of the MoCy nanoparticles in the SSet. Magenta and brown spheres denote Mo and C atoms, respectively. | ||
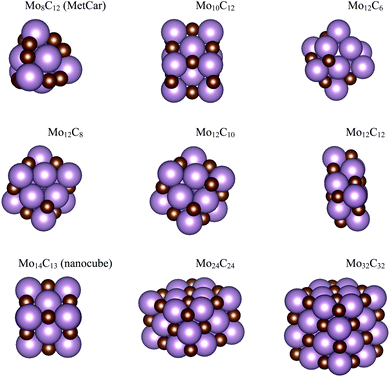 | ||
| Fig. 2 Atomic structures for the MoCy nanoparticles in the ISet and LSet. Colour coding as in Fig. 1. | ||
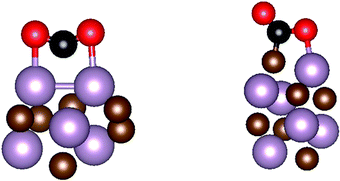
After establishing the appropriate structure of all the considered nanoparticles, the interaction of CO2 with each nanoparticle was studied in detail, using the same computational setup mentioned above. A sufficiently large set of possible binding modes have been explicitly considered, exploring circa 1100 possibilities. The final structures for CO2 adsorbed on every nanoparticle were characterized by vibrational analysis through Hessian matrix construction and diagonalization. The Hessian matrix elements were obtained by finite differences of analytical gradients with displacements of 0.03 Å. In all reported minimum energy structures, the diagonalization of the Hessian matrix provided positive eigenvalues only. The vibrational frequencies were obtained within the framework of the harmonic approximation, and accounting only the adsorbate vibrational frequencies; i.e. assuming decoupling of CO2 vibrational frequencies from substrate nanoparticle phonons. The notation for sites involved in CO2 binding is the same used by Morales-García et al.34 and is as follows: for the η3-CO2–μ2-CBOMOM example implies the interaction of the three atoms of CO2 (η3) with two atoms of the nanoparticle (μ2) in such a way that the C atom of CO2 is bridging two nanoparticle atoms (CB)—where the bridge could be either Mo–Mo, or Mo–C—, and each O is located atop of two nanoparticle atoms, here two metal atoms (OM). This is different, e.g., from η2-CO2–μ2-CCOM which implies a similar situation, but with only one CO2 O atom interacting with a nanoparticle metal atom, and so, the other one pointing towards the vacuum, see Fig. 3. The CO2 adsorption energy, Eads, was calculated as:
| Eads = ECO2/NP − ENP − ECO2 + ΔZPE, | (1) |
| Eform = ((N·EMobulk + N·ECgraphite) − EMoNCoN)/N, | (2) |
To study the interaction of CO2 with the clusters in the Sset, where several low-lying energy isomers exist, we choose those up to the isomer previously gained by the cascade procedure,21 but also those lying up to 0.1 eV higher in energy, regarded hereafter as possibly degenerate. This implies selecting five isomers for Mo4C6 and Mo6C4, four and two for Mo5C6 and Mo6C5, respectively, and just the most stable one for Mo6C6, see Table S2 ESI.† For the nanoparticles in the Iset and Lset, only the most stable isomer was considered. Overall, CO2 adsorption was analyzed on 26 nanoparticles considering around 1100 initial different geometric configurations, which after optimization end up in 538 topologically different adsorption structures for CO2, see Table S3 of the ESI.† The number of possibilities for binding CO2 is obviously higher on the nanoparticles than on the extended surfaces, simply because the former exhibit a much larger variety of topologically different adsorption sites. Moreover, the rather large number of low energy isomers in Sset implies that 209 structures (obtained from 541 initial systems) for adsorbed CO2, or around 39% of the total, involves this set of nanoparticles. Moreover, the variety of isomers in Sset makes it difficult to rationalize the results. This is not surprising as in this sub-nanometer regime every atom counts.36 Nonetheless, the complete list of energy results for the most stable CO2 adsorption structure in the selected low energy isomers can be found in Table S4 of the ESI.†
The CO2 dissociation barrier (CO2* → CO* + O*) was evaluated for some representative cases covering all Mo/C ratios. The respective transition state structures were found following a two-step procedure, where the first one relates to a non-linear interpolation of a set of eight images by using the atomistic simulation environment (ASE) package.37 Then, the obtained images we used to search the saddle points for CO2 dissociation by using the climbing-imaged nudged elastic band (CI-NEB) method.38 The transition states were then characterized via frequency analysis, ensuring a single imaginary frequency in the desired reaction direction.
3. Results and discussion
To facilitate the oncoming discussion and because of the particularities of each set of nanoparticles, the results will be first described for the structures of bare isomers in different MoCy nanoparticles and, in a different subsection, we will report and discuss the results corresponding to the interaction of CO2 with the stoichiometric and non-stoichiometric nanoparticles.3.1 Energy landscape of bare MoCy nanoparticles
The search of several isomers for the nanoparticles in the Sset was addressed in detail by exploring the potential energy surface exhaustively using the ASCEC package. We also compare the results arising from ASCEC with those reported in a previous work obtained by following a cascade procedure.21 The most stable structure of every isomer in Sset can be found in Fig. 1 and the complete set of results is reported in Table S2 of the ESI.† Our calculations showed that the depicted structures for Mo4C6 and Mo6C6 were quite stable. On the other hand, for the other nanoparticles in the Sset, there were several isomers or configurations within a 0.5 eV energy range.For the Mo5C6 case, the third most stable isomer according to the cascade procedure is only 0.07 eV less stable than the putative global minimum, see values in Table S2 of the ESI,† thus pointing out the rather good, albeit not perfect, performance of the cascade procedure. In fact, for Mo6C5, the isomer found using the cascade procedure is 0.26 eV less stable than the putative global minimum predicted by the simulated annealing. For Mo6C4, the predicted global minimum is 0.54 eV more stable than that obtained via the cascade procedure, appearing third in the list, see Table S2 in the ESI.† In the case of Mo4C6 fifteen different isomers were found, with most stable structure lying 1.50 eV below the one predicted as most stable by cascade procedure. Therefore, one can conclude that the cascade approach becomes questionable when increasing the number of atom removals although may be useful to investigate nearly stoichiometric nanoparticles. Indeed, for Mo6C6 the most stable isomer was obtained regardless of the employed optimization procedure, which is expected because of the high stability of this nanoparticle and is in line with the conclusions extracted for the nearly stoichiometric Mo5C6 nanoparticle. This indicates that the data mining and cascade strategies constitute useful approaches to obtain low-energy structures for larger systems, especially for the nearly stoichiometric ones, where simulated annealing becomes computationally unaffordable. Consequently, no further annealing search was conducted for the nanoparticles in Iset and Lset, and their atomic structure is the same as in our previous work;21 for convenience, these are included in Fig. 2.
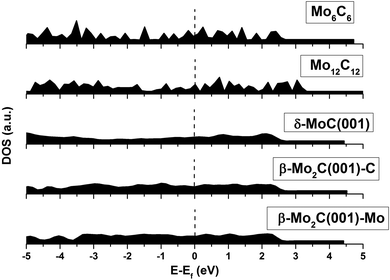
An analysis of the structures depicted in Fig. 1 and 2 indicates that the MoCy nanoparticles have compact structures, which are rich in Mo and C atoms with a low coordination number. This is important because previous theoretical studies have shown that CO2 can bind to Mo and C atoms on surfaces of bulk molybdenum carbides.12,14 The analysis of the electronic properties of the MoCy nanoparticles by means of density of states (DOS) plots, see Fig. 4, reveals that, compared to the cases of the extended δ-MoC(001) and β-Mo2C(001) surfaces, the nanoparticles feature a larger number of localized states near the Fermi level, that will be available for bonding and to transfer electrons to the CO2 molecule. Results in the next section shows that this is indeed the case.
3.2 CO2 interaction with stoichiometric MoC nanoparticles
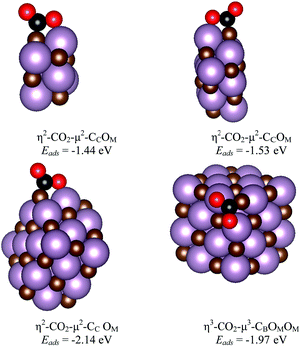
The main features for CO2 adsorption on the most stable surfaces of molybdenum carbides are known from previous work, particularly for δ-MoC(001) and β-Mo2C(011) surfaces.11,14 The Mo/C ratio is key for the catalytic performance not only in CO2 adsorption, but also in its hydrogenation to methanol or in the cleavage of C–O bonds. Therefore, analysis at different Mo/C ratios for CO2 interaction with MoCy nanoparticles is necessary, together with the chemical reactivity at several stoichiometric systems. This is precisely studied in the current and next section.Here, we consider the interaction of CO2 with the stoichiometric nanoparticles for all the contemplated sets. These are Mo6C6, Mo12C12, Mo24C24, and Mo32C32 nanoparticles. The interaction of CO2 with the three largest particles in this set involves similar binding geometries, regardless of nanoparticles size. In part, this comes from the fact that the rock-salt crystal structure emerges quite rapidly with size as the most stable one, as already shown for TiC nanoparticles.39 This also implies similar symmetry and similar adsorption sites. Three representative bonding modes were found for these nanoparticles, which can be defined as vertex, lateral, and facet. The structures for the most stable situations are reported in Fig. 5, whereas the rest of encountered minima in the representative modes mentioned above are reported in Fig. S2 of the ESI.† Here, the most stable structures for adsorbed CO2 involve bonding at vertex and lateral sites as shown in Table 1 and Fig. 5. In the vertex and facet modes, the bonding mode is η3-CO2–μ3-CBOMOM. In all the bonding configurations shown in Fig. 5, the C of CO2 binds to a C atom of the nanoparticle to form a strong C![[double bond, length as m-dash]](https://www.rsc.org/images/entities/char_e001.gif) C bond, while the O atoms of the adsorbate interact with Mo atoms. The case of Mo6C6 merits some additional comments as, even if the structure has a high symmetry, there are not carbon atoms at vertex and central facet sites, see Fig. 1 and Fig. S1 of the ESI,† implying that these adsorption modes are not possible. The details corresponding to this particular nanoparticle will be commented below together with other members of the Sset. In general, facet sites involve weak CO2 adsorption energies as expected from the case of the extended δ-MoC(001) surfaces, evidenced in Fig. S3 of the ESI,† reporting also the structures and adsorption energy for CO2 adsorption on the evaluated Mo12C12, Mo24C24, and Mo32C32, see Fig. S2 of the ESI,† stoichiometric nanoparticles in the lateral, vertex, and facet bonding modes.
C bond, while the O atoms of the adsorbate interact with Mo atoms. The case of Mo6C6 merits some additional comments as, even if the structure has a high symmetry, there are not carbon atoms at vertex and central facet sites, see Fig. 1 and Fig. S1 of the ESI,† implying that these adsorption modes are not possible. The details corresponding to this particular nanoparticle will be commented below together with other members of the Sset. In general, facet sites involve weak CO2 adsorption energies as expected from the case of the extended δ-MoC(001) surfaces, evidenced in Fig. S3 of the ESI,† reporting also the structures and adsorption energy for CO2 adsorption on the evaluated Mo12C12, Mo24C24, and Mo32C32, see Fig. S2 of the ESI,† stoichiometric nanoparticles in the lateral, vertex, and facet bonding modes.
| NP | Bonding mode | E ads | d(CO) | d(CO) | α(OCO) |
|---|---|---|---|---|---|
| Mo6C6 | η2-CO2–μ2-CCOM (lateral) | −1.44 | 1.38 | 1.22 | 125 |
| Mo12C12 | η3-CO2–μ3-CB OMOM (vertex) | −1.19 | 1.37 | 1.30 | 122 |
| η3-CO2–μ3-CB OMOM (facet) | −0.36 | 1.31 | 1.29 | 126 | |
| η2-CO2–μ2-CCOM (lateral) | −1.53 | 1.40 | 1.22 | 124 | |
| Mo24C24 | η3-CO2–μ3-CBOMOM (vertex) | −1.95 | 1.34 | 1.31 | 121 |
| η3-CO2–μ3-CBOMOM (facet) | −0.48 | 1.30 | 1.30 | 125 | |
| η2-CO2–μ2-CCOM (lateral) | −2.14 | 1.40 | 1.22 | 121 | |
| Mo32C32 | η3-CO2–μ3-CBOMOM (vertex) | −1.97 | 1.33 | 1.33 | 121 |
| η3-CO2–μ3-CBOMOM (facet) | −0.27 | 1.30 | 1.30 | 125 | |
| η2-CO2–μ2-CCOM (lateral) | −1.69 | 1.40 | 1.22 | 122 | |
| δ-MoC (001) | η1-CO2–μ1-CC | −1.20 | 1.29 | 1.29 | 129 |
The most stable mode in Mo6C6 (−1.44 eV), Mo12C12 (−1.53 eV), and Mo24C24 (−2.14 eV) is via lateral, while in Mo32C32 (−1.97 eV) it occurs via vertex interaction, see Fig. 5. These are all different from the situation reported for the extended on δ-MoC(001) surface,12 where these sites are not available, see Fig. S3 of the ESI.† On the other hand, the preference for sites with low coordination is as expected. Beyond the adsorption energy, the elongation of the C–O bond length, d(CO), and bending of the O–C–O angle, α(OCO), are useful descriptors to analyze the interaction of CO2 with these nanoparticles. For a weak interaction, as at facet site, the d(CO) elongation is small but the α(OCO) bending is noticeably different from that of the molecule in the gas phase, see values in Table 1, and depiction in Fig. S2 and S3 of the ESI.† The largest d(CO) elongations with respect to the gas phase structure involve a lateral interaction via a η2-CO2–μ2-CCOM bonding mode, with increments of 0.200, 0.224, 0.227, and 0.200 Å, for Mo6C6, Mo12C12, Mo24C24, and Mo32C32, respectively; while the respective value on δ-MoC(001) is 0.113 Å on the facet adsorption mode. Clearly, the activation of the C–O bond is larger for the nanoparticles, as expected. The origin of the difference between CO2 bonding at nanoparticles and on the extended surface is the lateral bonding mode, where only two atoms of CO2 interact with the nanoparticles with a concomitant bond elongation. On the other hand, facet and vertex bonding modes involves the three CO2 atoms decreasing the extent of bond elongation.
To further analyze the interaction between CO2 and the stoichiometric nanoparticles we focus on the deformation, Edef, distortion, Edist, and attachment, Eatt, energy values defined in the previous section and summarized in Table 2. Interestingly, the extent of d(CO) elongation is larger at lateral sites, but this does not necessarily relates to a higher CO2Edef, which may be due to the fact that on these sites only a single CO2 C–O bond interacts with the nanoparticle. The CO2 deformation is larger at facet sites, even though the adsorption energy in these sites is weak. Upon CO2 adsorption, the nanoparticles also undergo geometric changes. Overall, the nanoparticle distortion energy is larger when vertex sites are involved. For the Mo32C32 case, the vertex, facet, and lateral sites Edist values are 0.93, 0.66, and 0.56 eV, respectively, in agreement with the above commented trend.
| Nanoparticle | E form | Site | E ads | E dist | E def | E att | Q |
|---|---|---|---|---|---|---|---|
| a Result in agreement with that reported in ref. 29. | |||||||
| Mo6C6 | −3.28 | Lateral | −1.44 | 0.61 | 2.99 | −5.04 | −0.70 |
| Mo12C12 | Vertex | −1.19 | 1.43 | 3.54 | −6.16 | −0.47 | |
| Facet | −0.36 | 0.56 | 2.81 | −3.73 | −0.52 | ||
| −2.41 | Lateral | −1.53 | 0.65 | 2.95 | −5.13 | −0.58 | |
| Mo24C24 | Vertex | −1.95 | 0.86 | 3.18 | −5.99 | −0.47 | |
| Facet | −0.48 | 0.36 | 2.86 | −3.70 | −0.40 | ||
| −1.72 | Lateral | −2.14 | 0.37 | 3.48 | −5.99 | −0.42 | |
| Mo32C32 | Vertex | −1.97 | 0.93 | 3.50 | −6.40 | −0.61 | |
| Facet | −0.27 | 0.66 | 2.85 | −3.78 | −0.72 | ||
| −1.41 | Lateral | −1.69 | 0.56 | 3.13 | −5.38 | −0.38 | |
| δ-MoC(001) | −0.51a | Facet | −1.20 | 0.16 | 2.48 | −3.84 | −0.62 |
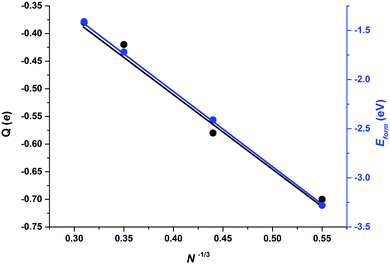
Apart from those trends related to different adsorption modes, there are not clear trends relating adsorption, distortion, and deformation energies, highlighting the local character of the interaction between CO2 and the stoichiometric MoNCN nanoparticles. The Eatt analysis provides some further clues. For the Mo12C12 nanoparticle, the vertex, lateral, and facet sites Eatt values are −6.16, −5.13, and −3.73 eV, respectively, which follows the observed Eads trends and also coincides with the trends in Edist, clearly implying that the adsorption is highly influenced not only by the site coordination, i.e. Eads and Eatt is larger for undercoordinated sites at vertices of NP edges, but also the larger attachment energy compensates larger NP distortion energies, easier at low-coordinated sites, featuring a larger lability, in a similar fashion as observed on transition metal nanoparticles.40 Note in passing by that, even if Eatt is larger for vertex sites, the extent of the d(CO) elongation is larger for lateral sites, though. This is related to the extent of charge transfer from the nanoparticle to the adsorbed CO2 molecule, seized by Bader charges encompassed in Table 2. For the most stable situation, the charge transfer versus particle size —measured as N−1/3, with N being the number of MoC units—39 exhibits a clear linear behavior with a regression coefficient value, R2, of 0.986, see Fig. 6, implying a smaller charge transfer for larger nanoparticles. A linear trend is also observed for the formation energy, Eform, revealing that larger nanoparticles are more stable, with a concomitant particular electronic arrangement, which translates in a lower tendency to transfer charge, which can be explained by a decrease in quantum confinement, or in other words, the electron density becomes delocalized into bands which hinders the charge transfer to CO2. This is also supported by the DOS plots in Fig. 4 showing that small nanoparticles exhibits localized states near the Fermi level which are suitable for bonding to adsorbates,
3.3 CO2 interaction with small and intermediate non-stoichiometric MoCy nanoparticles
Going beyond the stoichiometric nanoparticles analysis, from the total number of cases considered in Sset, we selected a set of 17 structures corresponding to the most stable isomers. In total, 541 initial bonding geometries were used from geometry optimizations, which led to 209 different final configurations. For each stoichiometry, the most stable bare structures, see Fig. S1 of the ESI,† were chosen to analyze the interaction by making use of the same energetic contributions used for the stoichiometric nanoparticles, and the results are summarized in Table S4 of the ESI.† On these small nanoparticles, the η3-CO2–μ2-CBOMOM bonding mode is preferred in 71% of cases, although when considering all sets of nanoparticles, this mode represents 46% of the systems, indicating that this mode tends to be preferred on the small clusters. Not surprisingly, the obtained results indicate that there is not a relationship between the stability of the bare nanoparticle and Eads, even if one would intuitively predict that Eads would naturally get stronger for the lesser stable isomers. For instance, in the case of Mo6C4, the largest Eads of −3.18 eV corresponds to the third most stable isomer, it becomes −2.79 eV for fourth isomer, and −2.61 eV for second isomer, see Table S4 of the ESI.† The reason for this trend is the appearance of different reactive sites for the different isomers. The analysis of Tables 3 and Table S3 of the ESI† shows that this trend is common to most of the clusters, and even holds for particles in the Iset, succinctly implying that for such sizes every atom counts, in terms of geometry, electronic structure, and chemical activity.| NP | Bonding mode | E ads | d(CO) | d(CO) | α(OCO) |
|---|---|---|---|---|---|
| Mo4C6 | η2-CO2–μ2-CCOM | −3.10 | 1.37 | 1.22 | 125 |
| Mo5C6 | η3-CO2–μ2-CBOMOM | −2.65 | 1.27 | 1.27 | 135 |
| Mo6C4 | η3-CO2–μ2-CBOMOM | −3.18 | 1.27 | 1.27 | 136 |
| Mo6C5 | η3-CO2–μ2-CBOMOM | −2.68 | 1.27 | 1.27 | 139 |
| Mo8C12 | η2-CO2–μ1-CMOM | −1.03 | 1.32 | 1.21 | 135 |
| Mo10C12 | η3-CO2–μ3-CCOMOM | −1.73 | 1.29 | 1.29 | 131 |
| Mo12C6 | η3-CO2–μ3-CBOMOM | −2.56 | 1.35 | 1.33 | 125 |
| Mo12C8 | η3-CO2–μ3-CBOMOM | −2.44 | 1.37 | 1.34 | 116 |
| Mo12C10 | η3-CO2–μ3-CBOMOM | −2.03 | 1.37 | 1.33 | 117 |
| Mo14C13 | η3-CO2–μ3-CCOMOM | −1.45 | 1.29 | 1.28 | 132 |
| β-Mo2C(001)-C | η2-CO2–μ2-CCOM | −1.32 | 1.37 | 1.21 | 127 |
| β-Mo2C(001)-Mo | η3-CO2–μ3-CBOMOB | −1.87 | 1.37 | 1.28 | 126 |
Taking the stoichiometric Mo6C6 system as a reference one can get further insight into the role of stoichiometry, at least for particles in the Sset. For a given Mo/C ratio, one can focus on the bonding mode or the adsorption energy. Tables 3 and 4 show that in this set of nanoparticles, for a given bonding mode, there is no a clear trend on geometric, electronic, and energy quantities. Focusing on the largest adsorption energy for a given stoichiometry, one can see that going from Mo6C6 to Mo5C6 or Mo6C5 there in an increase of the CO2 adsorption energy from −1.44 to −2.65 and −2.68 eV, respectively. If one continues removing C or Mo atoms to Mo4C6 and Mo6C4, Eads rises again to −3.10 eV and −3.18 eV, respectively. Therefore, with a given size, moving from stoichiometric to non-stoichiometric nanoparticles leads to a stronger interaction with CO2, which is clearly due to the appearance of low coordinated and low symmetry sites in the non-stoichiometric nanoparticles, see depictions in Fig. S1 and S4 of the ESI.† In other words, the loss of stability due to C or Mo removal from Mo6C6 is compensated by a stronger interaction with CO2.
| NP | Mo/C ratio | E ads | E dist | E def | E att | Q |
|---|---|---|---|---|---|---|
| Mo4C6 | 0.67 | −3.10 | 0.00 | 2.98 | −6.08 | −0.65 |
| Mo5C6 | 0.83 | −2.65 | 0.19 | 1.86 | −4.70 | −0.97 |
| Mo6C4 | 1.50 | −3.18 | 0.08 | 1.86 | −5.12 | −1.04 |
| Mo6C5 | 1.20 | −2.68 | 0.07 | 1.70 | −4.45 | −0.94 |
| Mo6C5 | 1.20 | −2.67 | 0.35 | 3.50 | −6.52 | −1.25 |
| Mo8C12 | 0.67 | −1.03 | 0.22 | 1.96 | −3.21 | −0.53 |
| Mo10C12 | 0.83 | −1.73 | 0.14 | 2.38 | −4.25 | −0.58 |
| Mo12C6 | 2.00 | −2.56 | 0.68 | 3.41 | −6.65 | −1.35 |
| Mo12C8 | 1.50 | −2.44 | 0.40 | 4.26 | −7.10 | −1.28 |
| Mo12C10 | 1.20 | −2.03 | 0.60 | 4.10 | −6.73 | −1.42 |
| Mo14C13 | 1.08 | −1.45 | 0.26 | 2.26 | −3.97 | −0.73 |
| β-Mo2C(001)-C | 2.00 | −1.32 | 0.53 | 2.83 | −4.68 | −0.56 |
| β-Mo2C(001)-Mo | 2.00 | −1.87 | 0.15 | 3.12 | −5.14 | −0.87 |
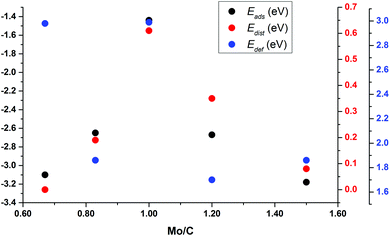
To understand the trends in the Eads for these small nanoparticles, Fig. 7 reports Eads and Edist for clusters surrounding Mo6C6 in Sset as a function of the Mo/C ratio; see also Fig. S5 and S6 in the ESI.† This plot clearly shows that Eads follows the Edist trend. This also relates to differences in binding sites and symmetry of the bare nanoparticles. Mo6C6 is the most symmetric among those in Sset, and CO2 adsorption breaks the symmetry with a concomitant high Edist of 0.61 eV. For either Mo5C6 or Mo6C5, Edist decreases to 0.19 eV and 0.35 eV, respectively. The lower symmetry of Mo5C6 and Mo6C5 and the larger number of low-coordinated atoms results in a rather high Eads at a low Edist. When one keeps removing Mo and C atoms to form Mo4C6 and Mo6C4, the loss in symmetry relative to Mo6C6 is even higher. On the other hand, Edef is strongly related to the charge transfer from the cluster to the adsorbed CO2, which also leads to a considerable d(CO) elongation; see Table 4 and Fig. S5 and S6 of the ESI.† The larger d(CO) elongation corresponds to Mo6C6 (1.38 Å) and Mo4C6 (1.37 Å), involving a high CO2 deformation energy of 2.99 eV and 2.98 eV, respectively. These high Edef values imply that the cost of d(CO) elongation and α(OCO) bending is highest for these small nanoparticles.
For Mo6C6 and Mo4C6, the CO2 bonding mode is η2-CO2–μ2-CCOM. Consequently, the extent of electron density transfer towards CO2 is similar in both systems, 0.70 and 0.65e, respectively. The CO2 bonding mode on Mo5C6, Mo6C5, and Mo6C4 is η3-CO2–μ2-CBOMOM, yielding to similar CO2 deformation energy of 1.86, 1.70, and 1.86 eV, respectively. Therefore, among nanoparticles in Sset, Mo5C6, Mo6C5, and Mo6C4 involved the lowest Edef. Note also that for the η3-CO2–μ2-CBOMOM mode, Edef also relates to the extent of charge transfer with values of −0.97, −0.94, and −1.04e for Mo5C6, Mo6C5, and Mo6C4, respectively. The difference between η2-CO2–μ2-CCOM and η3-CO2–μ2-CBOMOM bonding modes is that the former involves larger d(CO) elongations and, therefore, larger Edef and Q. These differences arise from the number of atoms in the nanoparticle that interact with CO2 as electron transfer to CO2 is favored for the η3 mode. For the η2 mode, the d(CO) elongation is larger, but at a higher Edef. Considering the three sets of nanoparticles separately, it is possible to extract a few general trends. First, stoichiometric and non-stoichiometric nanoparticles display a clear preference of CO2 to bind via η2-CO2–μ2-CCOM structure, as it was found in 46% of the cases among the 26 studied nanoparticles. Fig. 8 and Fig. S7 of the ESI† shows that the trends in adsorption and attachment energy in going from Mo4C6 up to Mo32C32 exhibits a clear oscillatory character, which is as expected for nanoparticles below the scalable regime.36
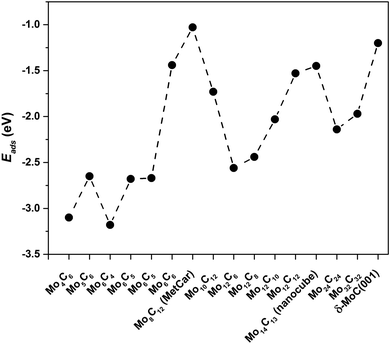 | ||
| Fig. 8 CO2 adsorption energy, Eads, for the most stable CO2 bonding mode on the different nanoparticles. | ||
A comparison of the results reported here for the interaction of CO2 with MoCy nanoparticles with those reported previously for the interaction of this molecule with extended MoC, Mo2C surfaces12,41 and other carbides,42,43 reveals that the nanoparticles are much more efficient in activating C–O bonds. This is due to the presence of low coordinated sites and also a consequence of quantum confinement effects, that lead to an increase of localized states near the Fermi level.
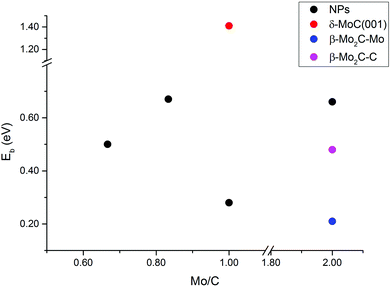
The energy barriers for CO2 dissociation (CO2* → CO* + O*) were calculated Mo5C6, Mo6C6, Mo8C12 (MetCar) and Mo12C6, thus covering the whole range of Mo/C ratios above (0.67, 0.83, 1.00, and 2.00, respectively), see Fig. 9. Values previously reported for dissociation of CO2 on δ-MoC(001), β-Mo2C(001)-Mo and β-Mo2C(001)-C surfaces are also included for comparison. The results evidence that, overall, the NPs have lower CO2 dissociation barriers than δ-MoC(001), regardless of the Mo/C ratio. Hence, the barriers decreased from 1.41 eV on the surface to barriers in the range of 0.28–0.67 eV on the NPs. Indeed, for Mo/C = 1.00, the barrier on the extended δ-MoC(001) surface is 1.41 eV while on Mo6C6 is 0.28 eV only. It is worth mentioning that the absence of a clear trend in the barriers with respect to variations in the Mo/C ratio is a consequence of the non-scalable regime for the scrutinized NPs. An increase in the number of Mo atoms, i.e. above stoichiometric values (Mo/C = 2.00), yields the higher barrier on a NP (Mo12C6, 0.66 eV), larger than on both Mo- and C-terminated β-Mo2C(001) surfaces (0.21 and 0.48 eV). Therefore, for NPs with an excess of Mo atoms, the CO2 dissociation is not advantageous, yielding better results on the β-Mo2C(001) surfaces. However, NPs with an excess of C atoms (Mo/C < 1.00) or stoichiometric NPs (Mo/C = 1.00) yield low CO2 dissociation barriers, indeed much lower than on δ-MoC(001), and in the range of the barriers found on β-Mo2C(001) surfaces. However, the CO2 binding and the subsequent dissociation is favored on the NPs. This is because the binding on NPs is stronger than on surfaces, due to the low coordination of atoms present in the NPs, leading to a boost in chemical reactivity for these small systems.
The fact that these nanoparticles are also able to dissociate H2 and to store atomic hydrogen at the surface17 suggests that these carbide systems should be able to hydrogenate CO2 as shown before in experiments and model calculations for MoCy nanoparticles supported on Au(111)16 and also on other supports,15 with a remarkable improvement over similar bulk MoC samples. However, more work from both sides, theory and experiment, is needed to design MoCy nanoparticles that could be good catalysts for the transformation of CO2 to oxygenates and/or to light alkanes.
4. Conclusions
The interaction of CO2 with a set of MoCy nanoparticles of increasing size up going from small clusters to the nanoscale has been systematically studied through density functional theory calculations. The set of studied nanoparticles includes stoichiometric and non-stochiometric cases, in order to provide information that is expected to be useful for catalysis experiments using these systems,16,17,21 for instance, in the understanding of their interaction with CO2, paving the way towards their improvement through a rational design.44For the smallest members of the series, global optimization techniques were used to explore the low-energy isomers. For Mo4C6 and Mo5C6 several isomers exist close in energy to the lowest energy one, where only two low-energy isomers have been found for Mo6C5, while the same isomer for stoichiometric Mo6C6 was the same for both techniques. For nanoparticles not deviating too much from stoichiometry, e.g. Mo6C5 and Mo5C6, the lowest energy isomer either coincides to that predicted by the cascade procedure used in previous works,16,21 or is very close in energy to the putative global minimum. However, the prediction by the cascade procedure fails for cases such as Mo4C6 and Mo6C4.
For all these small nanoparticles, the most stable isomer of a given nanoparticle does not always lead to the largest CO2 adsorption energy and it is necessary to analyze the CO2 bonding in a set of stable isomers. In general, Mo-rich nanoparticles favors a strong CO2 bonding and the adsorption energy follows quite an oscillatory trend with nanoparticle size, which is due to several effects. On the one hand, the behavior exhibited by very small nanoparticles is as expected as they correspond to the non-scalable regime where every atom counts. On the other hand, the bonding mode may vary in going from one nanoparticle to another but there is also a clear trend to decrease the adsorption energy with increasing the nanoparticle sizes.
The analysis of the various contributions to the bonding shows that the adsorption energy alone does not provide enough information, whereas the attachment energy quantity provides a more accurate information as it takes into account the energy necessary to deform CO2 from the gas phase to the adsorbed structure, and that of the nanoparticle distortion induced by the adsorbed molecule. The CO2 attachment energy follows the general trend in Mo/C ratio: 1.50, 2.00, 1.20, 1.00, 0.67, 1.08, 0.83. Hence, stoichiometric systems (Mo/C = 1.00) exhibit an intermediate behavior. However, it is interesting to note that in the stoichiometric nanoparticles the distortion induced by CO2 is larger than in the non-stoichiometric ones. Regarding the Mo/C ratio, the nanoparticles distortion decreases along the 1.50, 1.20, 1.08, 0.83, and 0.67 series of Mo/C values. The CO2 bonding to the stoichiometric Mo12C12 and nearly stoichiometric Mo14C13 nanoparticles is very similar to that corresponding to the extended surfaces.
The CO2 dissociation barriers on MoCy nanoparticles are remarkably lower than on δ-MoC(001) surface,14 and in the range of β-Mo2C(001) surfaces.41 The nanoparticles with an excess carbon atoms (ratio Mo/C < 1.00) and stoichiometric systems (Mo/C = 1.00) are advantageous for CO2 dissociation. The extent CO2 binding energy of CO2 dissociation indicates that the catalytic performance on nanoparticles is better than on extended surfaces.
In all cases, CO2 adsorption implies a considerable charge transfer from the nanoparticle and, for nanoparticles larger than Mo12C12, its magnitude tends to converge to the value corresponding to the extended surface that seems to indicate that the scalable regime is almost attained at this particle size.
Conflicts of interest
There are no conflicts to declare.Acknowledgements
The research carried out at the Universitat de Barcelona has been supported by the Spanish MCIN/AEI/10.13039/501100011033 funded RTI2018-095460-B-I00 and María de Maeztu MDM-2017-0767 grants, including funding from European Union and, in part, by and COST Action CA18234. A significant part of the computational resources has been provided by the Red Española de Supercomputación through projects QS-2021-1-0006, QS-2020-3-0003, and QS-2020-2-0011. C. J.-O. and E. F. acknowledge to Universidad de Medellín for financial support under the internal project 1143. Part of this research used resources of the Center for Functional Nanomaterials, which is a U.S. DOE Office of Science Facility, and the Scientific Data and Computing Center, a component of the Computational Science Initiative, at Brookhaven National Laboratory (BNL) under Contract No. DE-SC0012704. The research carried out at the Chemistry Department of BNL was supported by the division of Chemical Science, Geoscience, and Bioscience in the Office of Basic Energy Science at the U.S, DOE (DE-SC0012704).References
- S. T. Wismann, K. E. Larsen and P. M. Mortensen, Angew. Chem., Int. Ed., 2022, 61, e202109696 Search PubMed.
- P. M. Mortensen and I. Dybkjær, Appl. Catal., A, 2015, 495, 141–151 CrossRef CAS.
- W. Wang, S. P. Wang, X. B. Ma and J. L. Gong, Chem. Soc. Rev., 2011, 40, 3703–3727 RSC.
- E. V. Kondratenko, G. Mul, J. Baltrusaitis, G. O. Larrazabal and J. Perez-Ramirez, Energy Environ. Sci., 2013, 6, 3112–3135 RSC.
- H. Liu. World Scientific, Chemical Industry Press, China, 2013, pp.185–309 Search PubMed.
- S. Kattel, P. J. Ramírez, J. G. Chen, J. A. Rodriguez and P. Liu, Science, 2017, 355, 1296–1299 CrossRef CAS PubMed.
- J. Zhou, Z. Gao, G. Xiang, T. Zhai, Z. Liu, W. Zhao, X. Liang and L. Wang, Nat. Commun., 2022, 13, 327 CrossRef CAS PubMed.
- R. B. Levy and M. Boudart, Science, 1973, 181, 547–549 CrossRef CAS PubMed.
- H. H. Hwu and J. G. Chen, Chem. Rev., 2005, 105, 185–212 CrossRef CAS PubMed.
- H. Shou and R. J. Davis, J. Catal., 2013, 306, 91–99 CrossRef CAS.
- S. Posada-Pérez, F. Viñes, J. A. Rodriguez and F. Illas, Top. Catal., 2015, 58, 159–173 CrossRef.
- S. Posada-Pérez, F. Viñes, P. J. Ramirez, A. B. Vidal, J. A. Rodriguez and F. Illas, Phys. Chem. Chem. Phys., 2014, 16, 14912–14921 RSC.
- M. D. Porosoff, B. H. Yan and J. G. Chen, Energy Environ. Sci., 2016, 9, 62–73 RSC.
- S. Posada-Pérez, P. J. Ramírez, J. Evans, F. Viñes, P. Liu, F. Illas and J. A. Rodriguez, J. Am. Chem. Soc., 2016, 138, 8269–8278 CrossRef PubMed.
- F. G. Baddour, E. J. Roberts, A. T. To, L. Wang, S. E. Habas, D. A. Ruddy, N. M. Bedford, J. Wright, C. P. Nash, J. A. Schaidle, R. L. Brutchey and N. Malmstadt, J. Am. Chem. Soc., 2020, 142, 1010–1019 CrossRef CAS PubMed.
- M. Figueras, R. A. Gutiérrez, F. Viñes, P. J. Ramírez, J. A. Rodriguez and F. Illas, ACS Catal., 2021, 11, 9679–9687 CrossRef CAS.
- M. Figueras, R. A. Gutiérrez, P. J. Ramírez, J. A. Rodriguez and F. Illas, J. Phys. Chem. Lett., 2020, 11, 8437–8441 CrossRef CAS PubMed.
- M. Figueras, R. Gutierrez, H. Prats, F. Viñes, P. J. Ramirez, F. Illas and J. A. Rodriguez, Phys. Chem. Chem. Phys., 2020, 22, 7110–7118 RSC.
- M. M. Rohmer, M. Bernard and J. M. Poblet, Chem. Rev., 2000, 100, 495–542 CrossRef CAS PubMed.
- M. Figueras, A. Jurado, A. Morales-García, F. Viñes and F. Illas, Phys. Chem. Chem. Phys., 2020, 22, 19249–19253 RSC.
- C. Jimenez-Orozco, M. Figueras, E. Flórez, F. Viñes, J. A. Rodriguez and F. Illas, J. Phys. Chem. C, 2021, 125, 6287–6297 CrossRef CAS.
- T. J. Gorey, B. Zandkarimi, G. Li, E. T. Baxter, A. N. Alexandrova and S. L. Anderson, ACS Catal., 2020, 10, 4543–4558 CrossRef CAS.
- M. Ha, E. T. Baxter, A. Cass, S. L. Anderson and A. N. Alexandrova, J. Am. Chem. Soc., 2017, 139, 11568–11575 CrossRef CAS PubMed.
- ASCEC stands for the Spanish acronym for Annealing Simulado Con Energía Cuántica, i.e. Simulated Annealing with Quantum Energy.
- J. F. Pérez, E. Flórez, C. Z. Hadad, P. Fuentealba and A. Restrepo, J. Phys. Chem. A, 2008, 112, 5749–5755 CrossRef PubMed.
- J. F. Pérez, C. Z. Hadad and A. Restrepo, Int. J. Quant. Chem., 2008, 108, 1653–1659 CrossRef.
- G. Kresse and J. Furthmüller, Phys. Rev. B: Condens. Matter Mater. Phys., 1996, 54, 11169–11186 CrossRef CAS PubMed.
- J. P. Perdew, K. Burke and M. Ernzerhof, Phys. Rev. Lett., 1996, 77, 3865–3868 CrossRef CAS PubMed.
- J. R. D. S. Politi, F. Viñes, J. A. Rodriguez and F. Illas, Phys. Chem. Chem. Phys., 2013, 15, 12617–12625 RSC.
- S. Grimme, J. Antony, S. Ehrlich and H. A. Krieg, J. Chem. Phys., 2010, 132, 154104 CrossRef PubMed.
- C. Jimenez-Orozco, E. Flórez, F. Viñes, J. A. Rodriguez and F. Illas, ACS Catal., 2020, 10, 6213–6222 CrossRef CAS.
- P. E. Blöchl, Phys. Rev. B: Condens. Matter Mater. Phys., 1994, 50, 17953–17979 CrossRef PubMed.
- G. Kresse and D. Joubert, Phys. Rev. B: Condens. Matter Mater. Phys., 1999, 59, 1758–1775 CrossRef CAS.
- A. Morales-García, A. Fernández-Fernández, F. Viñes and F. Illas, J. Mater. Chem. A, 2018, 6, 3381–3385 RSC.
- R. Bader, Atoms in Molecules – A Quantum Theory, Oxford University Press, New York, 1990 Search PubMed.
- S. T. Bromley, I. de, P. R. Moreira, K. M. Neyman and F. Illas, Chem. Soc. Rev., 2009, 38, 2657–2670 RSC.
- A. H. Larsen, J. J. Mortensen, J. Blomqvist, I. E. Castelli, R. Christensen, M. Dułak, J. Friis, M. N. Groves, B. Hammer, C. Hargus, E. D. Hermes, P. C. Jennings, P. B. Jensen, J. Kermode, J. R. Kitchin, E. L. Kolsbjerg, J. Kubal, K. Kaasbjerg, S. Lysgaard, J. B. Maronsson, T. Maxson, T. Olsen, L. Pastewka, A. Peterson, C. Rostgaard, J. Schiøtz, O. Schütt, M. Strange, K. S. Thygesen, T. Vegge, L. Wilhelmsen, M. Walter, Z. Zeng and K. W. Jacobsen, J. Phys.: Condens. Matter, 2017, 29, 273002 CrossRef PubMed.
- G. Henkelman, B. P. Uberuaga and H. Jónsson, J. Chem. Phys., 2000, 113, 9901–9904 CrossRef CAS.
- O. Lamiel-Garcia, S. T. Bromley and F. Illas, Theor. Chem. Acc., 2013, 132, 1312–1318 Search PubMed.
- F. Viñes, C. Loschen, F. Illas and K. M. Neyman, J. Catal., 2009, 266, 59–63 CrossRef.
- S. Posada-Pérez, P. J. Ramírez, R. Gutiérrez, D. Stacchiola, F. Viñes, P. Liu, F. Illas and J. A. Rodriguez, Catal. Sci. Technol., 2016, 6, 6766–6777 RSC.
- C. Kunkel, F. Viñes and F. Illas, Energy Environ. Sci., 2016, 9, 141–144 RSC.
- M. G. Quesne, A. Roldan, N. H. De Leeuw and C. R. A. Catlow, Phys. Chem. Chem. Phys., 2019, 21, 10750–10760 RSC.
- L. R. Karadaghi, M. S. Madani, E. M. Williamson, A. T. To, S. E. Habas, F. G. Baddour, J. A. Schaidle, D. A. Ruddy, R. L. Brutchey and N. Malmstadt, ACS Appl. Nano Mater., 2022, 5, 1966–1975 CrossRef CAS.
Footnote |
| † Electronic supplementary information (ESI) available: Effect of vacuum region extent to the Eads; Structural Sset isomers; Number of considered initial and final CO2 bonding modes; Bonding model, energy quantities, and Bader charges; Most stable Sset geometries; Most stable CO2 structures and adsorption energies on MoC nanoparticles; CO2 adsorption on δ-MoC(001) (left), β-Mo2C(001)-C (middle), and β-Mo2C(001)-Mo surfaces; CO2 adsorption on non-stoichiometric MoCy clusters. Attachment energies and Bader charges for CO2 adsorbed on small nanoparticles; CO2 deformation energies and Bader charges for CO2 adsorbed on small nanoparticles; CO2 attachment energies and Bader charges on the different nanoparticles. See DOI: https://doi.org/10.1039/d2cp01143c |
| This journal is © the Owner Societies 2022 |

